


Drawdown Signal Confirmed!

The 5% drawdown alert has been confirmed for the first time since January 2022. The alert is confirmed when we have 2 consecutive closes below the 200 day simple moving average. There are 16 times that this alert has been confirmed for the S&P. The drawdowns from peak to trough when the alert has been confirmed have been:
-6% minimum
-19% average
-50% maximum
The market has reached a lower low in every prior instance of a confirmed alert.
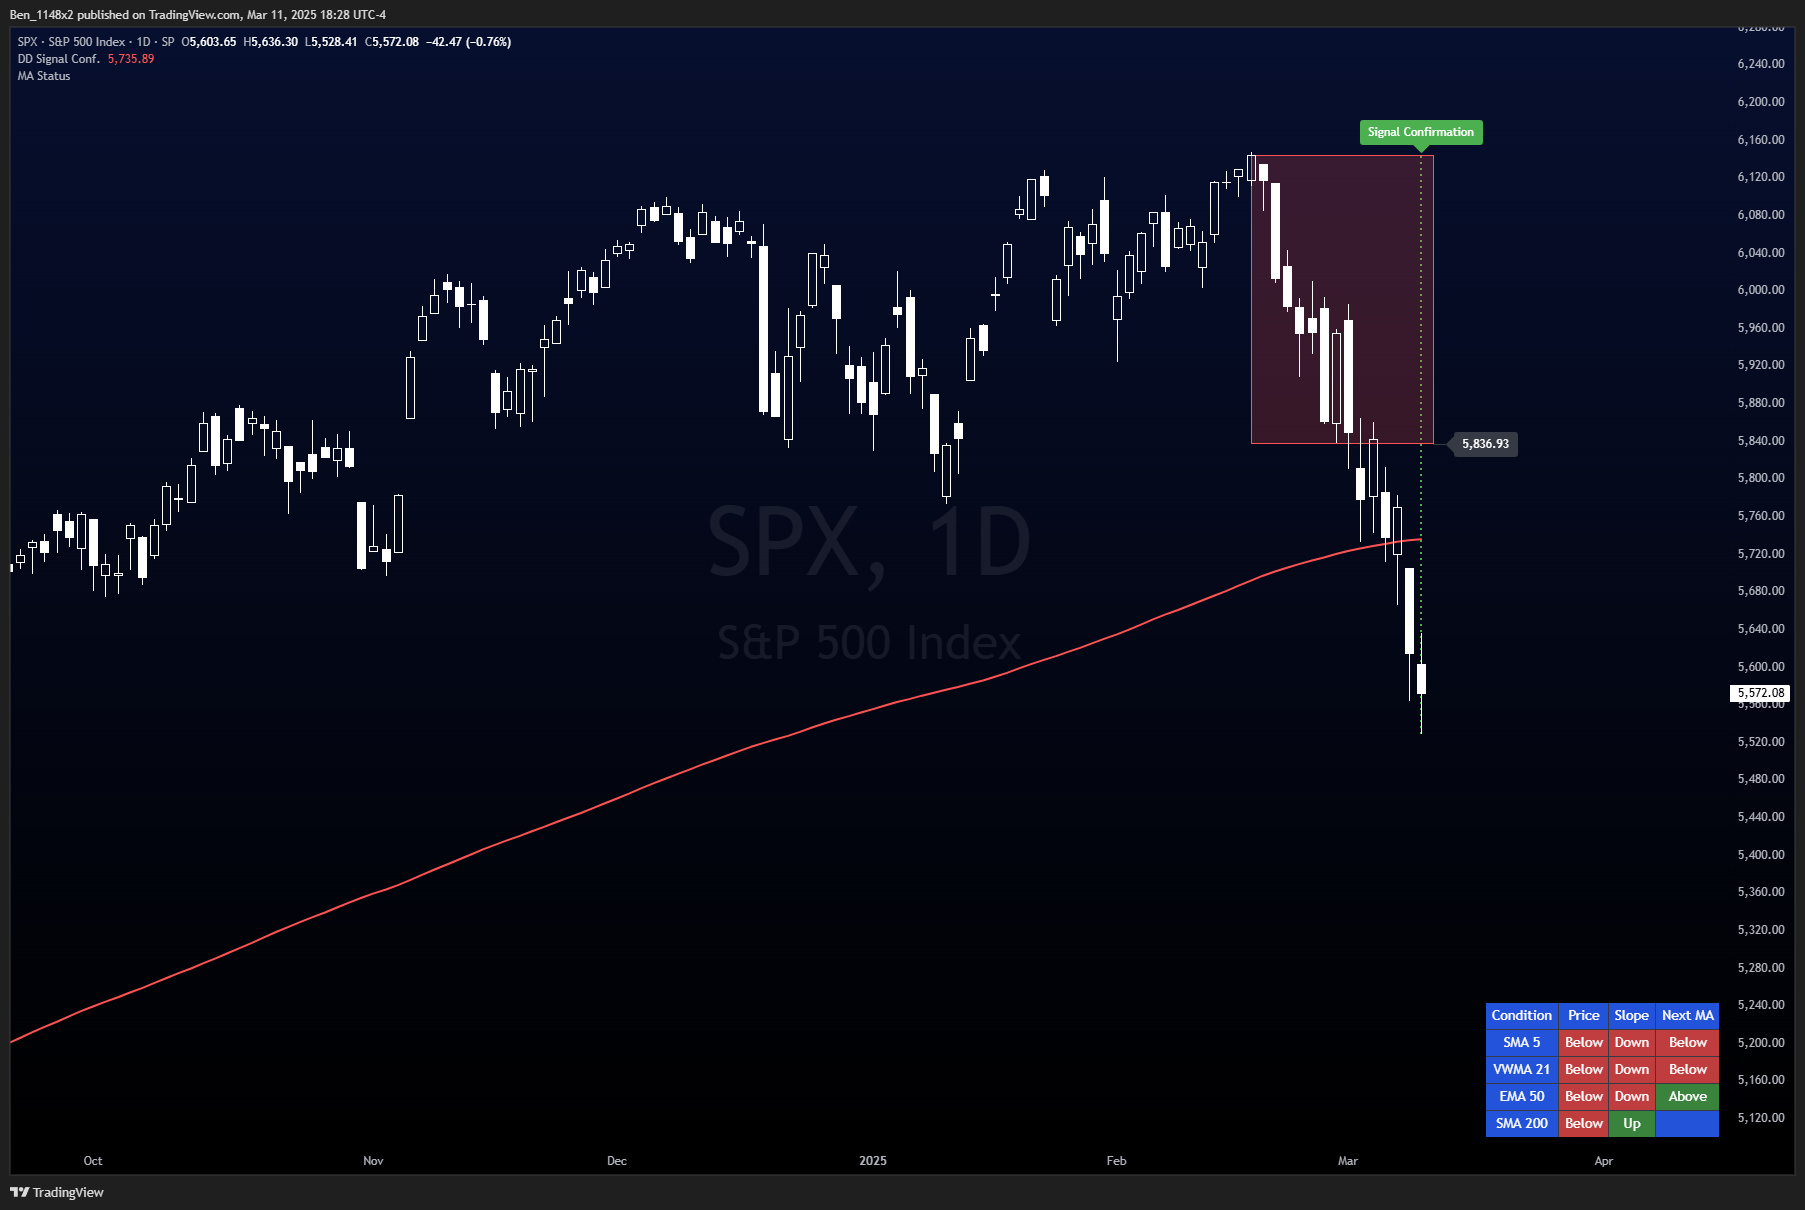
On our last call we discussed looking for the market to bounce and offer an opportunity to protect funds, but have not seen once. I went back through the prior instances. We have 37 alerts prior to this one. 27 (73%) have seen a bounce. However, we have 16 confirmed alerts, and 15 (94%) of those have seen a bounce.
This table summarizes the drawdowns from the most important market timing signals that I follow.

4 of10 signals are red, with 2 likely to flip from yellow to red when the week closes.

Their occurrences are highlighted in red on this chart. Note that the earliest data for my put call model begins in 2007, while the others are back tested to 1980.

I’m going to organize my charts for further reducing exposure, bottom signals for re-entry, and sectors and positions of strength that we want to take advantage of when we come out of this.
I’ll schedule the next subscriber call for Thursday after market close.
Thank u for all you do. Will likely not be able to attend at that time. But, will look for the recording if you post one.