Introduction
This week I’m going to cover some of the recent macro updates, a view of inter market relationships, and a couple of opportunities that I see in energy. I am not deploying much new capital until I get a better feel for things. I am closing weak short term position, reducing position size of current trades, and moving some proceeds into short term treasuries.
Macro and Earnings
Macroeconomics
The upcoming FOMC meeting is a focal point next week. While a rate cut isn't anticipated, the market will be keen on hints regarding future rate adjustments.
This week's most significant economic data included CPI, PPI, and employment figures.
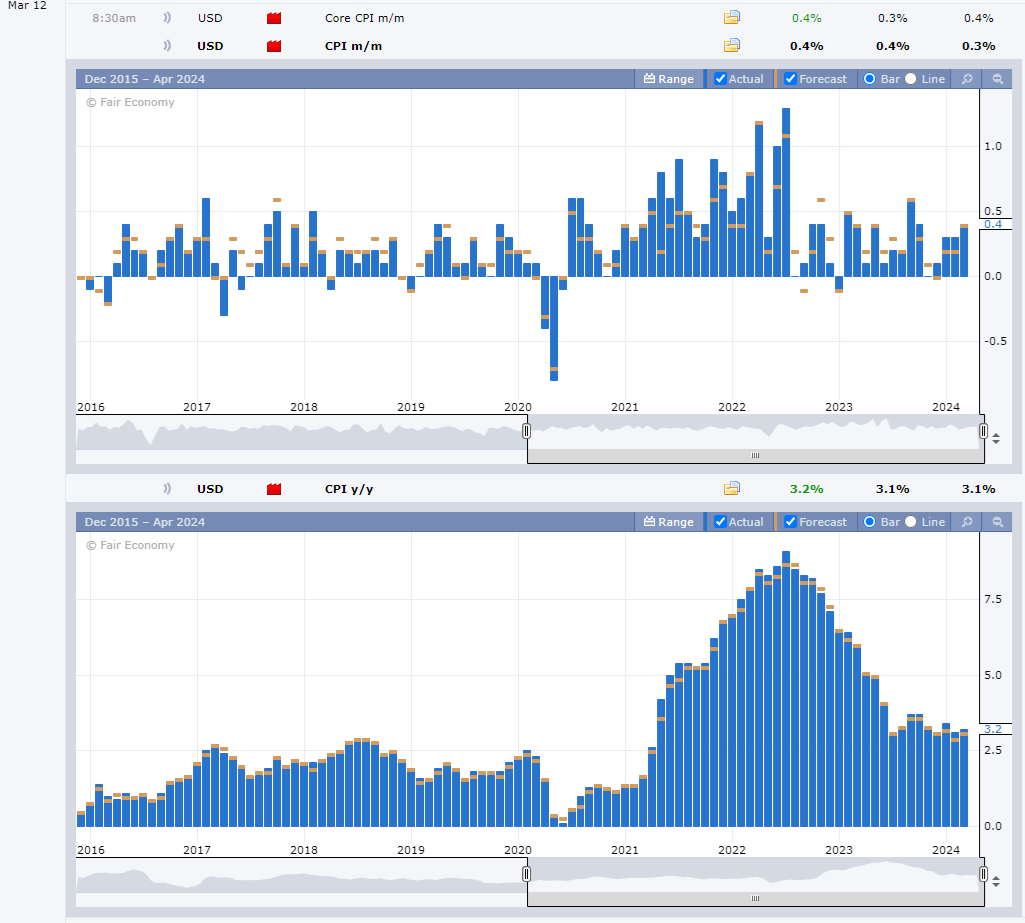
CPI (month-over-month and year-over-year) was slightly higher than anticipated, primarily driven by housing and core services.
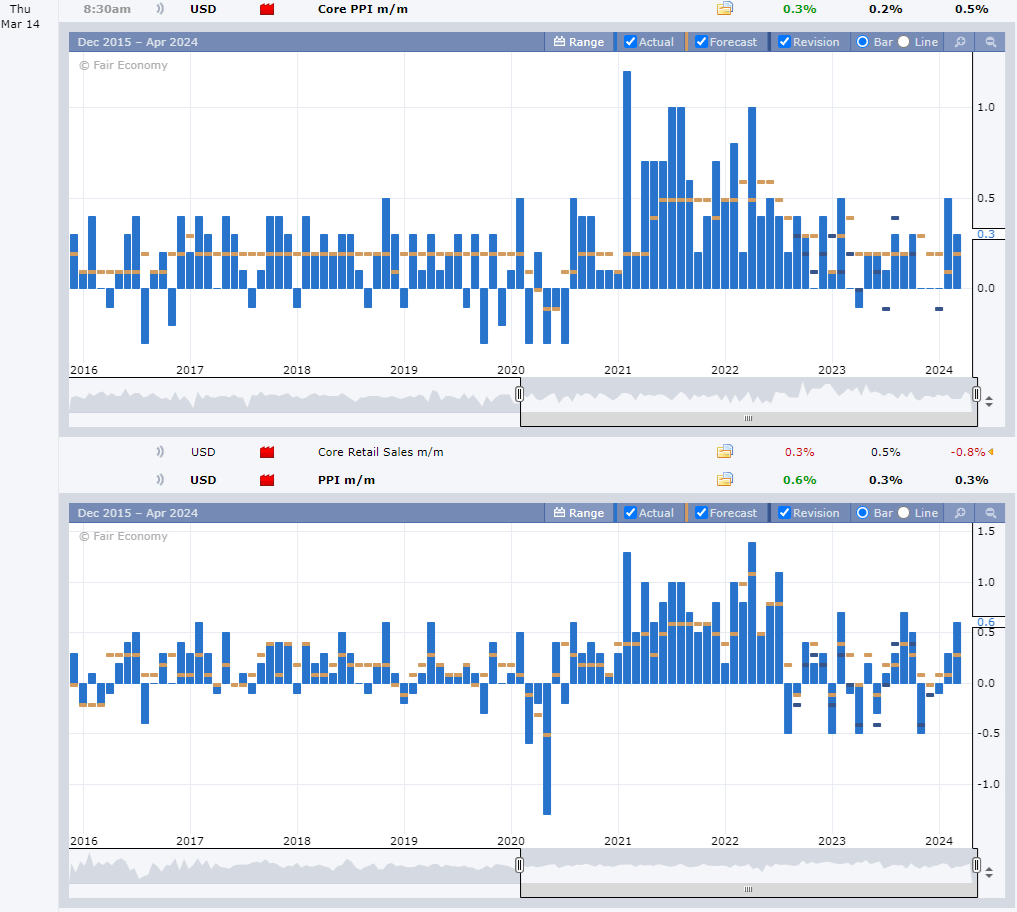
Producer Price Inflation (PPI) also exceeded expectations but is on a general downtrend. Notably, several recent months have seen downward revisions.
The labor market presents mixed signals:
Favorable Indicators:
Job openings remain above pre-COVID highs.
The number of employed individuals is at a record high.
Unemployment, permanent job losses, and ongoing claims are relatively low.
Unfavorable Indicators:
Labor force participation has declined from its August 2023 peak.
The quit rate has dropped below pre-COVID highs, suggesting normalization. However, a sharp decrease would be a concerning sign for the long-term outlook.
Earnings
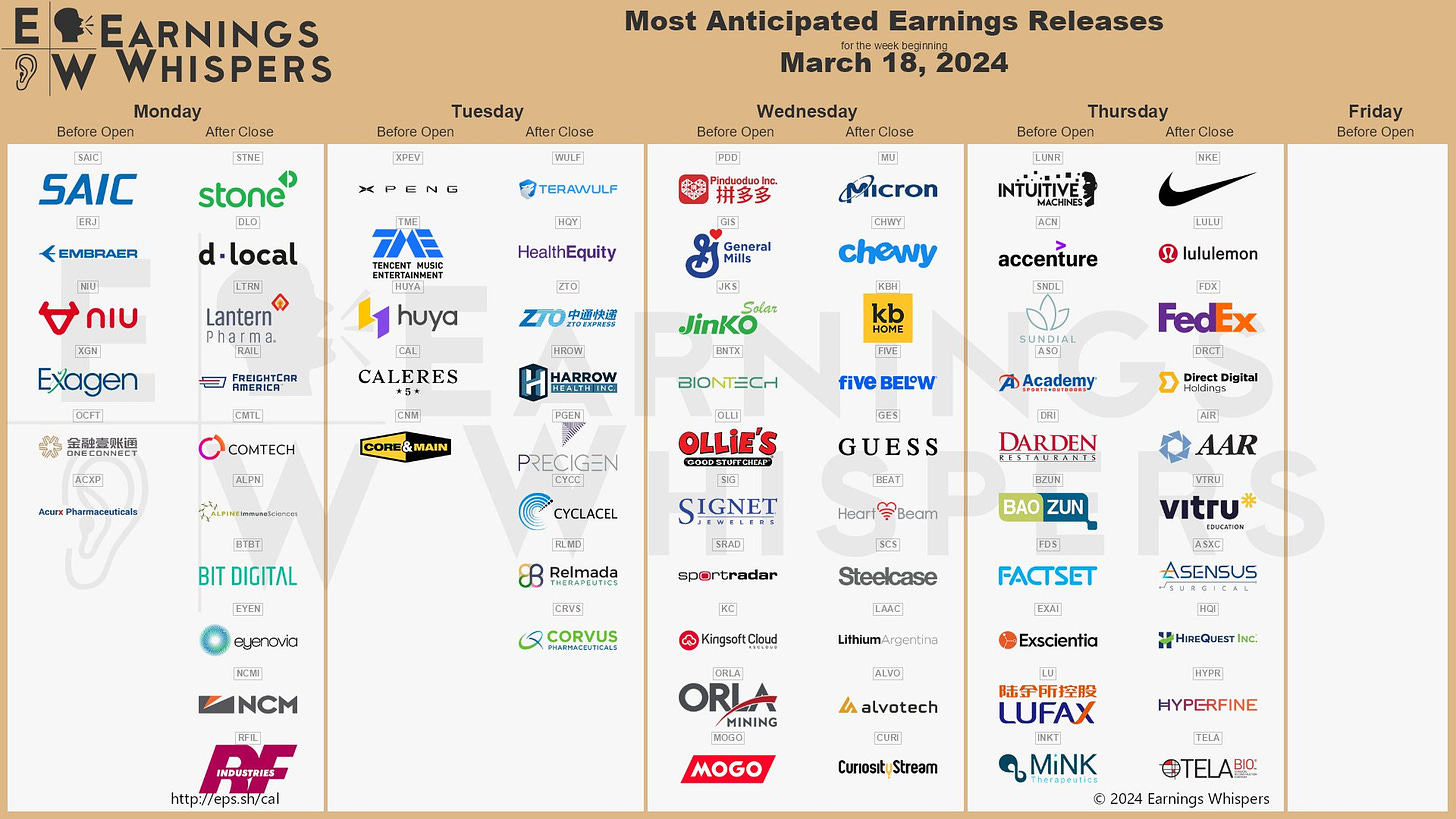
The upcoming week is lighter on major earnings reports, but there are a few to watch:
JNK and CHWY are frequently featured in trade setups and are worth monitoring.
GIS, amidst a prolonged downtrend, could see a shift with strong earnings potentially easing some overhead resistance.
ACN's report should offer further insights into their involvement in AI adoption.
ASO is evolving into a more substantial core position. Their unique performance in consumer sporting retail stands out, especially as LULU and NKE report on the same day.
FDX is often scrutinized for economic indicators. While they sometimes attribute underperformance to economic conditions, their results are still significant.
Market Risk and Seasonality
Trend
First things first, we are in a strong uptrend. And when it comes to uptrends, we listen to Charles Dow.
“The observed trend should be assumed to continue until the weight of the evidence has shifted in favor of a reversal."
-Charles Dow
Until we see evidence of a reversal, we will assume continuation.
Seasonality
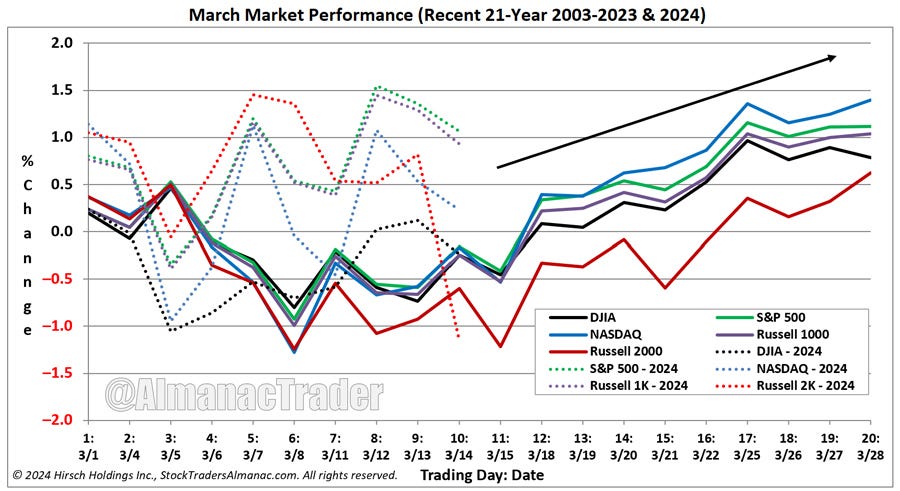
Seasonality would call for 3/15/23 to be a local low, followed by a rally. This is the Ides of March and a triple witching date in which derivatives tied to stocks, index options, and futures mature. $5.3T in options are set to expire. Triple witching is consistently volatile, but not directional.
Jeff Hirsch of the Stock Traders Almanac notes that the Ides of March may not be followed by a rally since we did not experience the typical weakness in late February and early March.
Risk
5% Rule
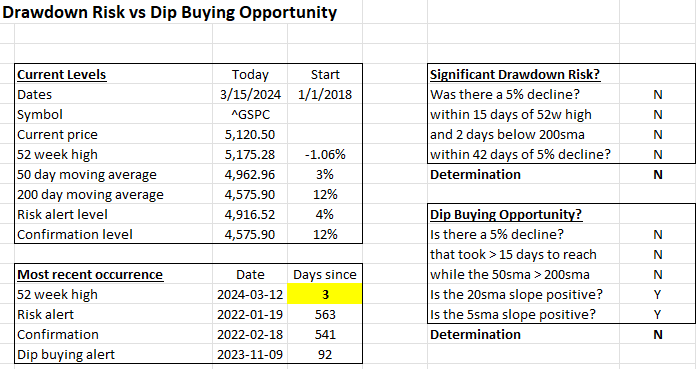
We saw a new all time high on 3/15. I mention this a lot, but I follow Andrew Thrashers guideline on identifying risk of a drawdown.
Alert would be signaled if the S&P closes below 4916.50 by 4/2.
Confirmation will be 2 closes below ~4575 by ~6/2
Dow theory
Dow Theory is a fundamental concept in technical analysis, developed by Charles Dow. Dow founded The Wall Street Journal and co-founded of Dow Jones & Company. The core concepts are:
Markets price based on all available information
The market has primary trend, secondary trend, and daily fluctuations
Primary trends have accumulation, public participation, and distribution phases
Indices confirm each other
Volume confirms trend
Trend is assumed to continue until there are definite reversal signals
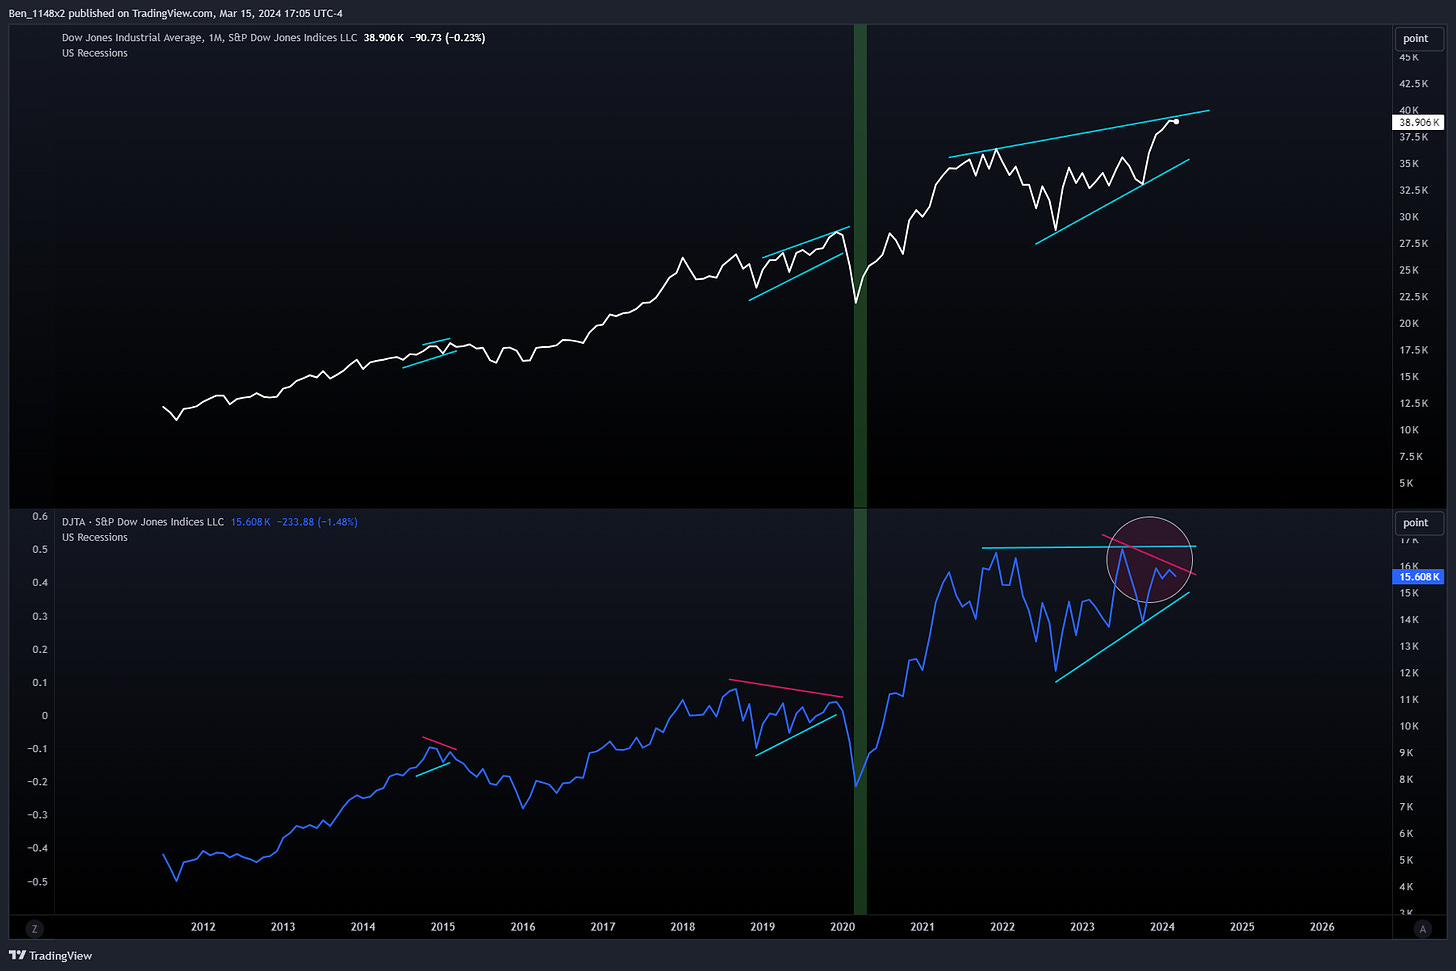
This chart looks at the DIJA Dow Jones industrial average and the DJTA Dow Jones transportation average. Dow theory states that these indices with confirm each other to continue higher. DJTA is currently signaling a warning. We need to see it climb.
Sequential Market Movement
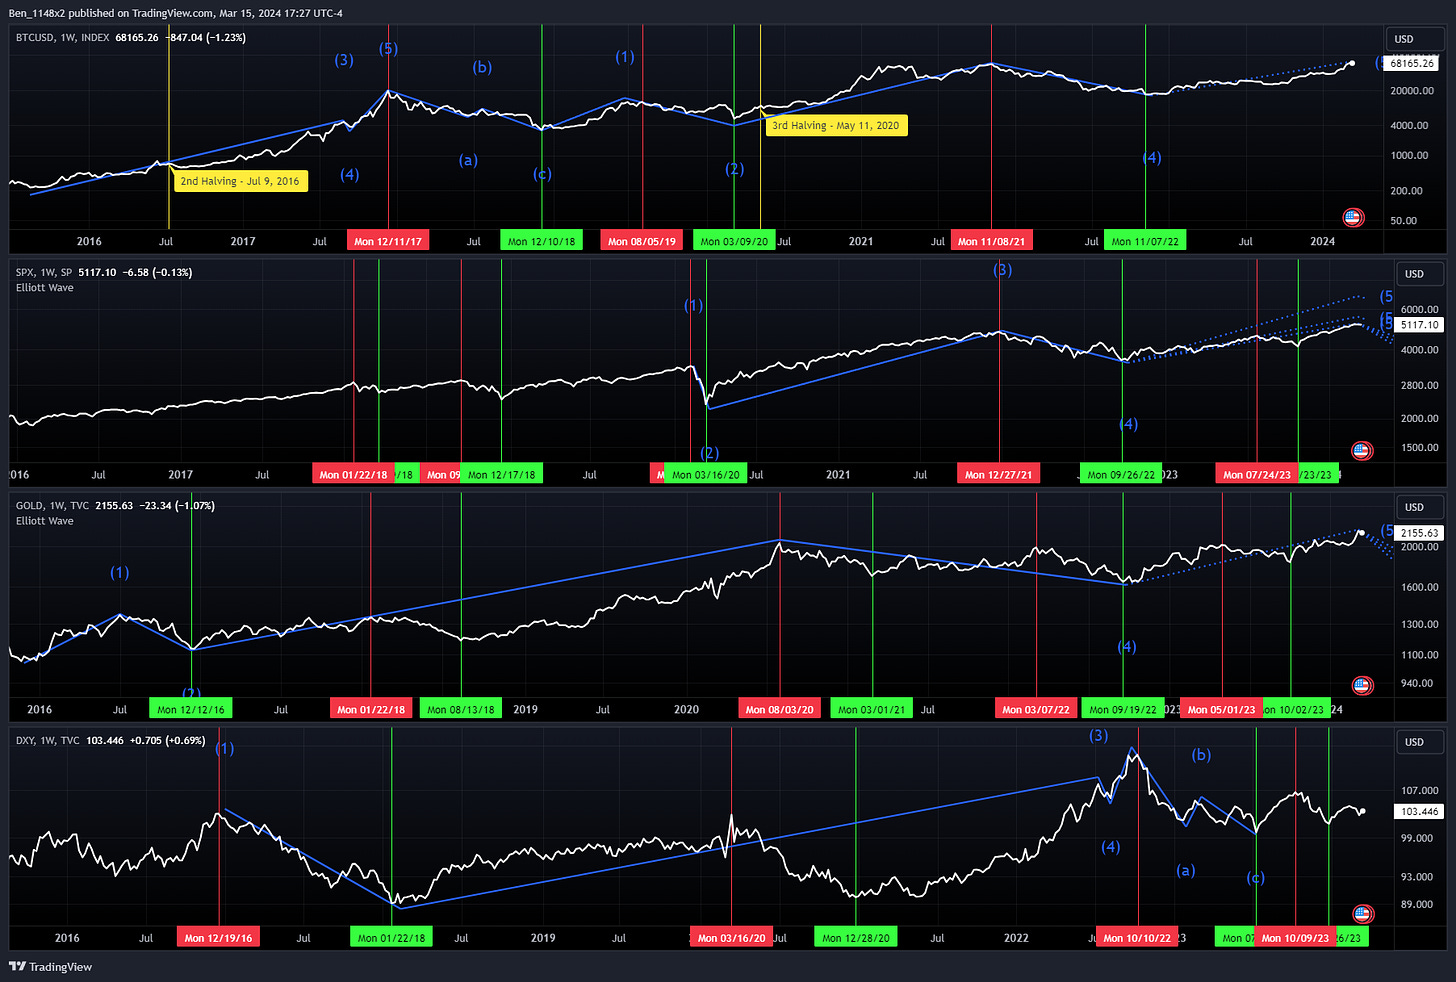
We can observe a rotation of funds from most to least speculative areas of broader markets. BTC’s most recent trough was 11/22, S&P 10/23, gold 10/23, and US dollar index 12/23. In prior downturns we see BTC top prior to the S&P. Gold tops after the S&P in most cases, and the US dollar index tops last.
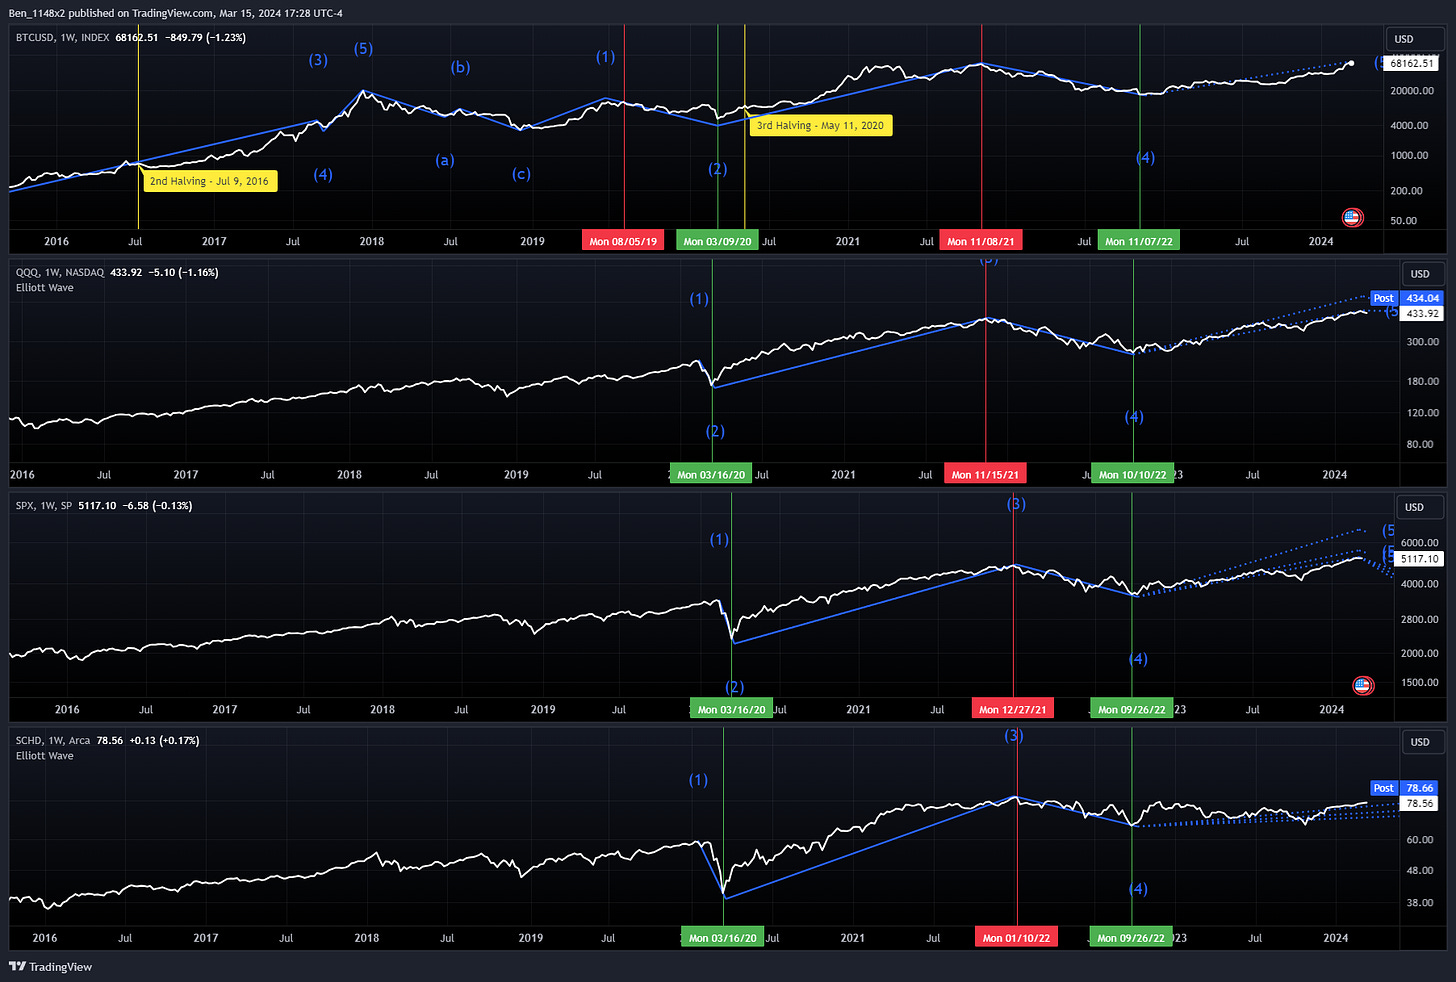
A similar view comparing BTC to equity indexes QQQ, SPX, and ETF SCHD shows that when the market goes into a downturn these spaces will move in a tighter sequence, topping in the order of BTC, QQQ, SPX, SCHD. Bottoming in the order of SPX and SCHD, QQQ, and then BTC.
Charts
Gold
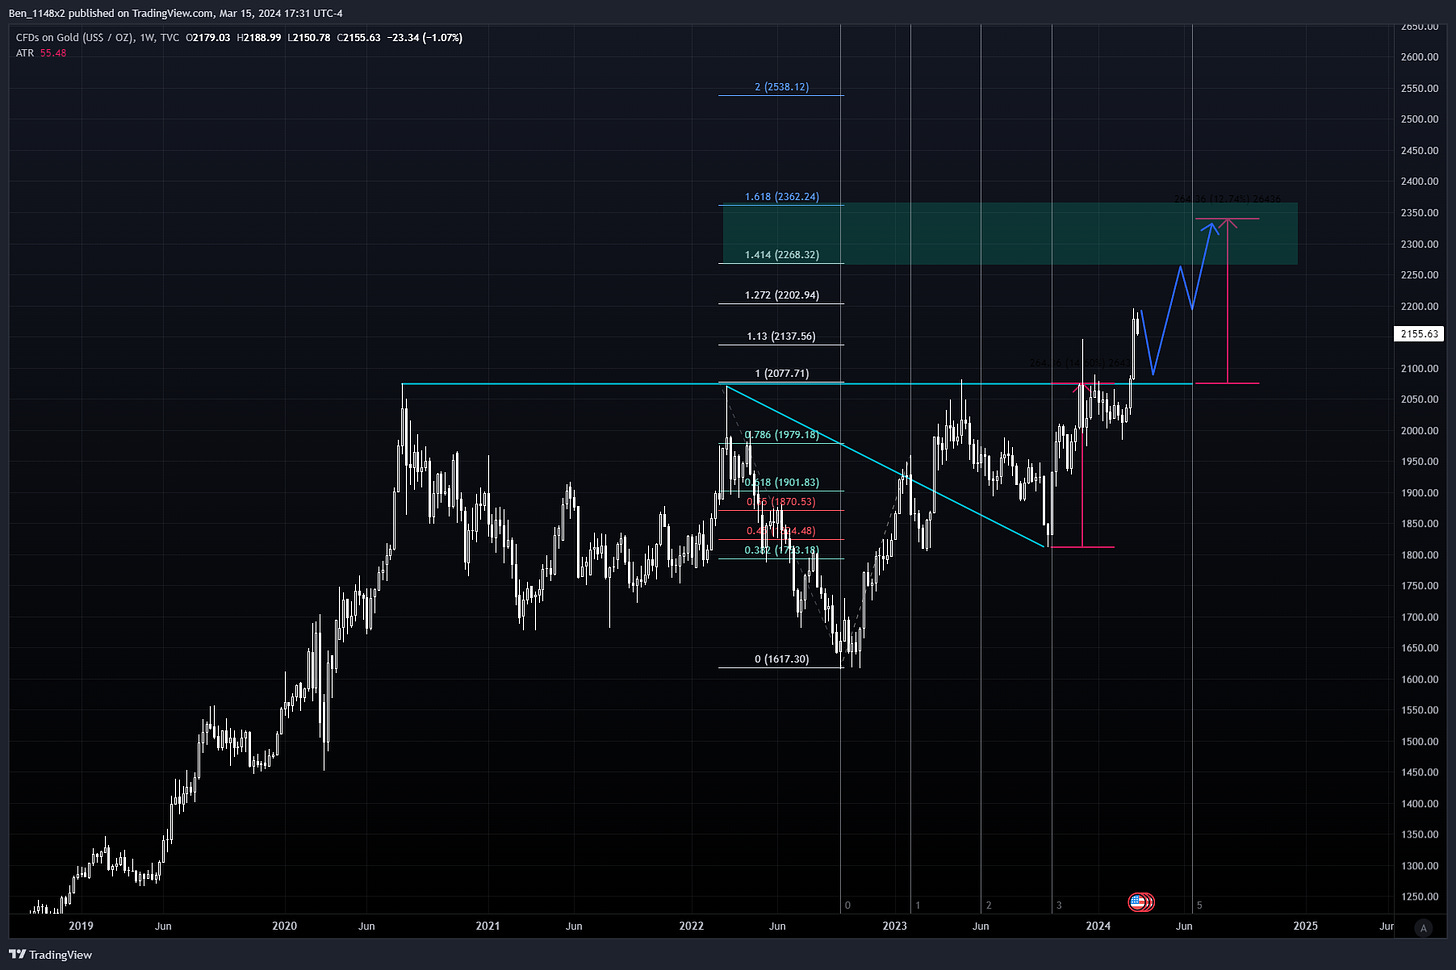
Gold is not a part of my portfolio. This is an impressive break out to a new high. I would expect the move to top between 2270-2360 by summer.
Energy
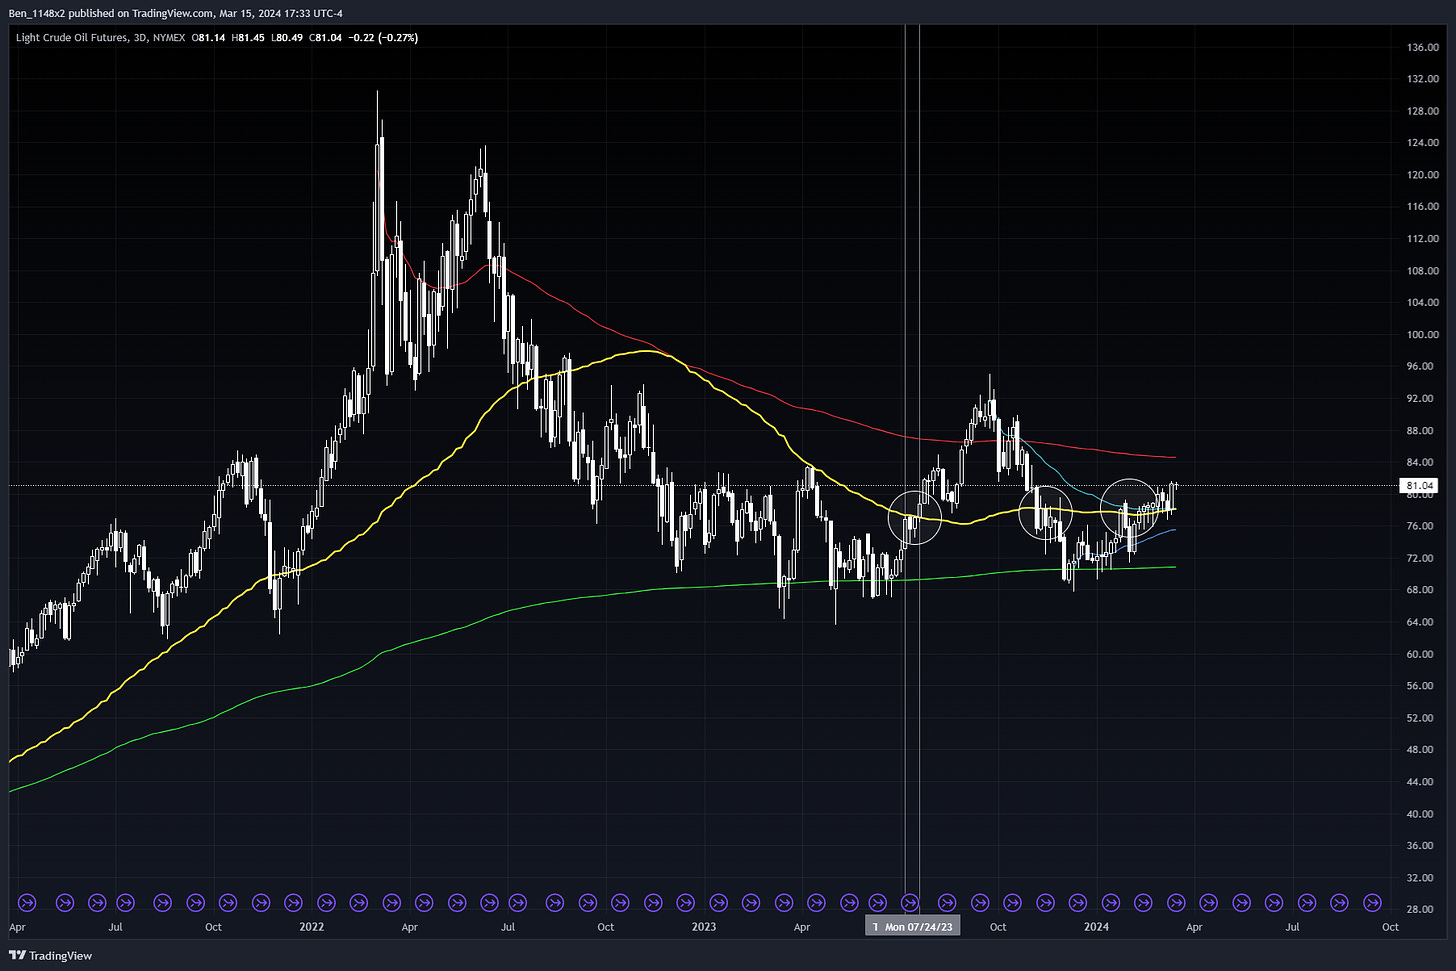
I posted this in February and the oil is following the scenario nicely.
https://www.tradingview.com/chart/WTI/4UqBfXdR-Energy-and-Justin-Mamis-Sentiment-Cycle/
I’d expect to see resistance at ~84/barrel. I'll take profits on my positions in MPC and COP when we hit 84.
Gold and Oil
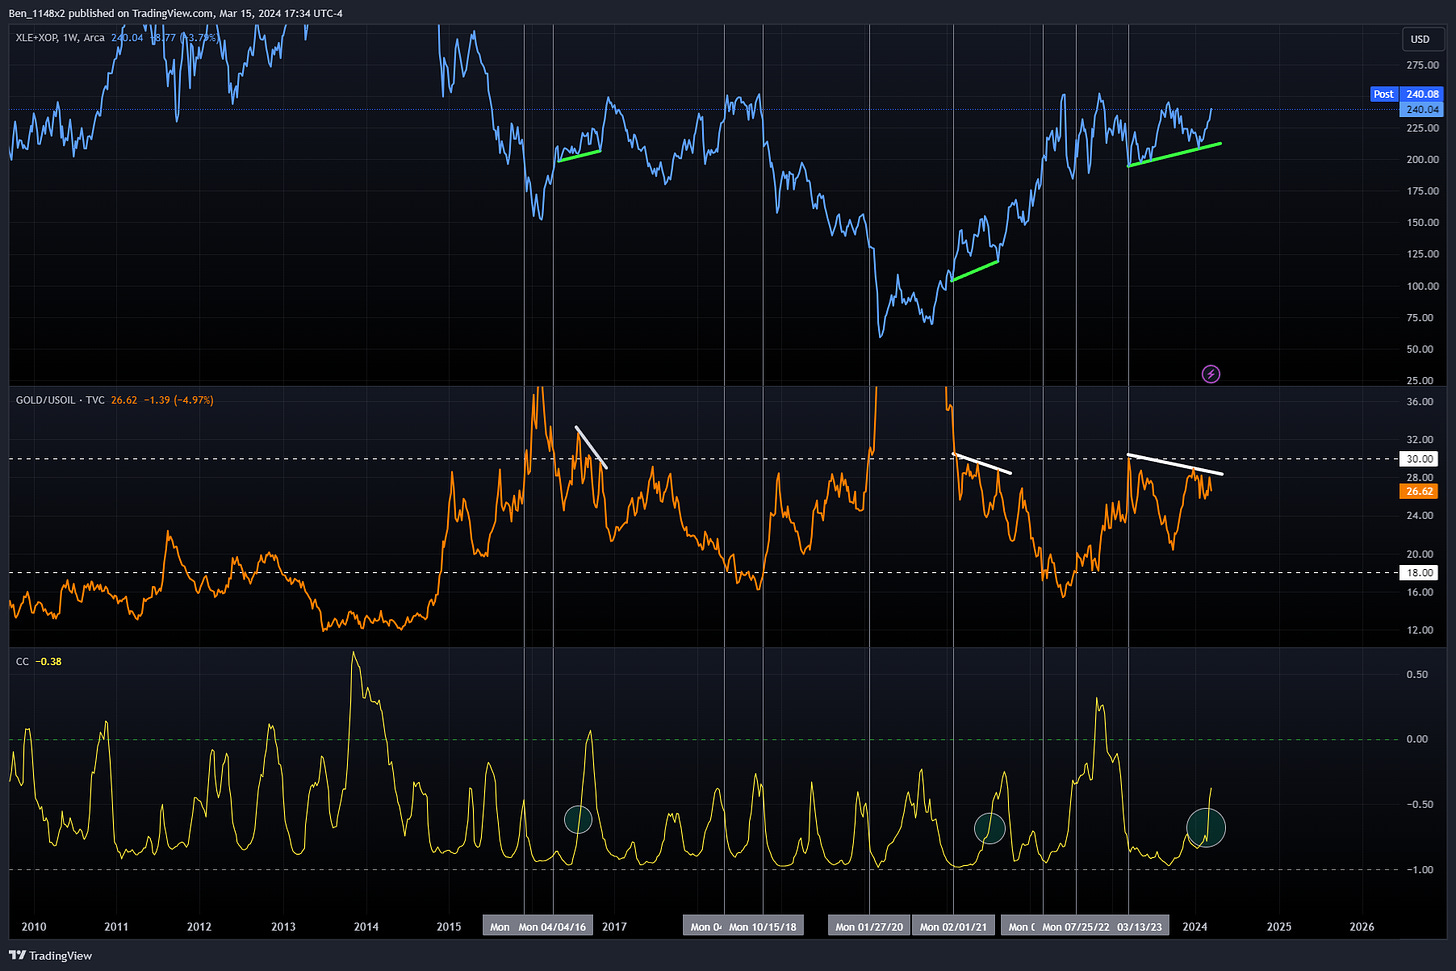
The relationship between gold and oil helps to time peaks and troughs in energy. In theory, the economy has greater demand for oil when expanding (risk on), and greater demand for gold as a store of value (risk off). Thus, XLE + XOP (energy plus energy exploration) has an inverse relationship to gold divided by oil. We want to pay attention to gold/oil ratio when it is ~30 and when it is ~18 for signs of bottom and top of the energy market. We also want to pay attention to when they are and aren't correlated with one another.
Despite gold rising, the relationship is signaling that energy has more room to run.
MPC
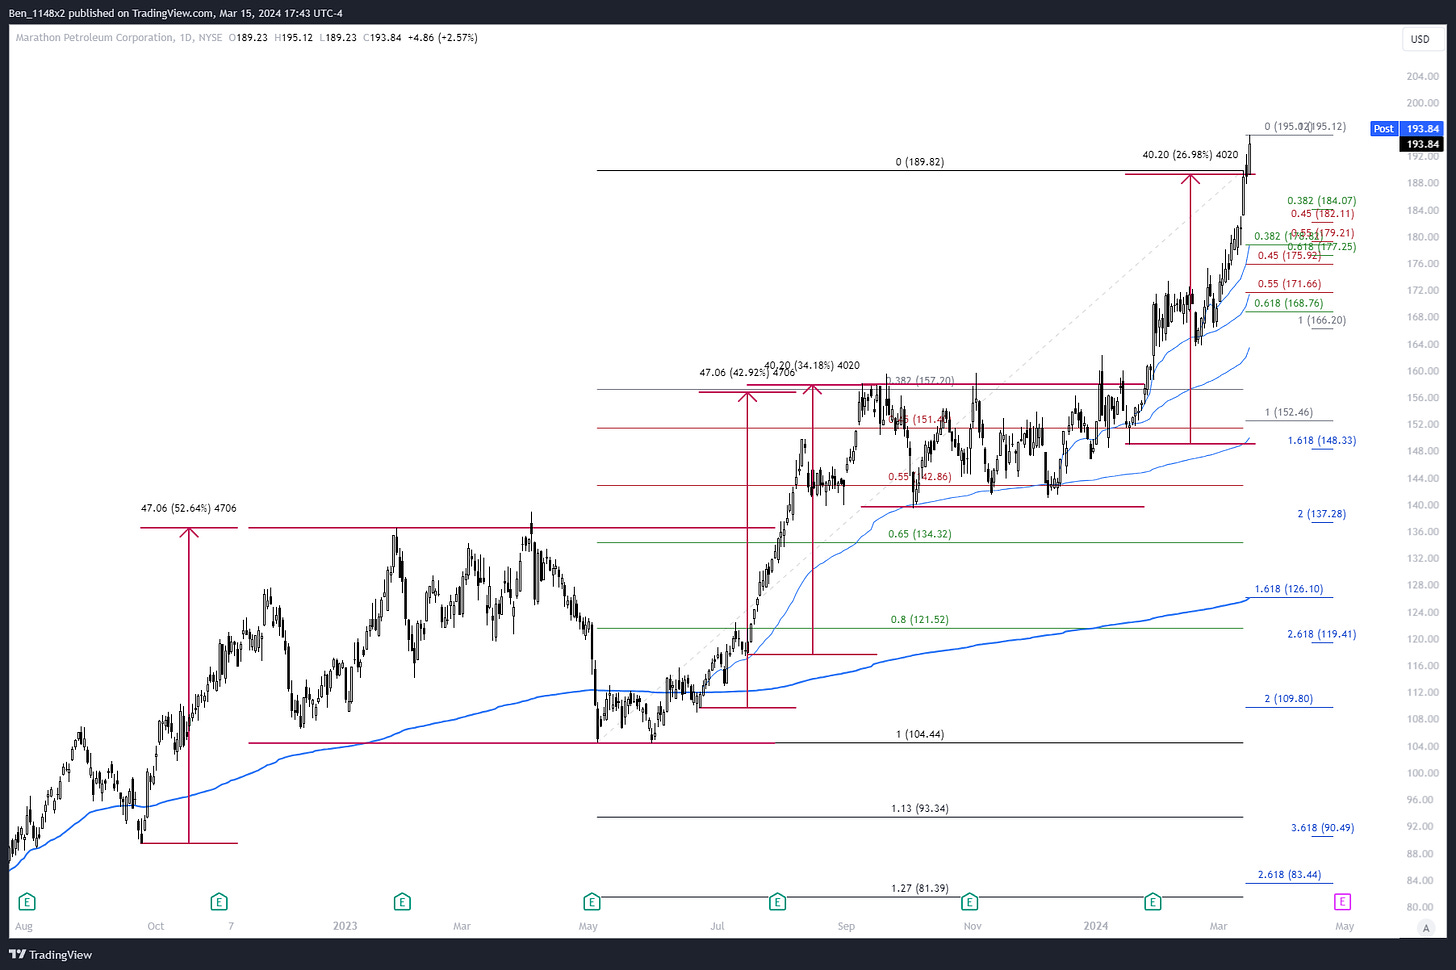
MPC has reached my full forecast. This is a great company, but I plan to take profits and capitalize on future consolidation.
COP
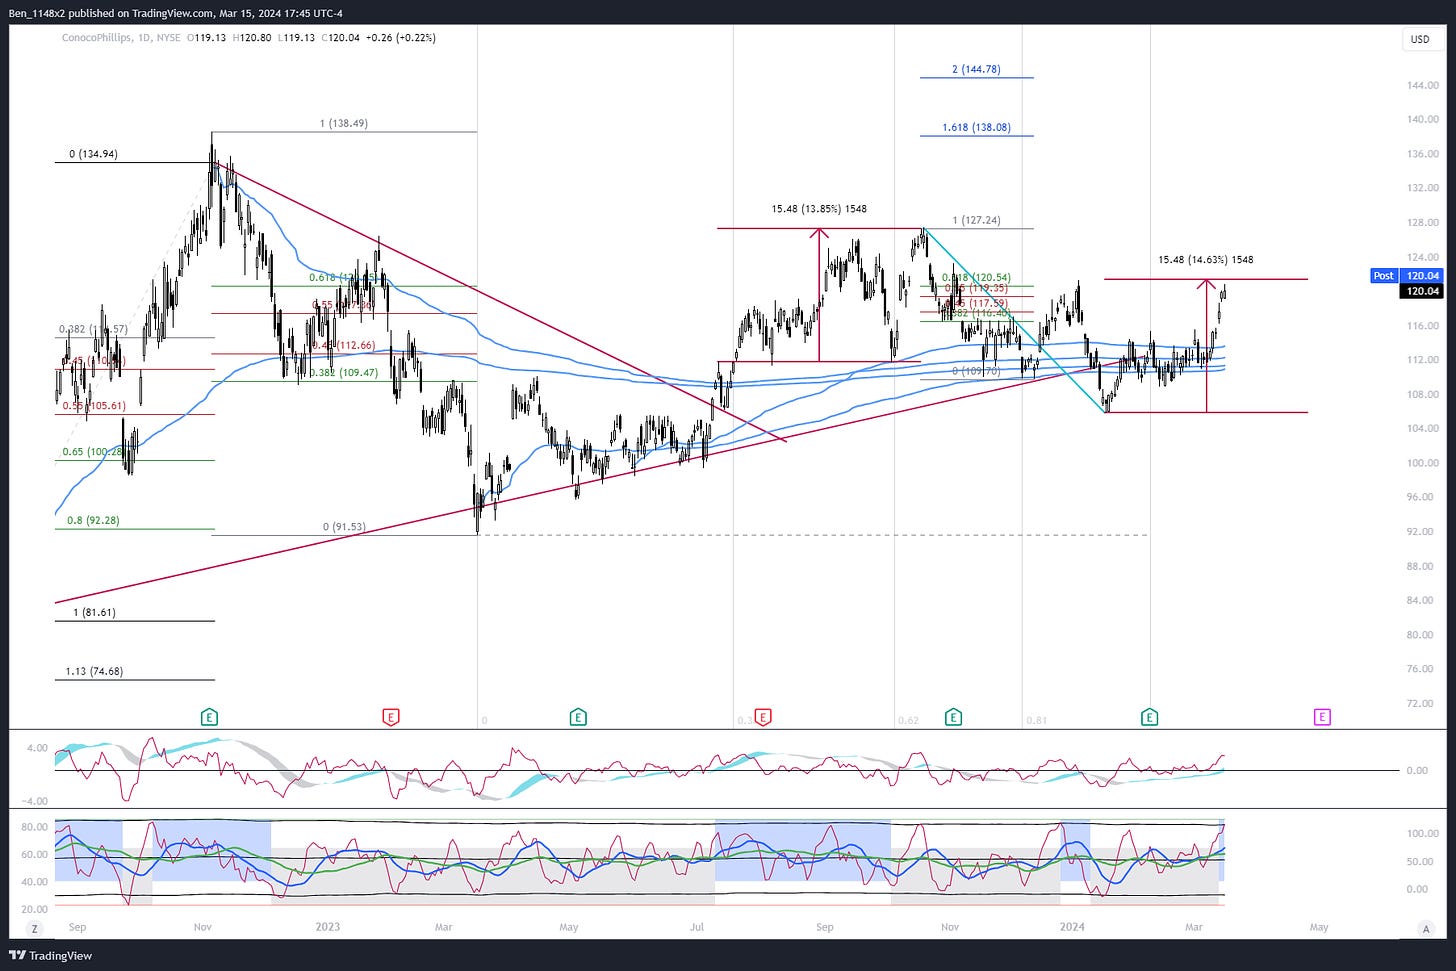
COP is also nearing my sell target. I’ll take profits at 121, 127, and 138.
OXY
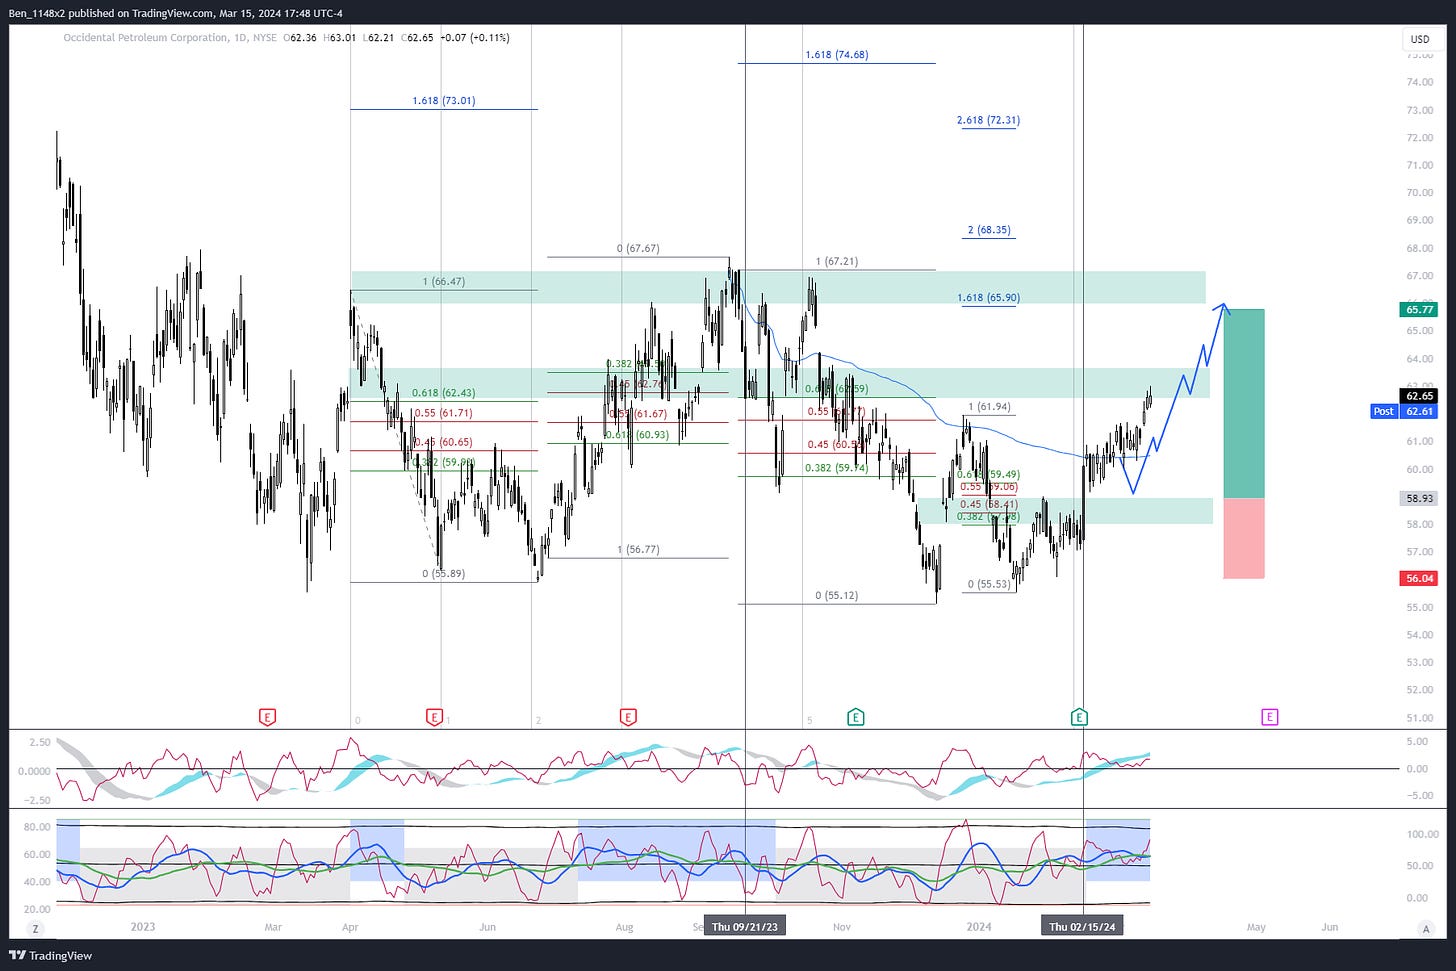
I drew this scenario at the beginning of the month. We never retested 59 so I did not take a position. My next opportunity would be a break above 63.65 with a retest of 62.60.
CVX
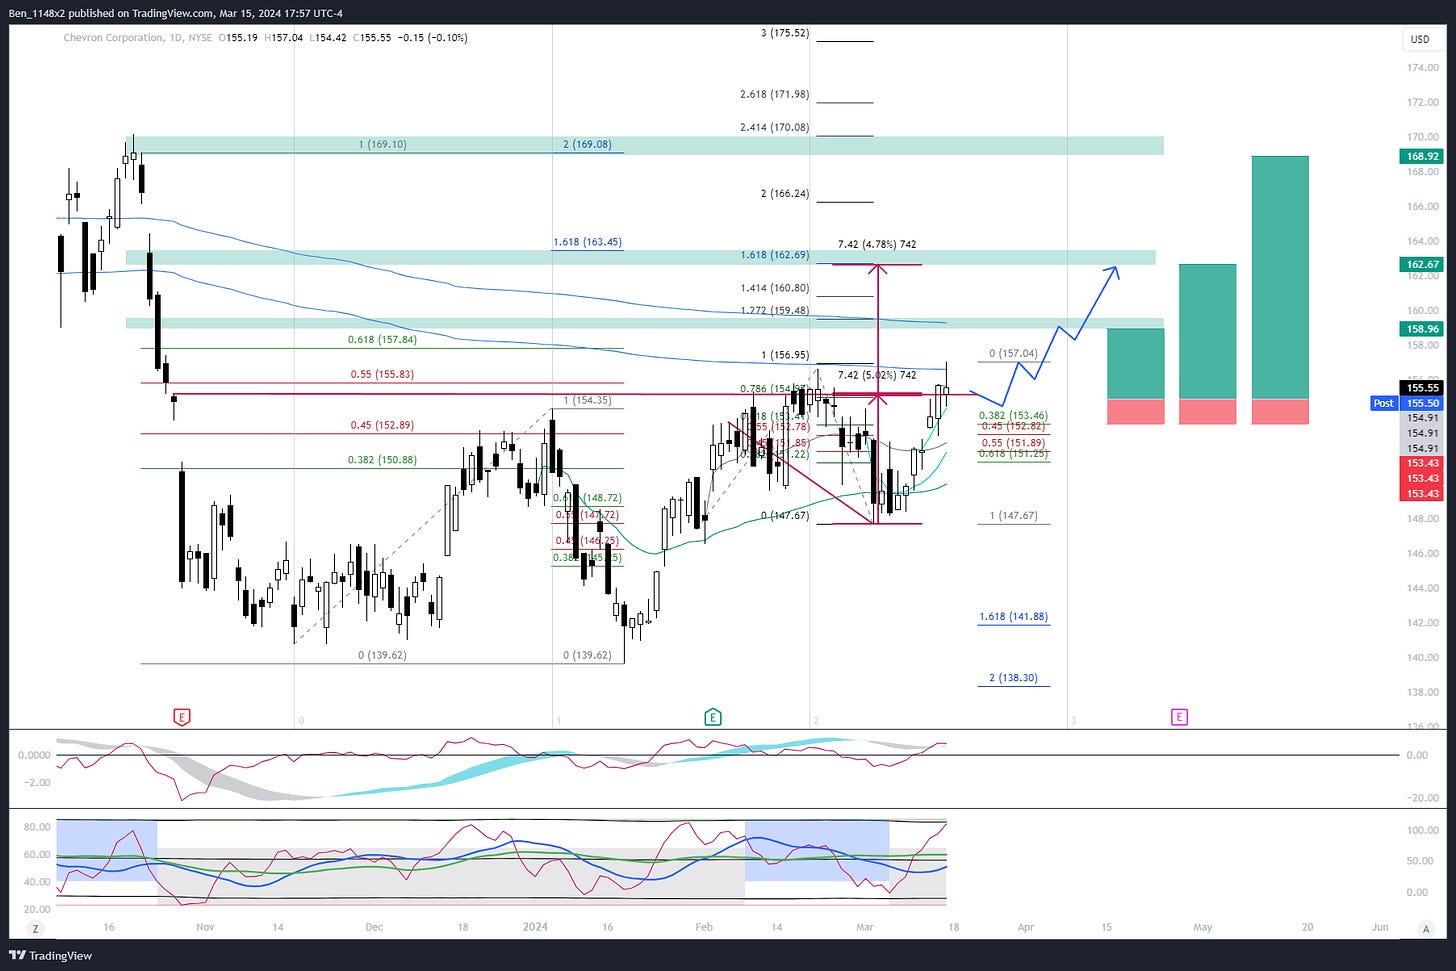
This is probably a little busy, but I like to show multiple methods coming into confluence with one another. CVX momentum is just starting. We can see that price met resistance at the first thin blue AVWAP from prior highs. The next aligns to ~159.
I’m planning to take a position here, with profit taking at 159, 163, and 168. Note that 12 month consensus price target is 177.
GIS
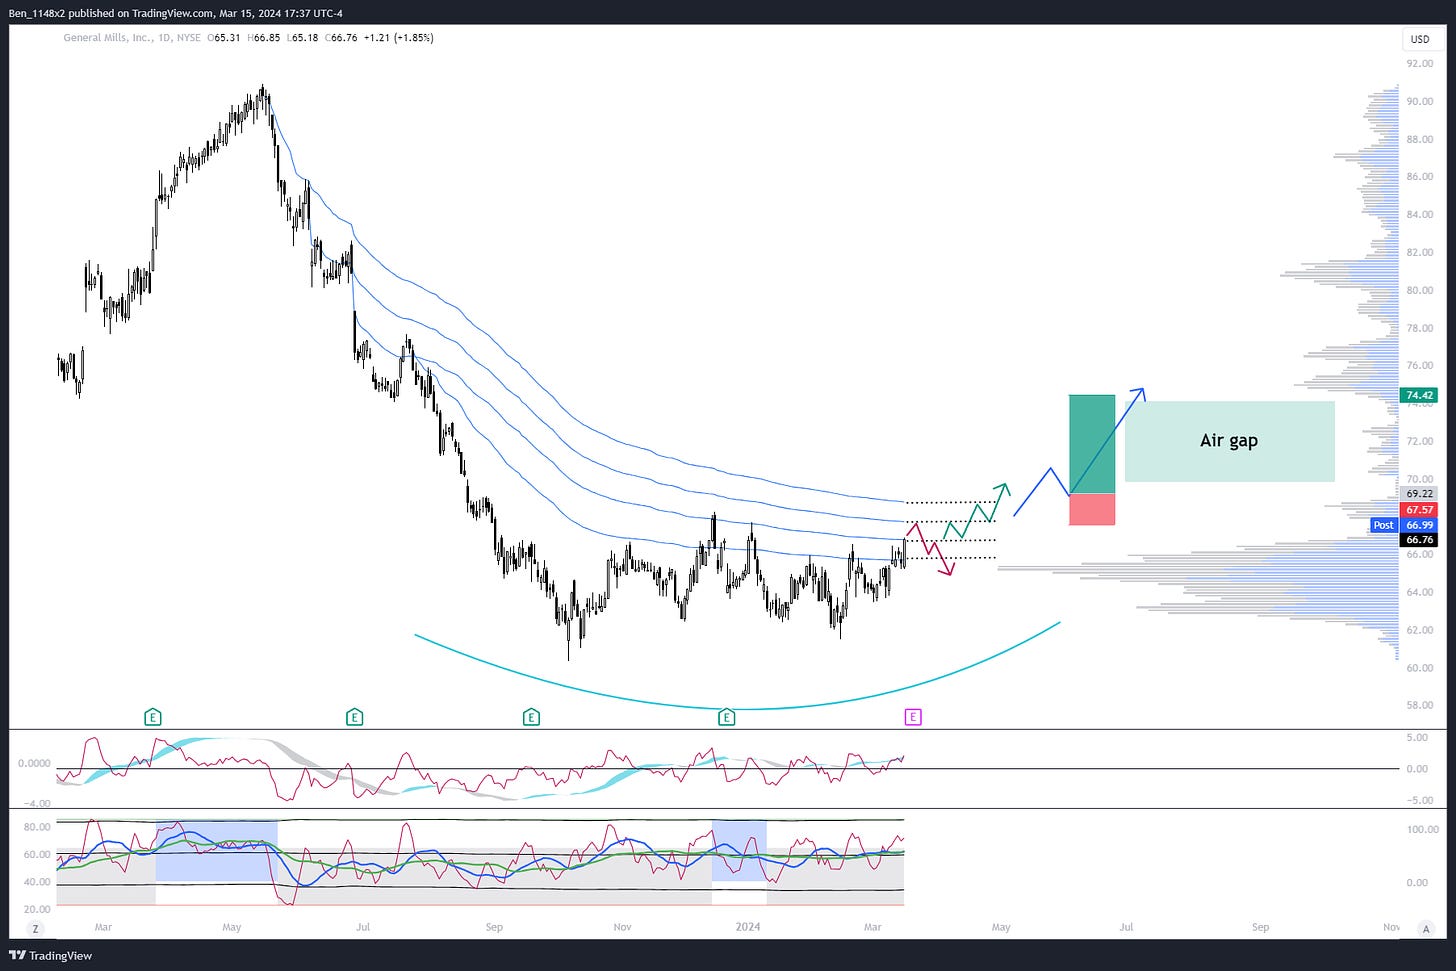
I don't like the risk reward ratio for an entry here. If we see continuation from GIS it will likely hit resistance at each of the volume weighted average prices from prior highs (following the green arrow). These recoveries look encouraging but often fail in what's called a suckers rally. Multiple rejections during recovery are also very likely (red arrow), retesting the lower base.
I would only consider an entry for GIS in the scenario with the blue arrow. A break above and retest of ~68.90. This should have a smooth run to ~74.50 as there is a large air gap with very little buying/selling history. This setup would offer a 3:1 risk reward. I like these as opportunities to use a short term trade to add a very low cost boring dividend payer.
ASO
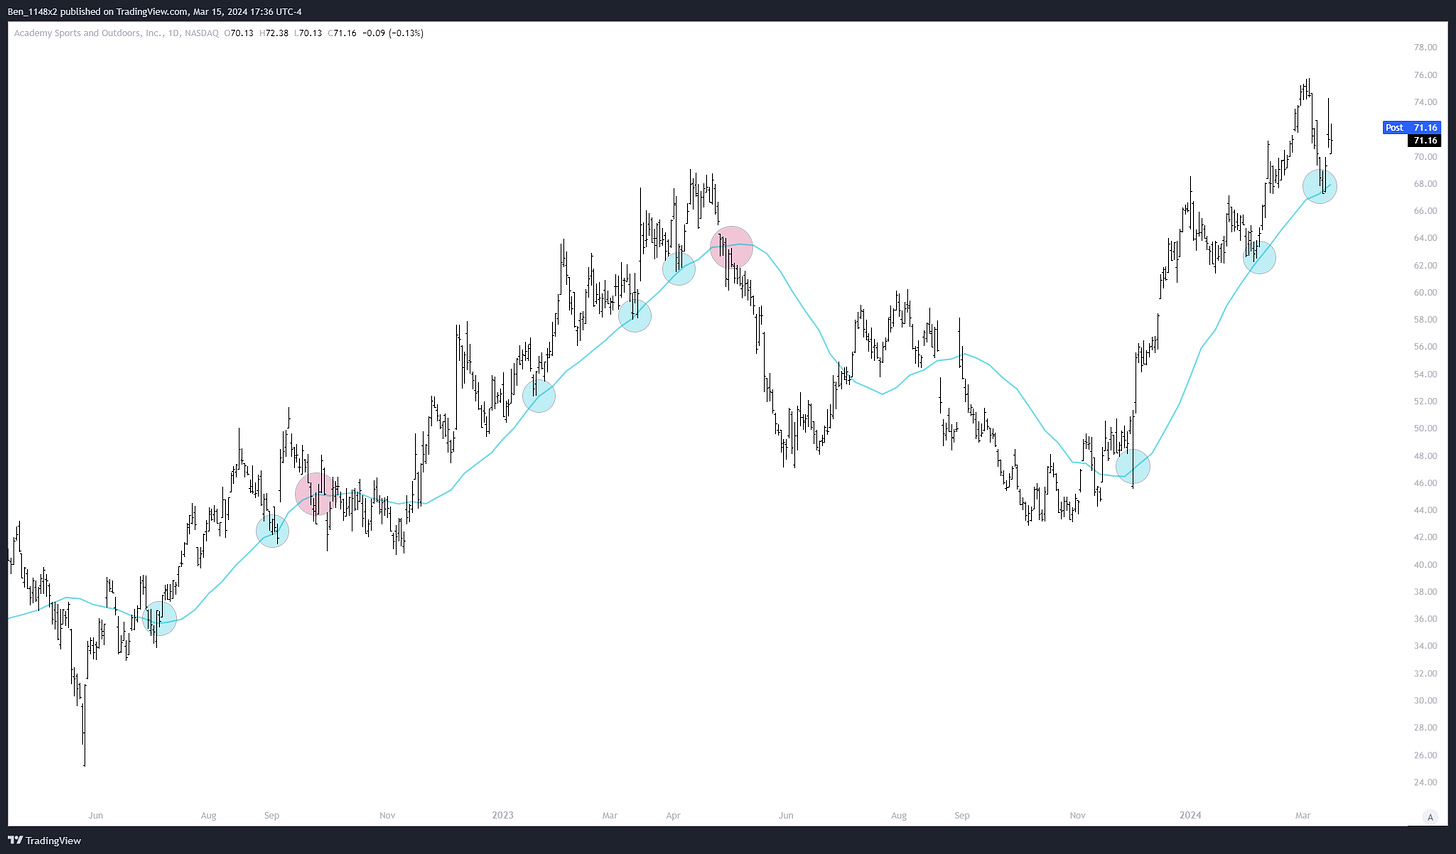
Recently tested its 10 week SMA and this area produced results again!
“We always add on the first 10 week SMA retest after a breakout”
-Bill O’Neill
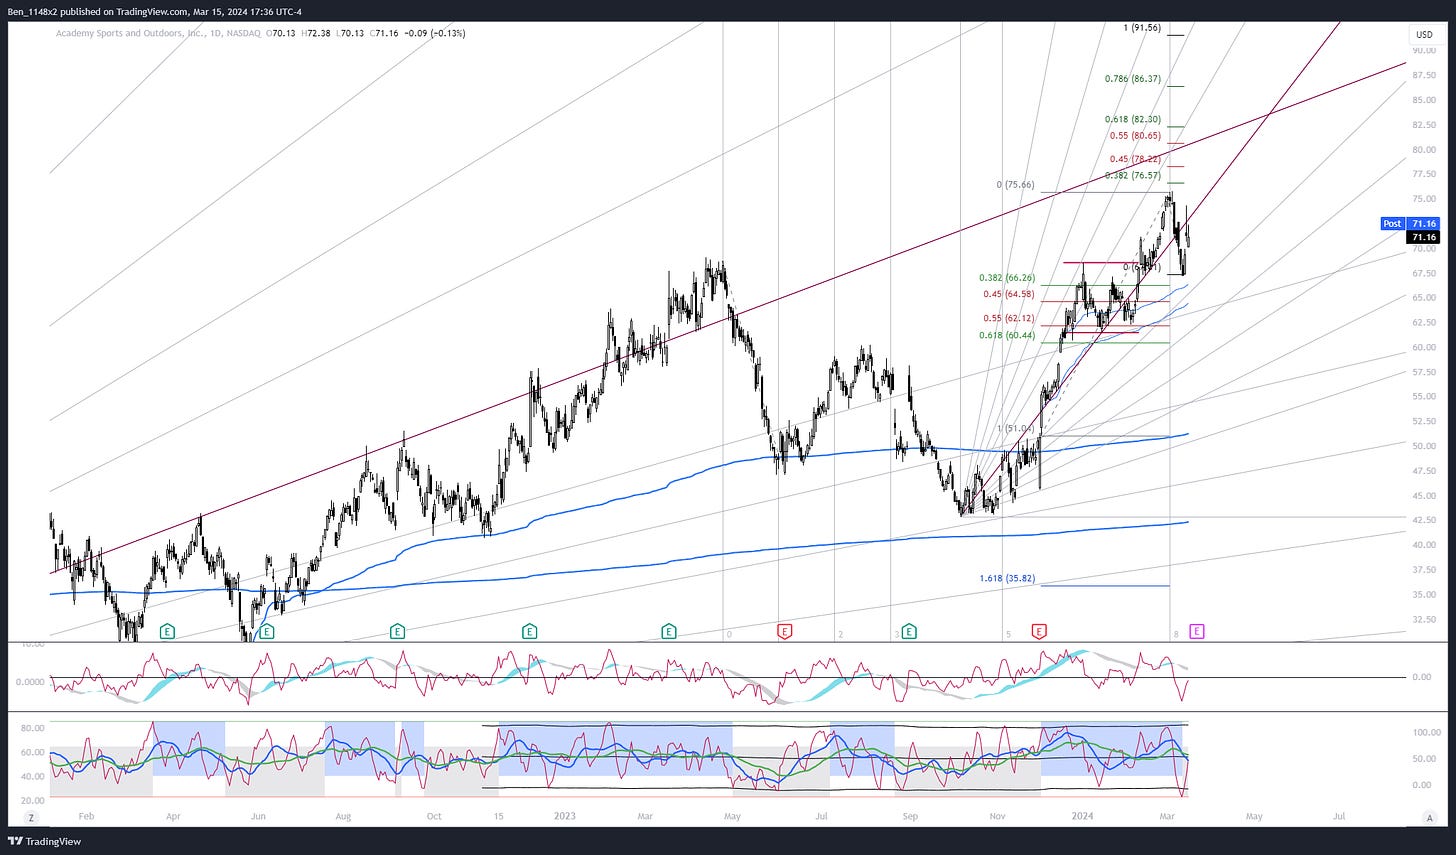
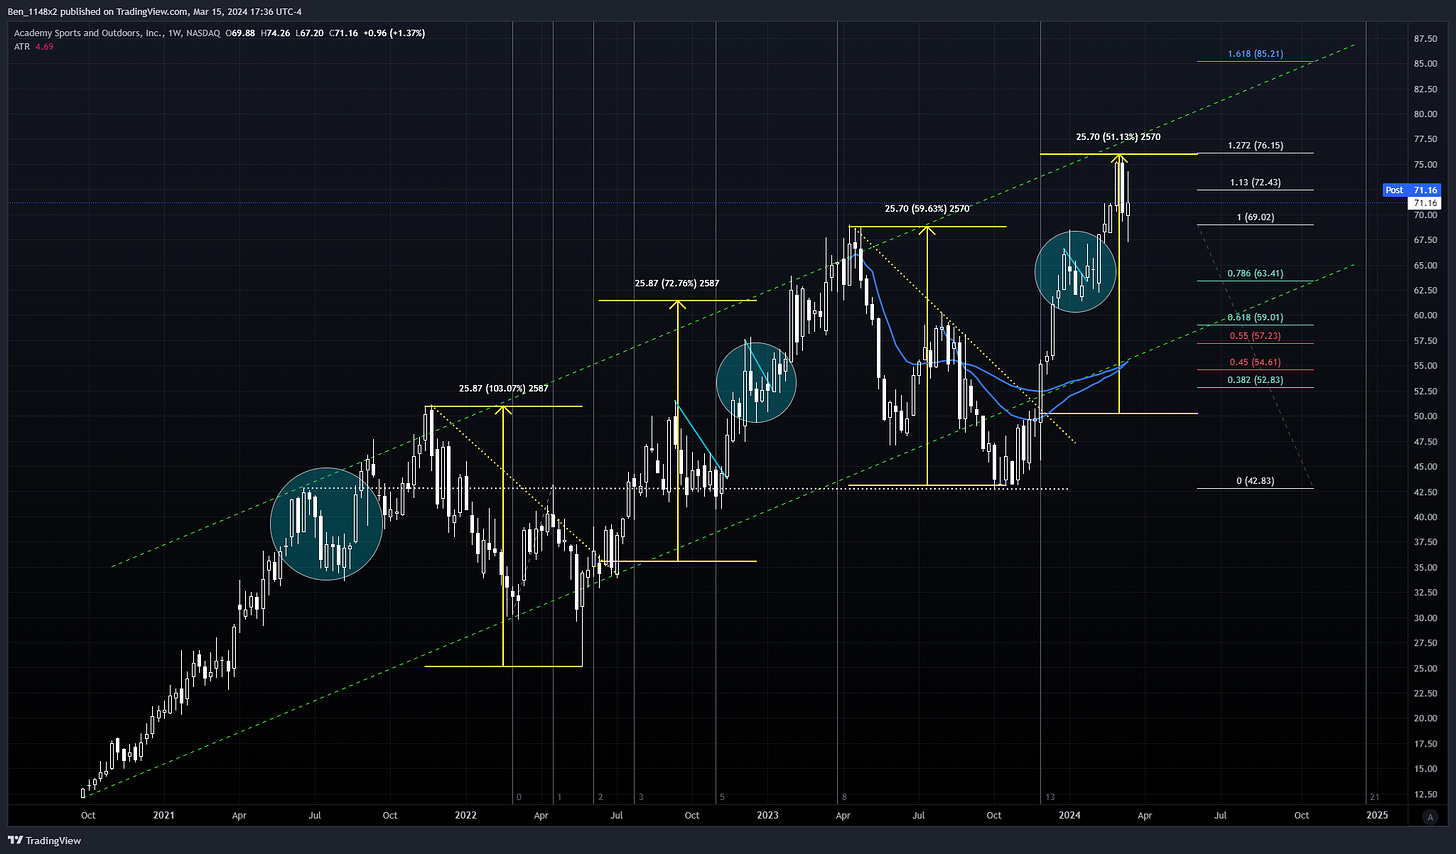
A strong earnings is likely to push to a new high, followed by consolidation into the 3rd quarter. I'm taking profit, given that at the top of my near term forecast, and with so much of the consumer discretionary sector down.



I really like your work…thx!