


Navigating Volatility: Setups, Setbacks, and Seasonal Shifts
SPX Gold BTC DASH PLTR BE MO SXY UUP JOBY NVO LLY EL LIT ETHA WTAI EL ETHA LIT

Introduction
I’ve been giving more time in between updates and am working from higher time frame charts. This is a tricky time of the year as July is normally a strong month, followed by the three worst consecutive months of the year.
We have a couple of alerts that preceded Friday’s move down. If conditions worsen I’ll schedule a call for us to look at trends and chart requests together.
Macroeconomic Updates
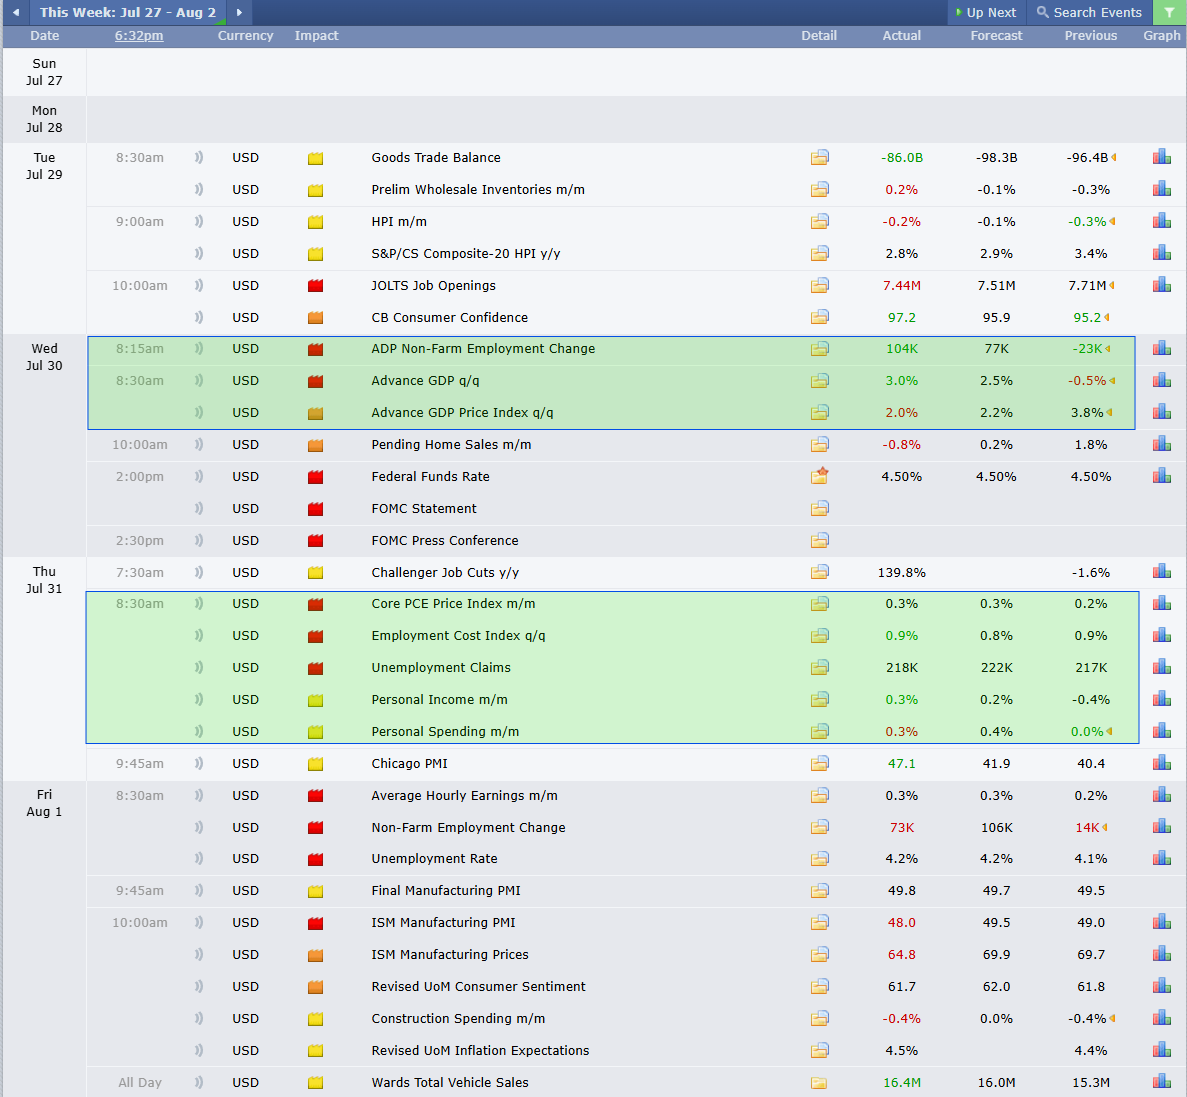
This was a busy week for macroeconomic data and news. Labor , GDP, income, and spending were all relatively favorable and in line.
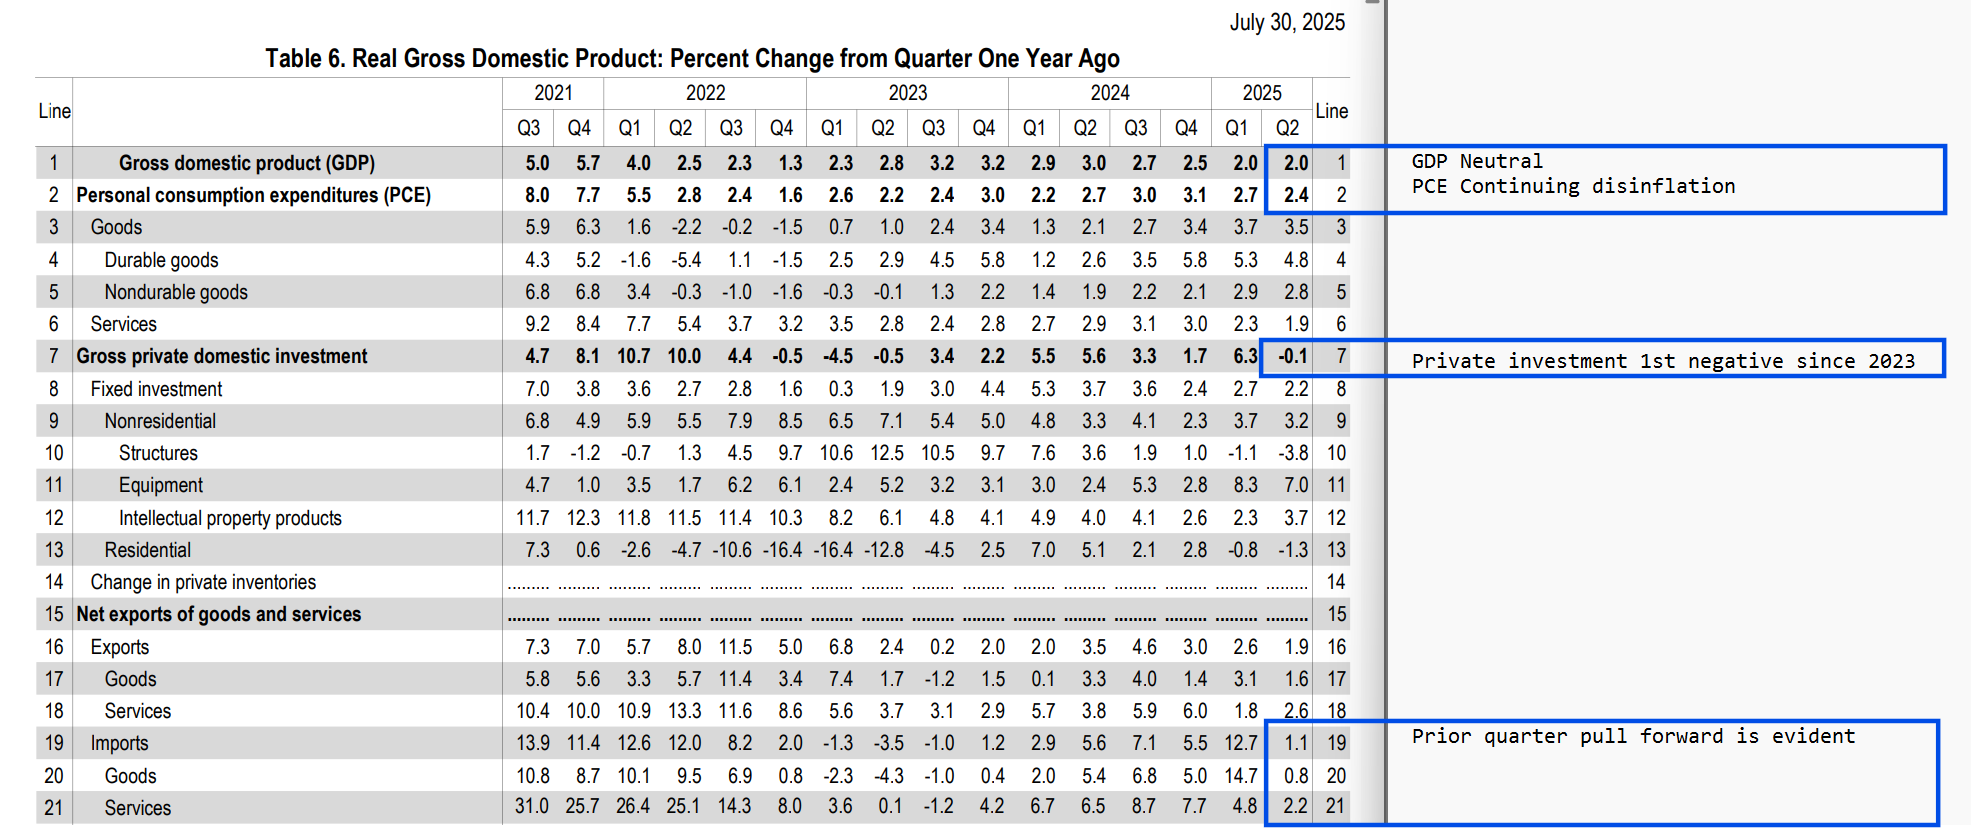
Recall that my personal preference is to look at current quarter versus same quarter from the prior year, as opposed to the popular quarter over previous quarter view. This is a more reliable view of economic momentum, in my opinion. GDP is positive but slowing. PCE inflation continues to come closer to the the FOMC’s target.
The inventory pull forward that we saw in response to tariffs can be seen in imports. Look for concerns about depletion of this inventory to make their way into the news over the next couple of months.
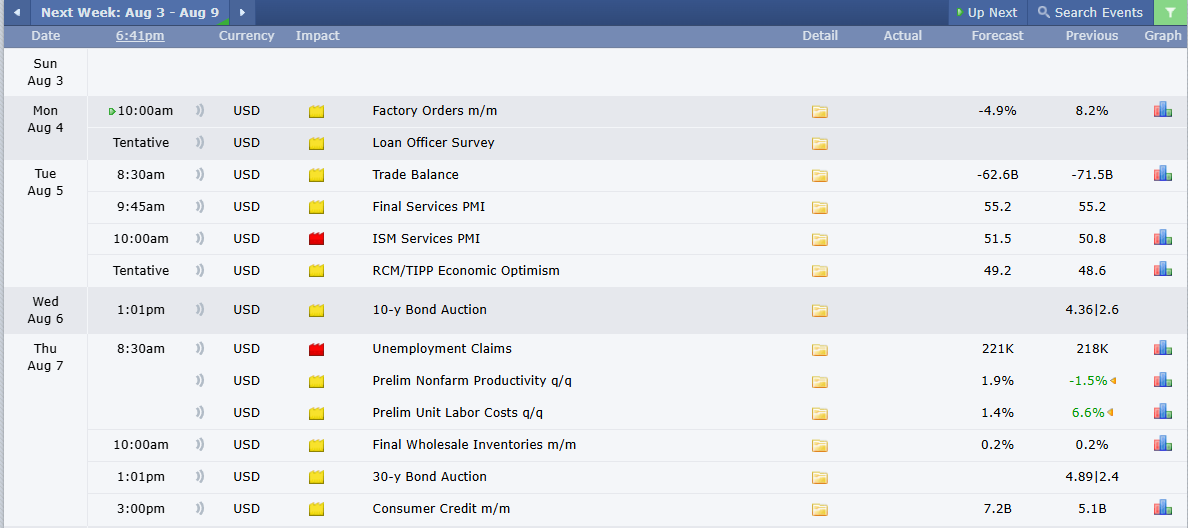
Next week is a bit lighter on economic data. We will have updates to PMI, unemployment claims, and consumer credit.
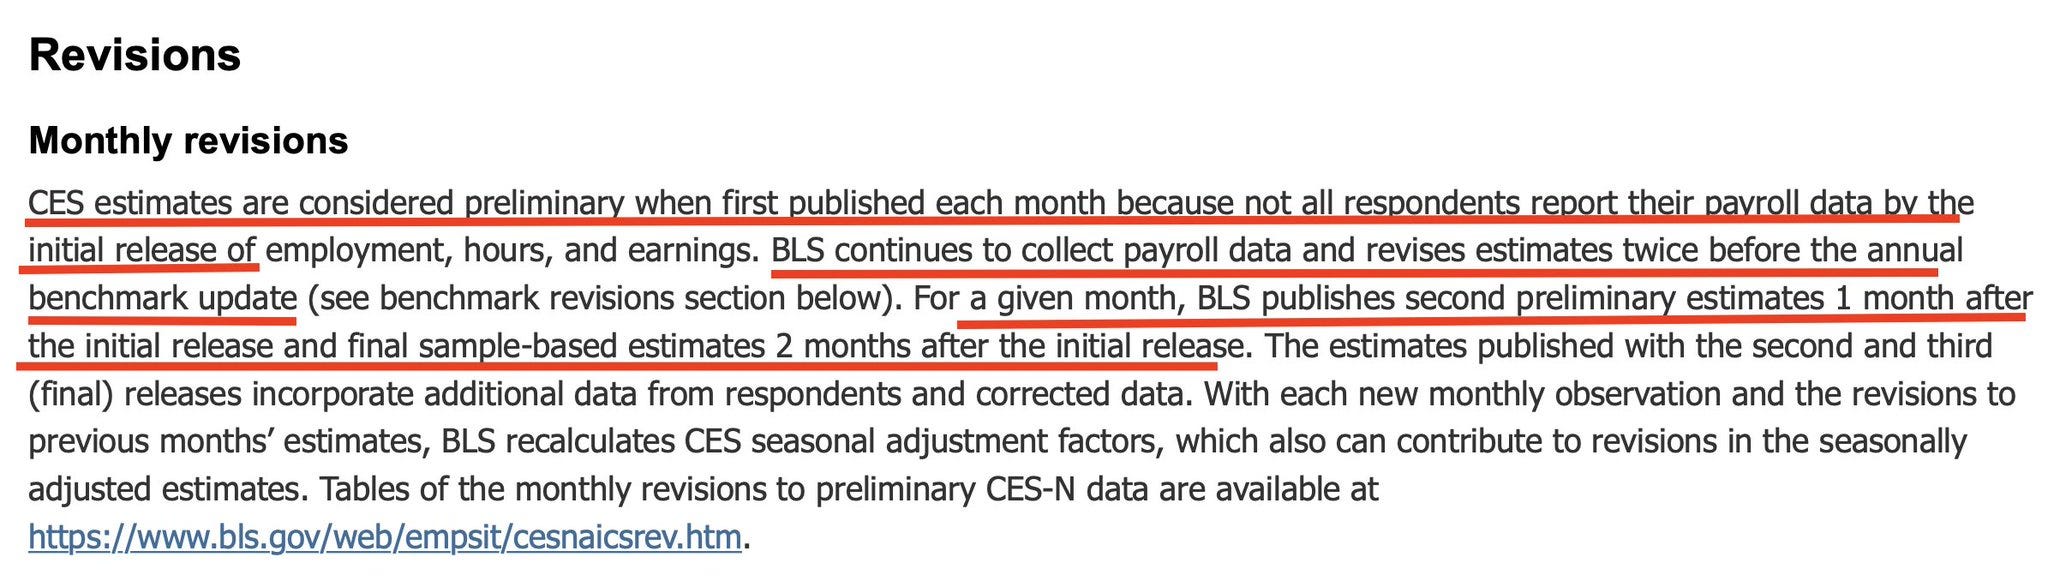
On Friday Trump fired Dr. McEntarfer, the commissioner of the Bureau of Labor and Statistics (BLS) due to the magnitude of revisions to hiring figures. We’ll hear a lot of noise about revisions and the decision to oust Dr. McEntarfer. Revisions are a normal part of the process and the large revisions that we’re seeing are right on schedule:
2020: extreme employment disruption
2022: job posting extreme
2024: employment revision extreme
Weaknesses in models are exposed when they encounter extremes. The extremes in employment disruption from covid are still working their way through.
The concern to keep on our radar is whether or not a new head of the BLS can maintain credibility.
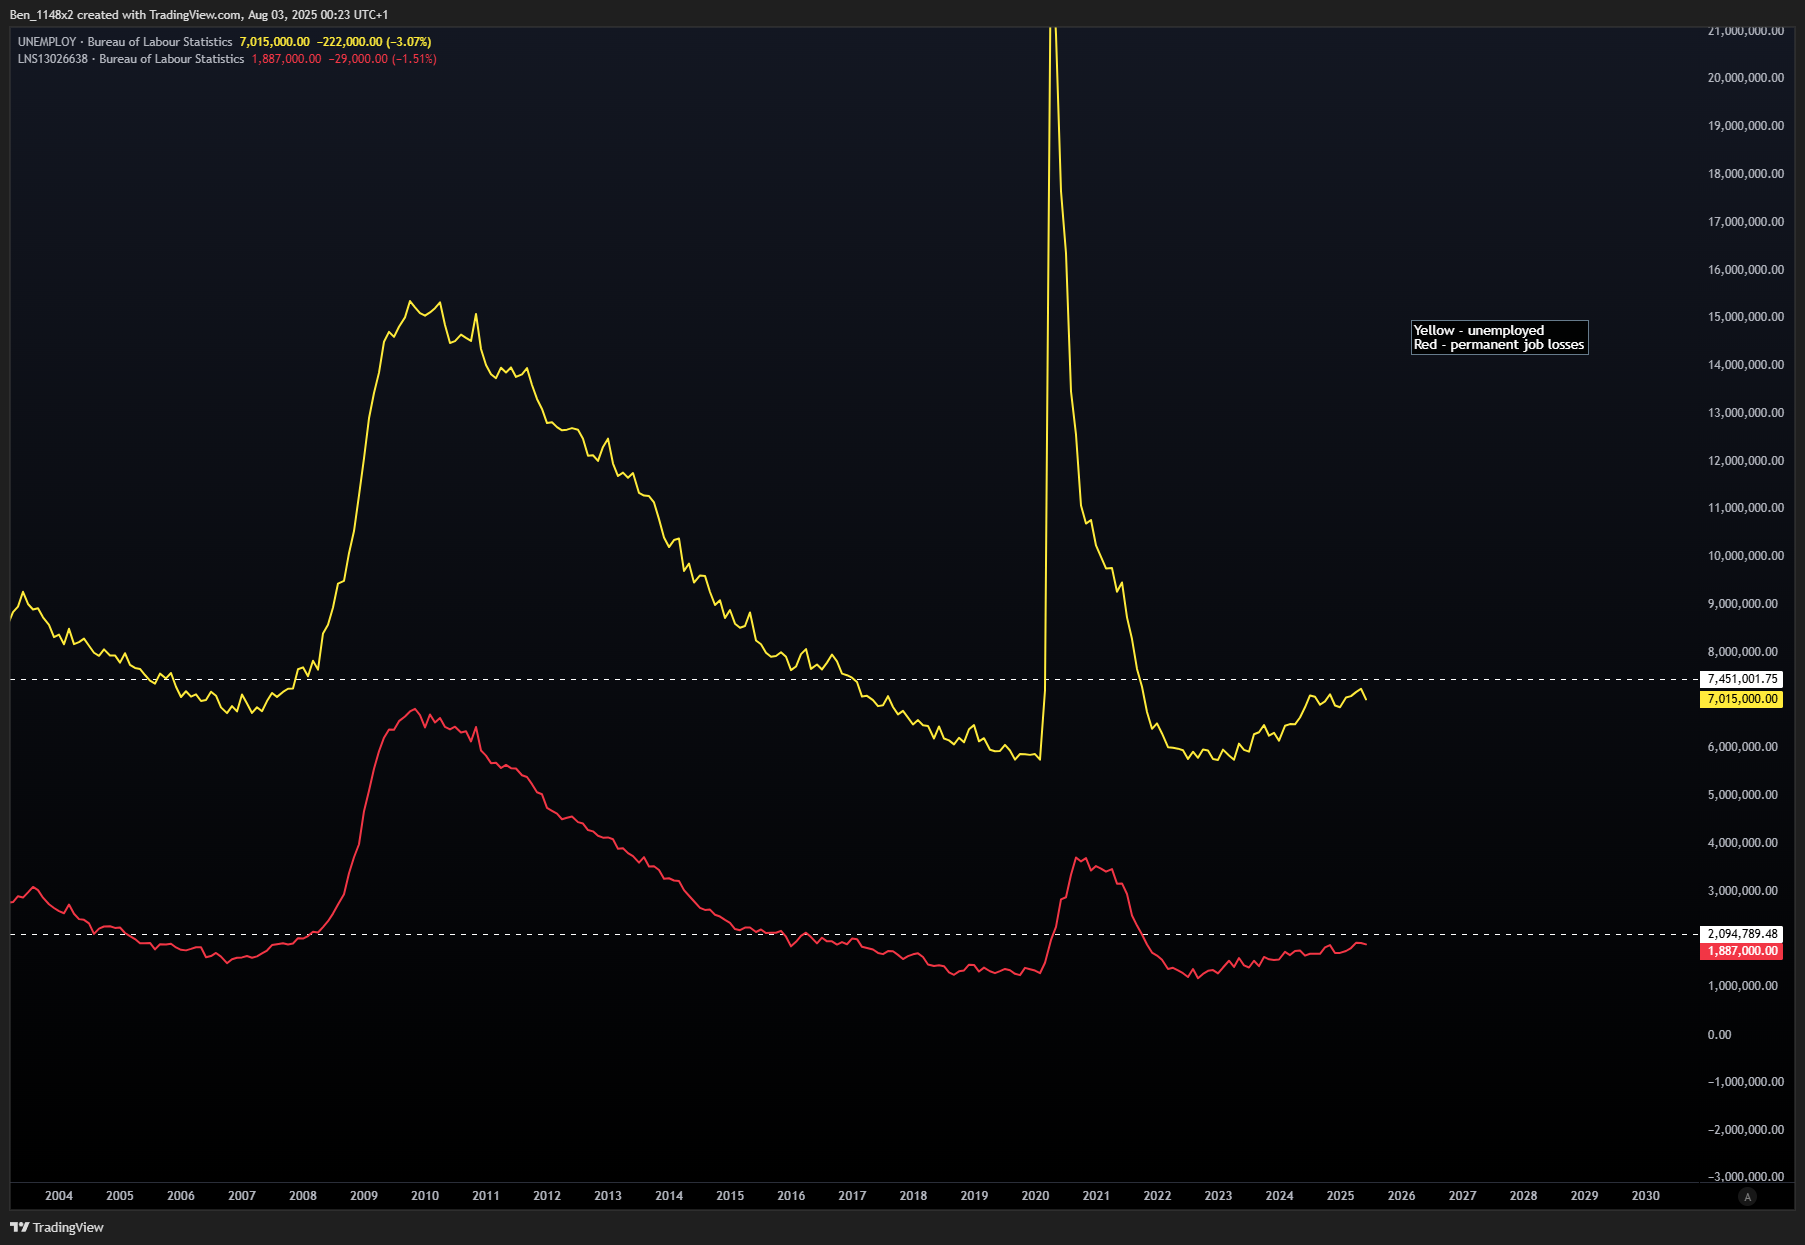
Labor remains strong. We have slightly more than once job opening per unemployed, and hiring outpaces the reduction in openings.

Permanent job losses remain relatively flat.
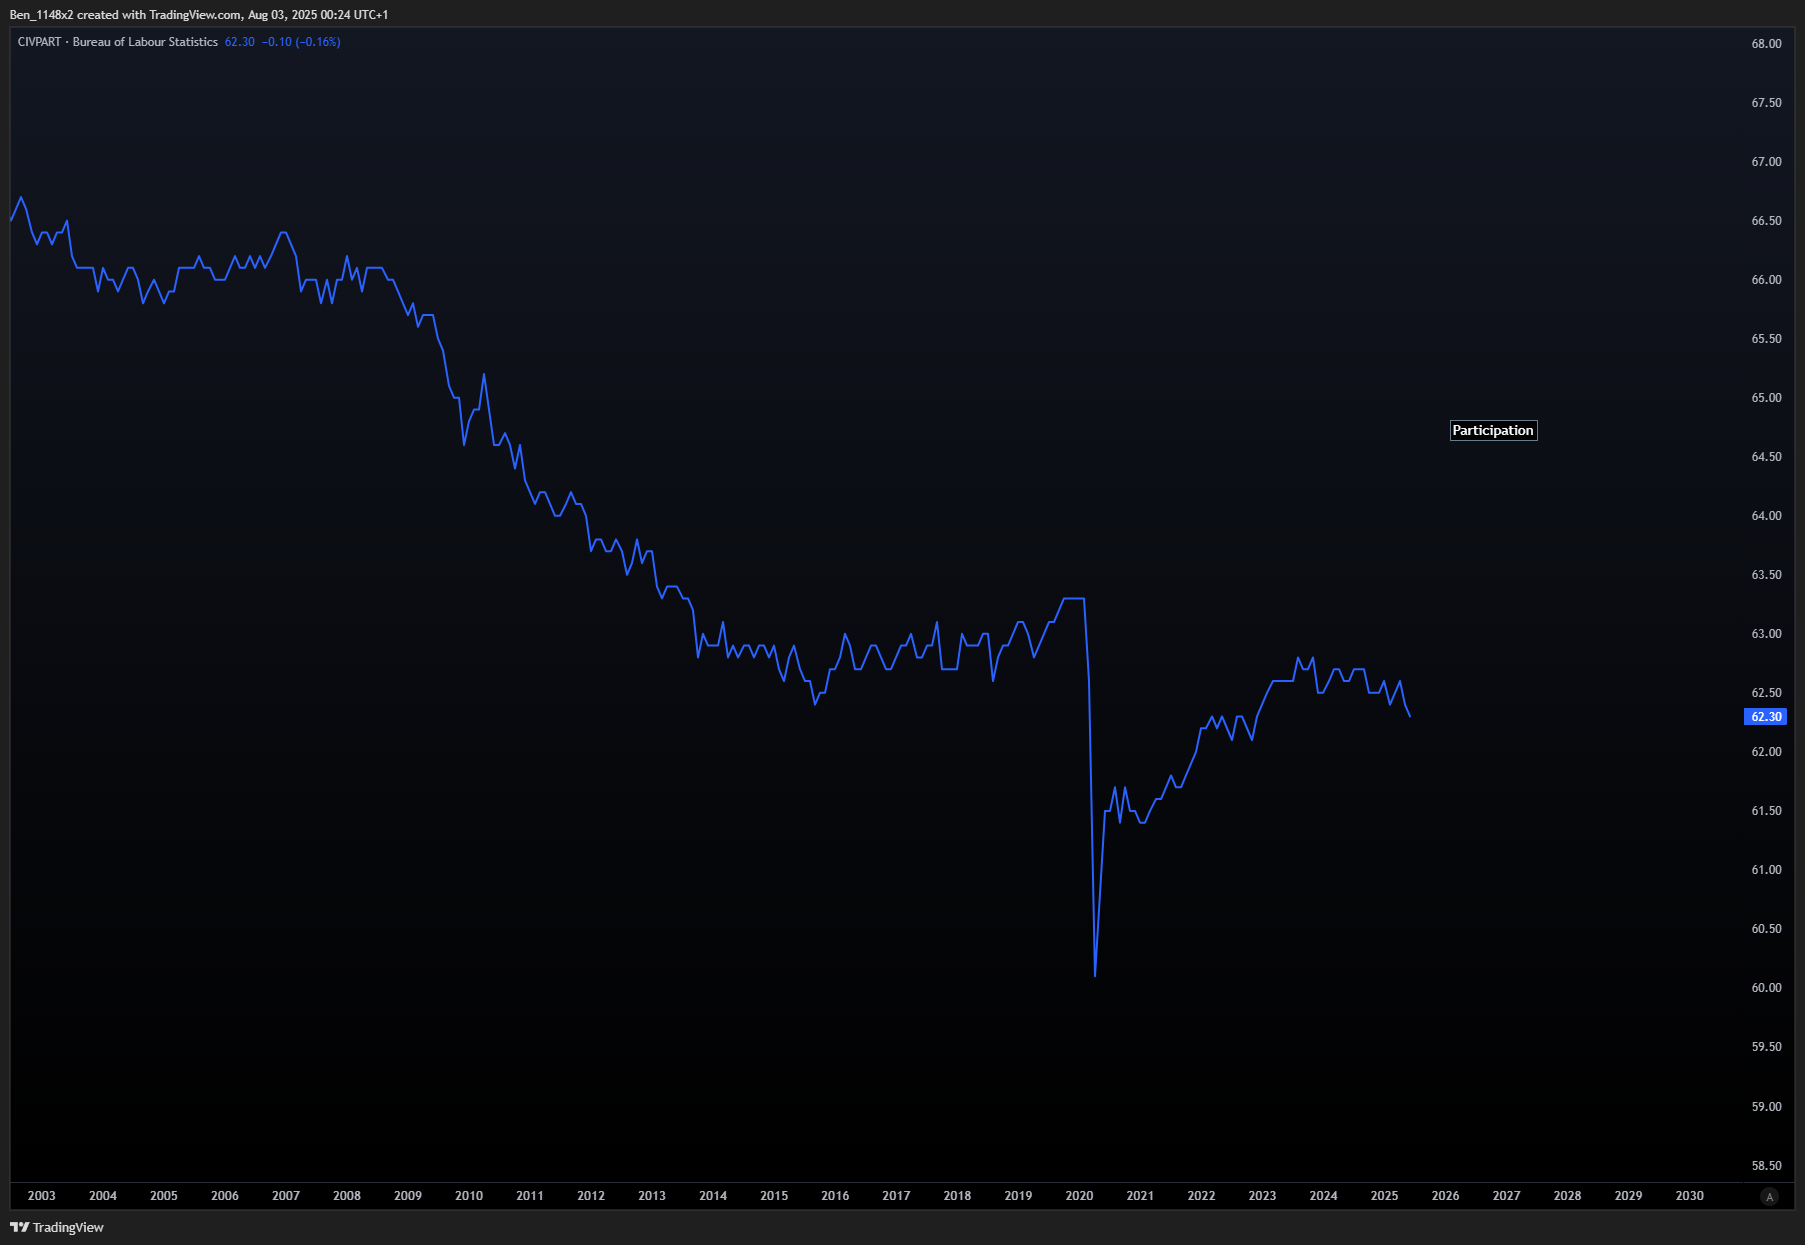
Labor participation has been falling for nearly two years from the post covid high, and never recovered to pre-covid levels. This is propping up other employment metrics.
This is a busy chart. These are economic factors that the NBER considers, along with some that I find to be relevant leading indicators for economic health. Up and to the right is good.
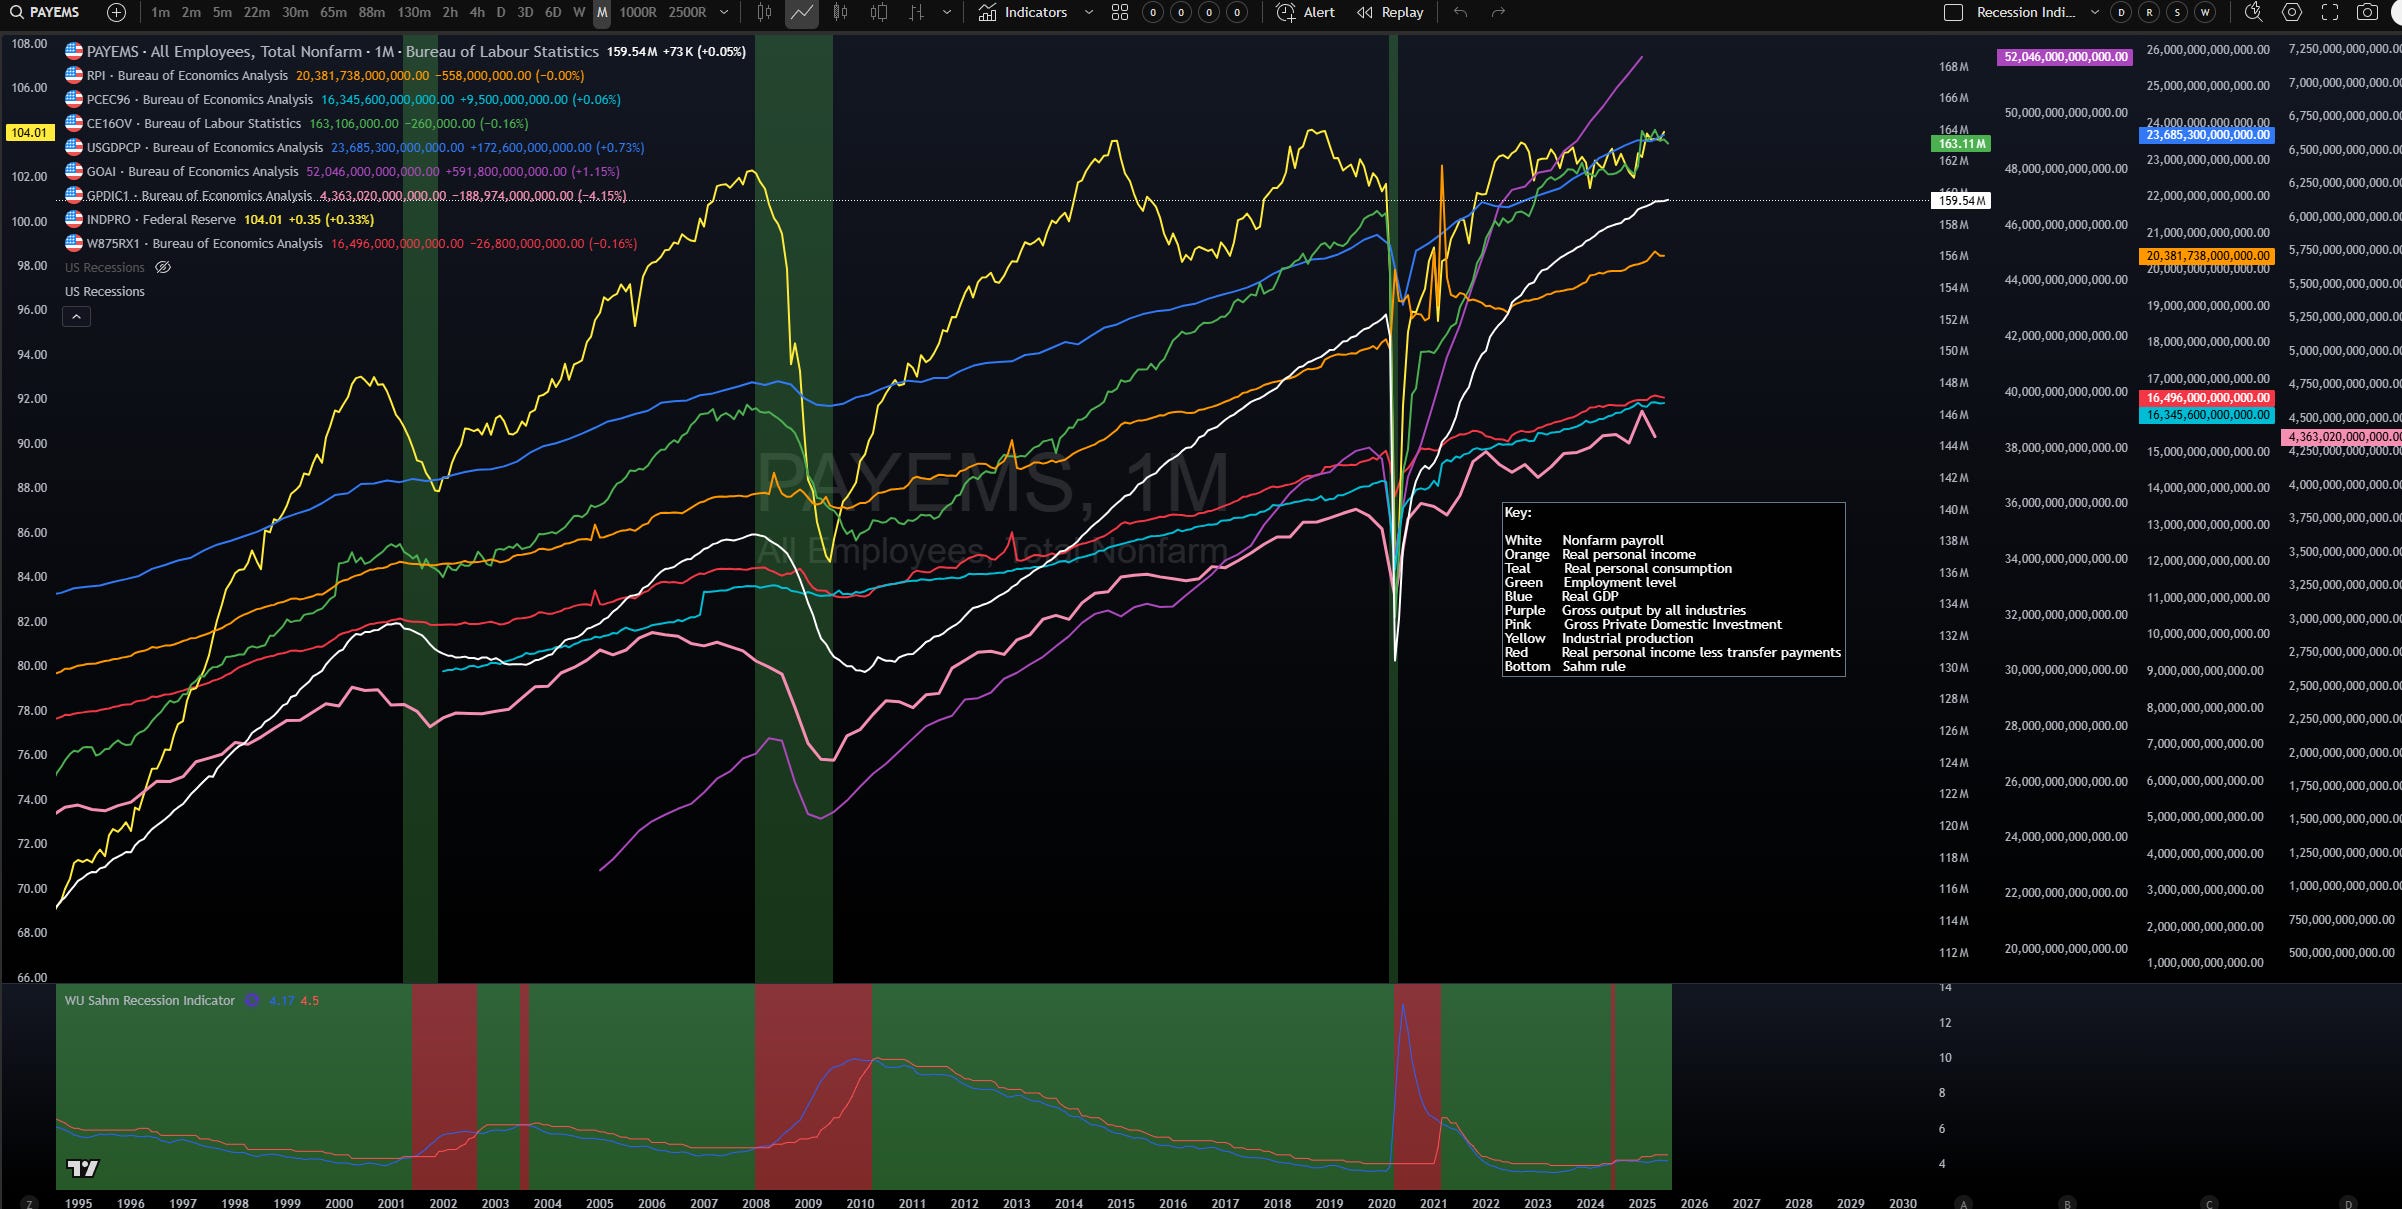
Industrial production, labor, and gross private domestic investment need to show improvement.
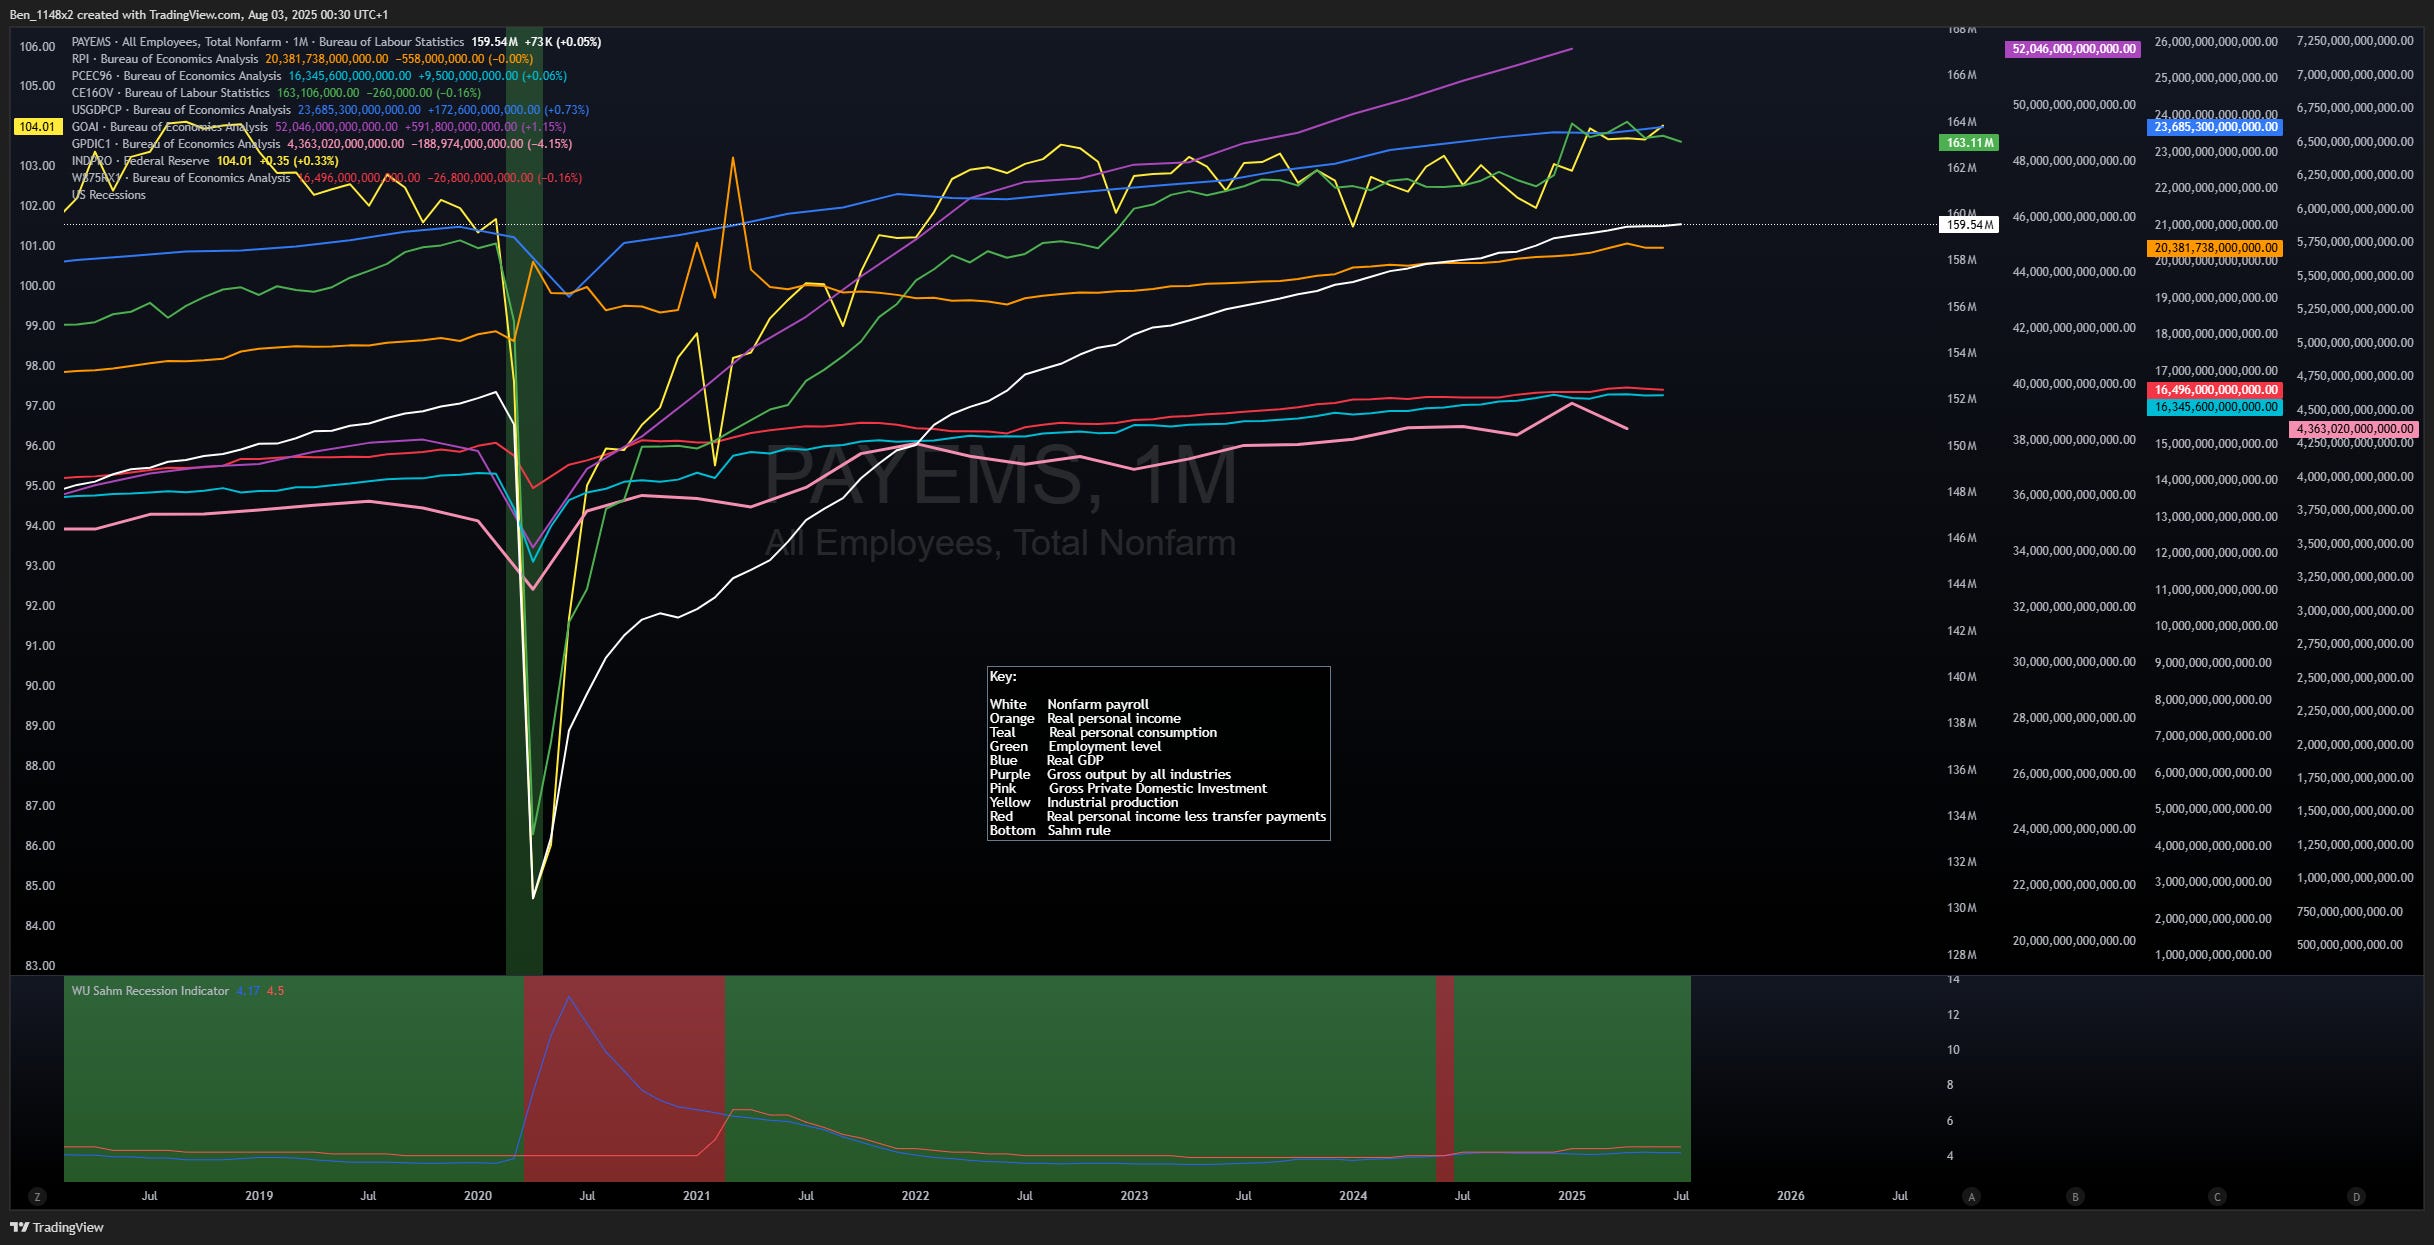
Remember, when it comes to macro economic data, I only care about whether or not it will support continued optimism. I believe that it will continue to do so for the foreseeable future.
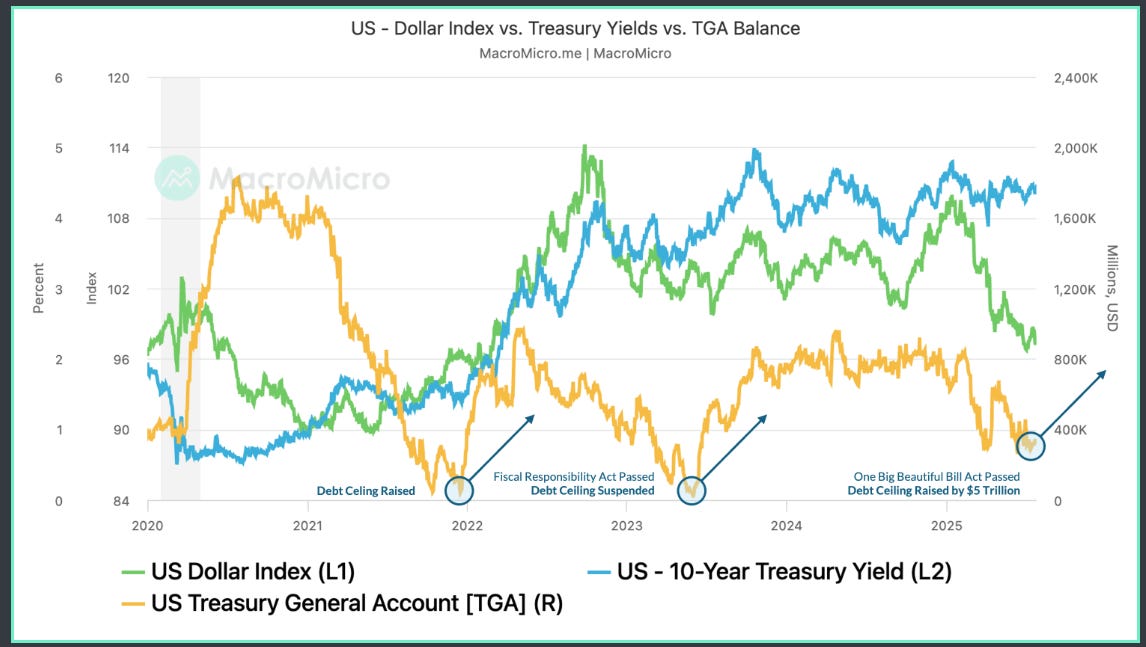
The Treasury will begin filling the Treasury General Account by issuing new debt. This will put downward pression on equity and treasury prices, and upward pressure on rates and the US dollar. There are two trade opportunities to consider later in this write up.
Market Analysis
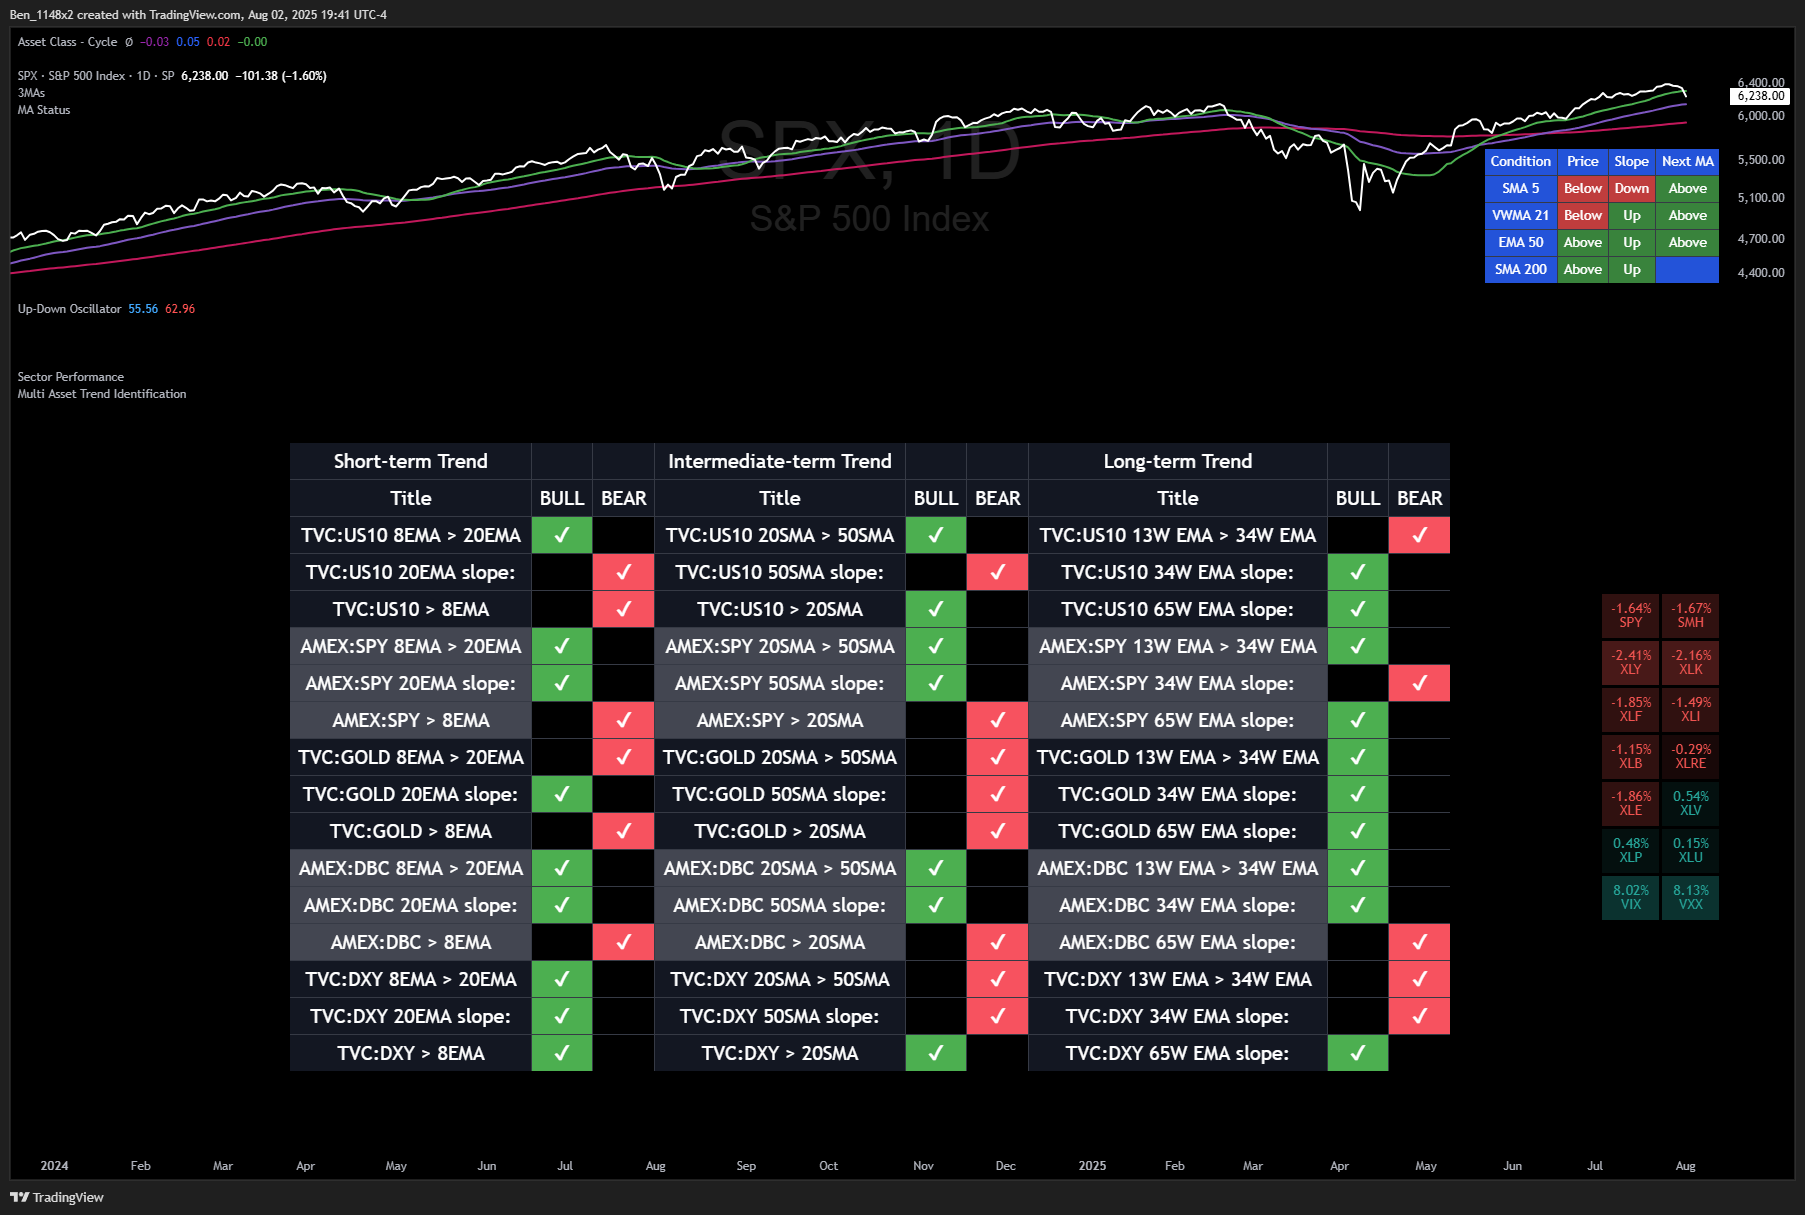
Trend Health - caution, rotation under way
US dollar is picking up the most strength in the short term. Gold, treasuries, and equities are cooling a bit. Commodities showing consistency in all time frames. We have not seen this for a little while.
Market Timing Indicators - signaling caution
Our market timing signals have slight deterioration from the readings that we saw in June and July. Two of our slowest moving signals finally flipped bullish, but the four most responsive signals have gone to either yellow or red.
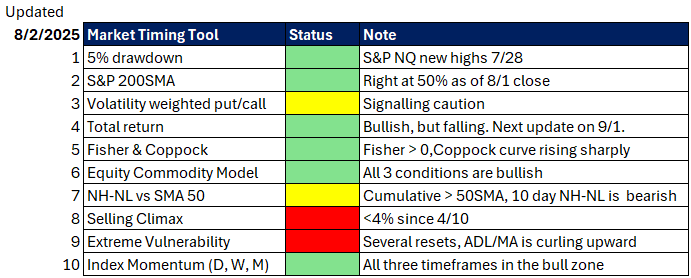
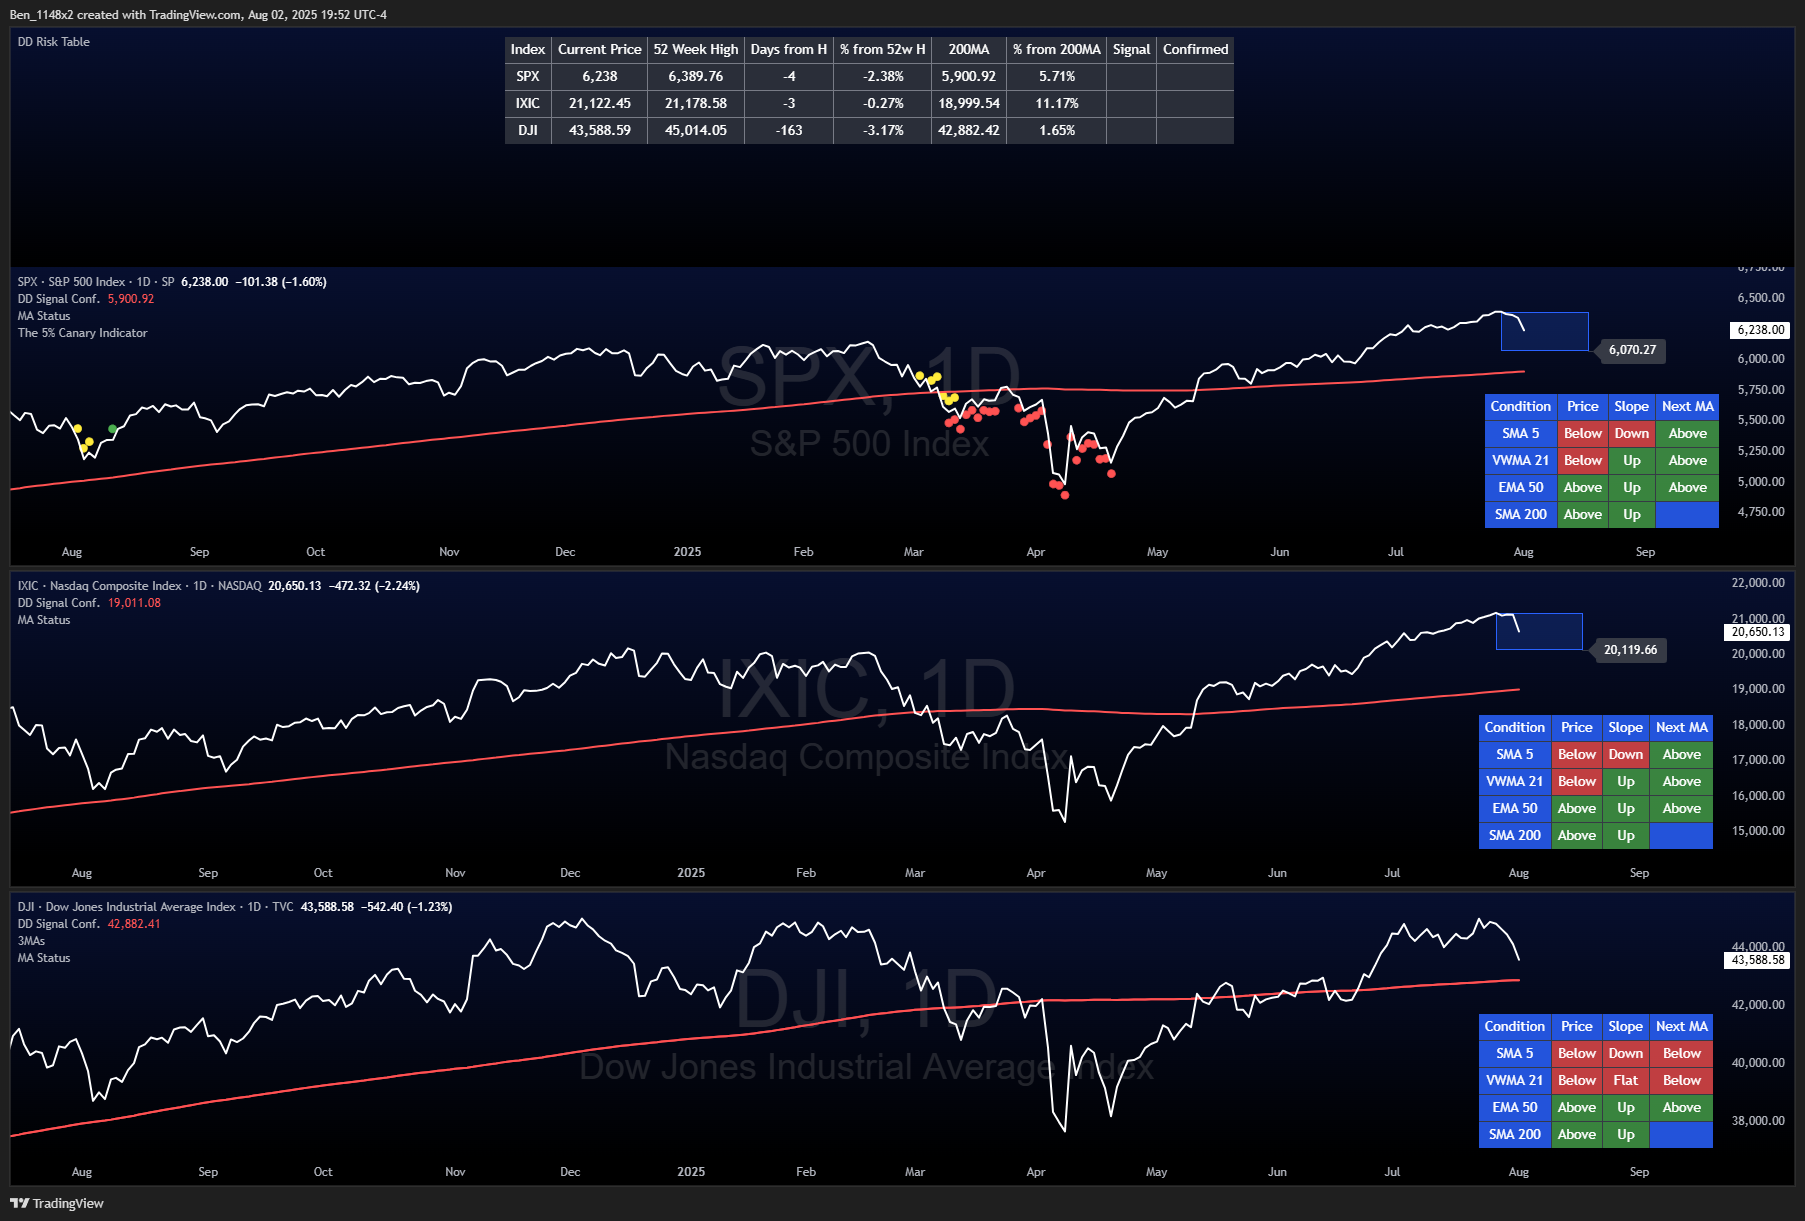
The S&P and Nasdaq made new 52 week highs on 7/28. A close below 6020 for the S&P, and a close below 20,120 for the Nasdaq on or before 8/18 would trigger the 5$ drawdown alert. The Dow has not made a new 52 week high during the last 163 trading days.
You can bookmark this chart here.
The volatility weighted put call ratio has an extreme tightening on its Bollinger band. This identifies a period of compressed volatility. We only have 15 instances of this indicator tightening this much. 14 were followed by a move lower in the S&P, but the timing varies.
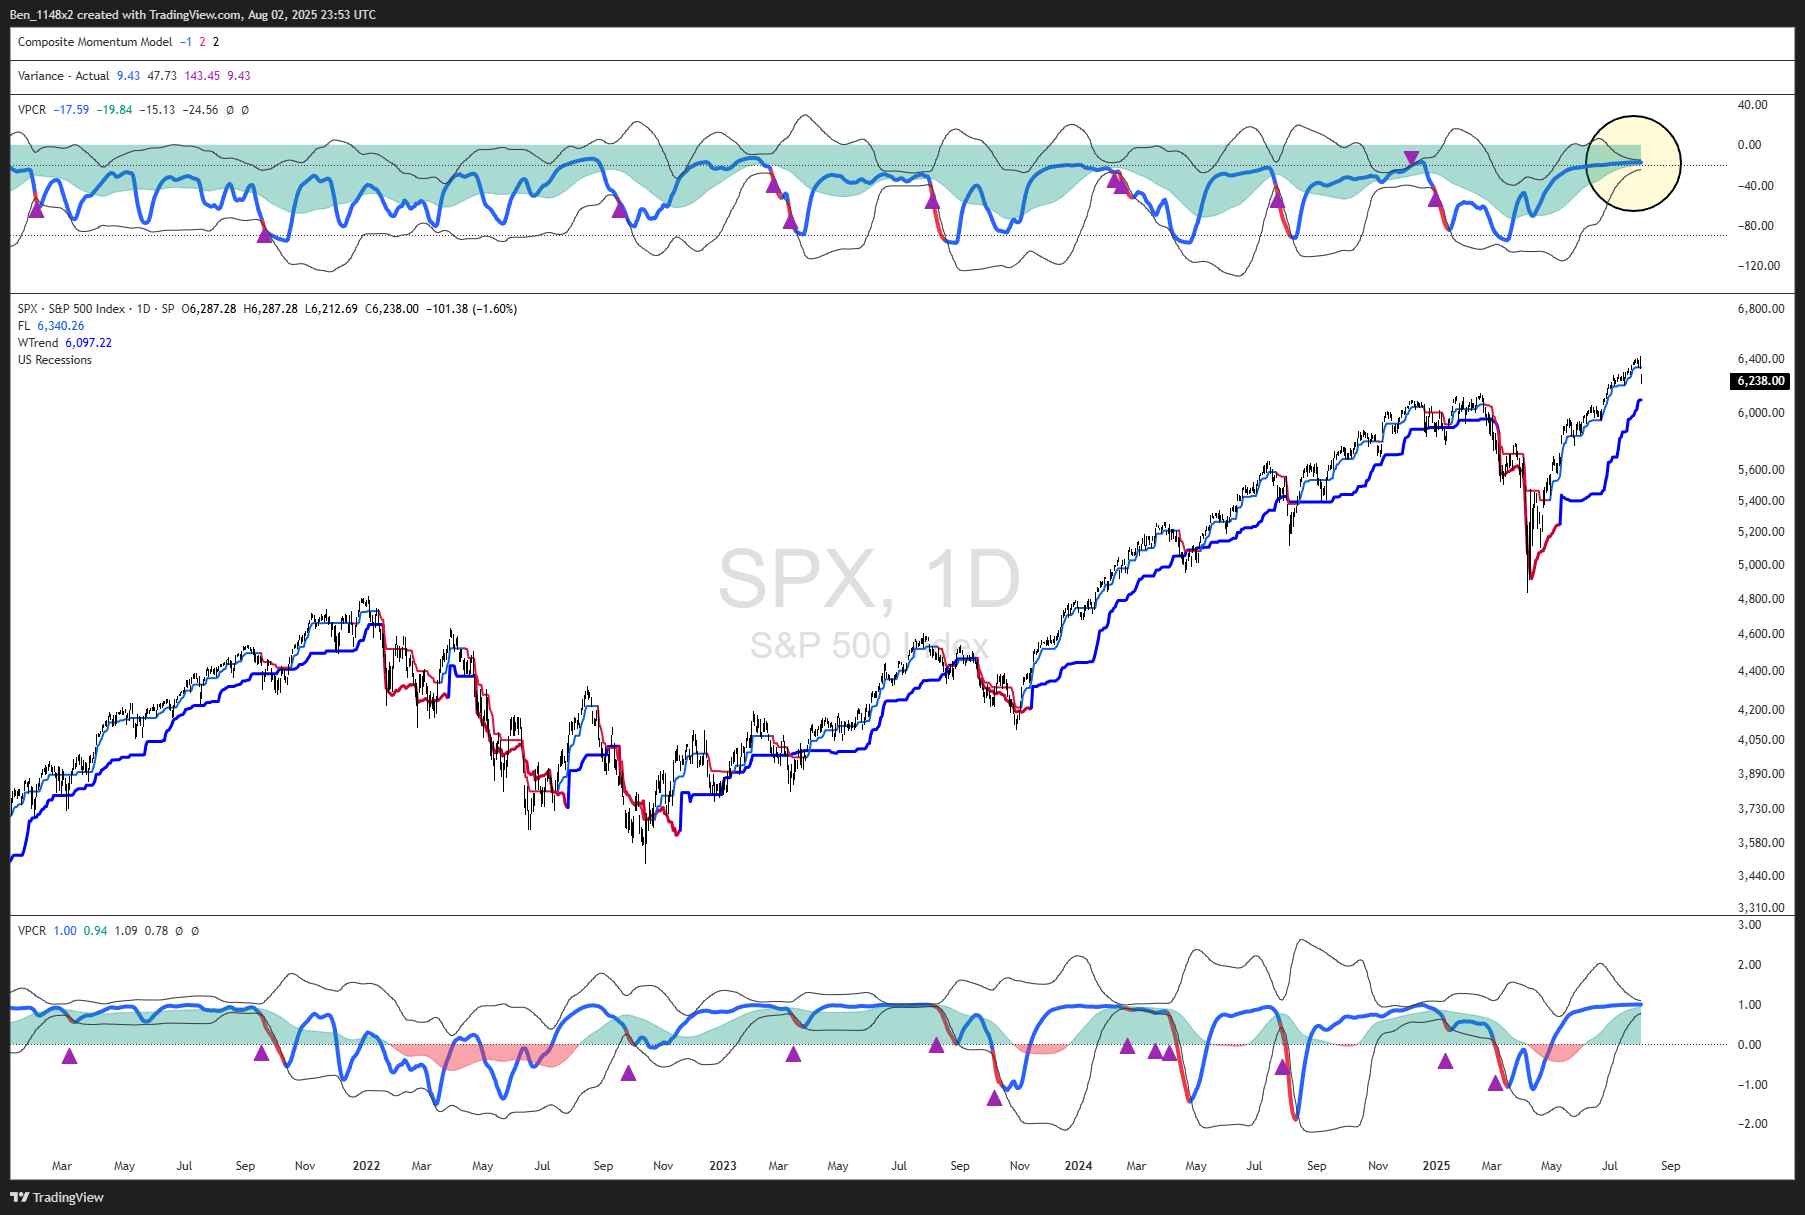
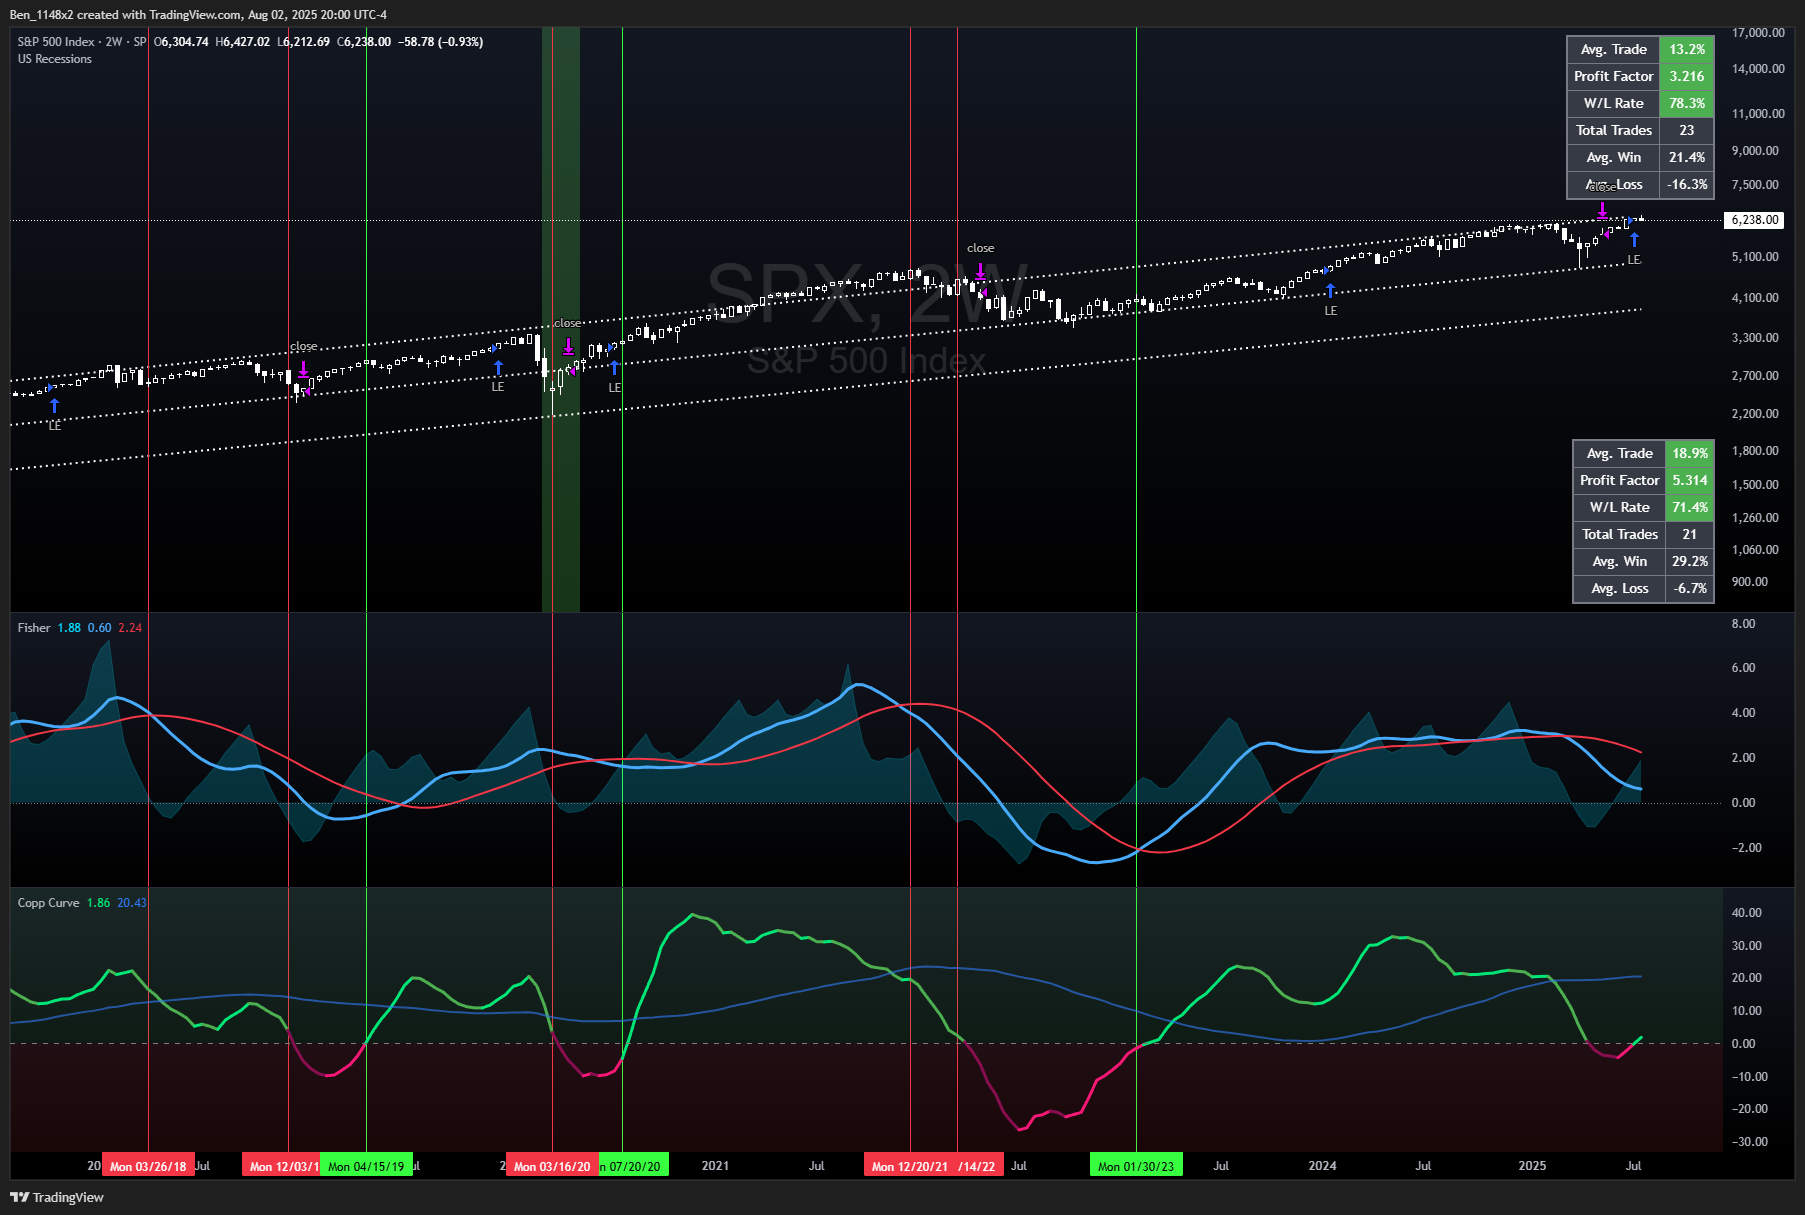
The Fisher transform and Coppock curve model is finally bullish. Remember that this is our slowest moving confirmation signal.
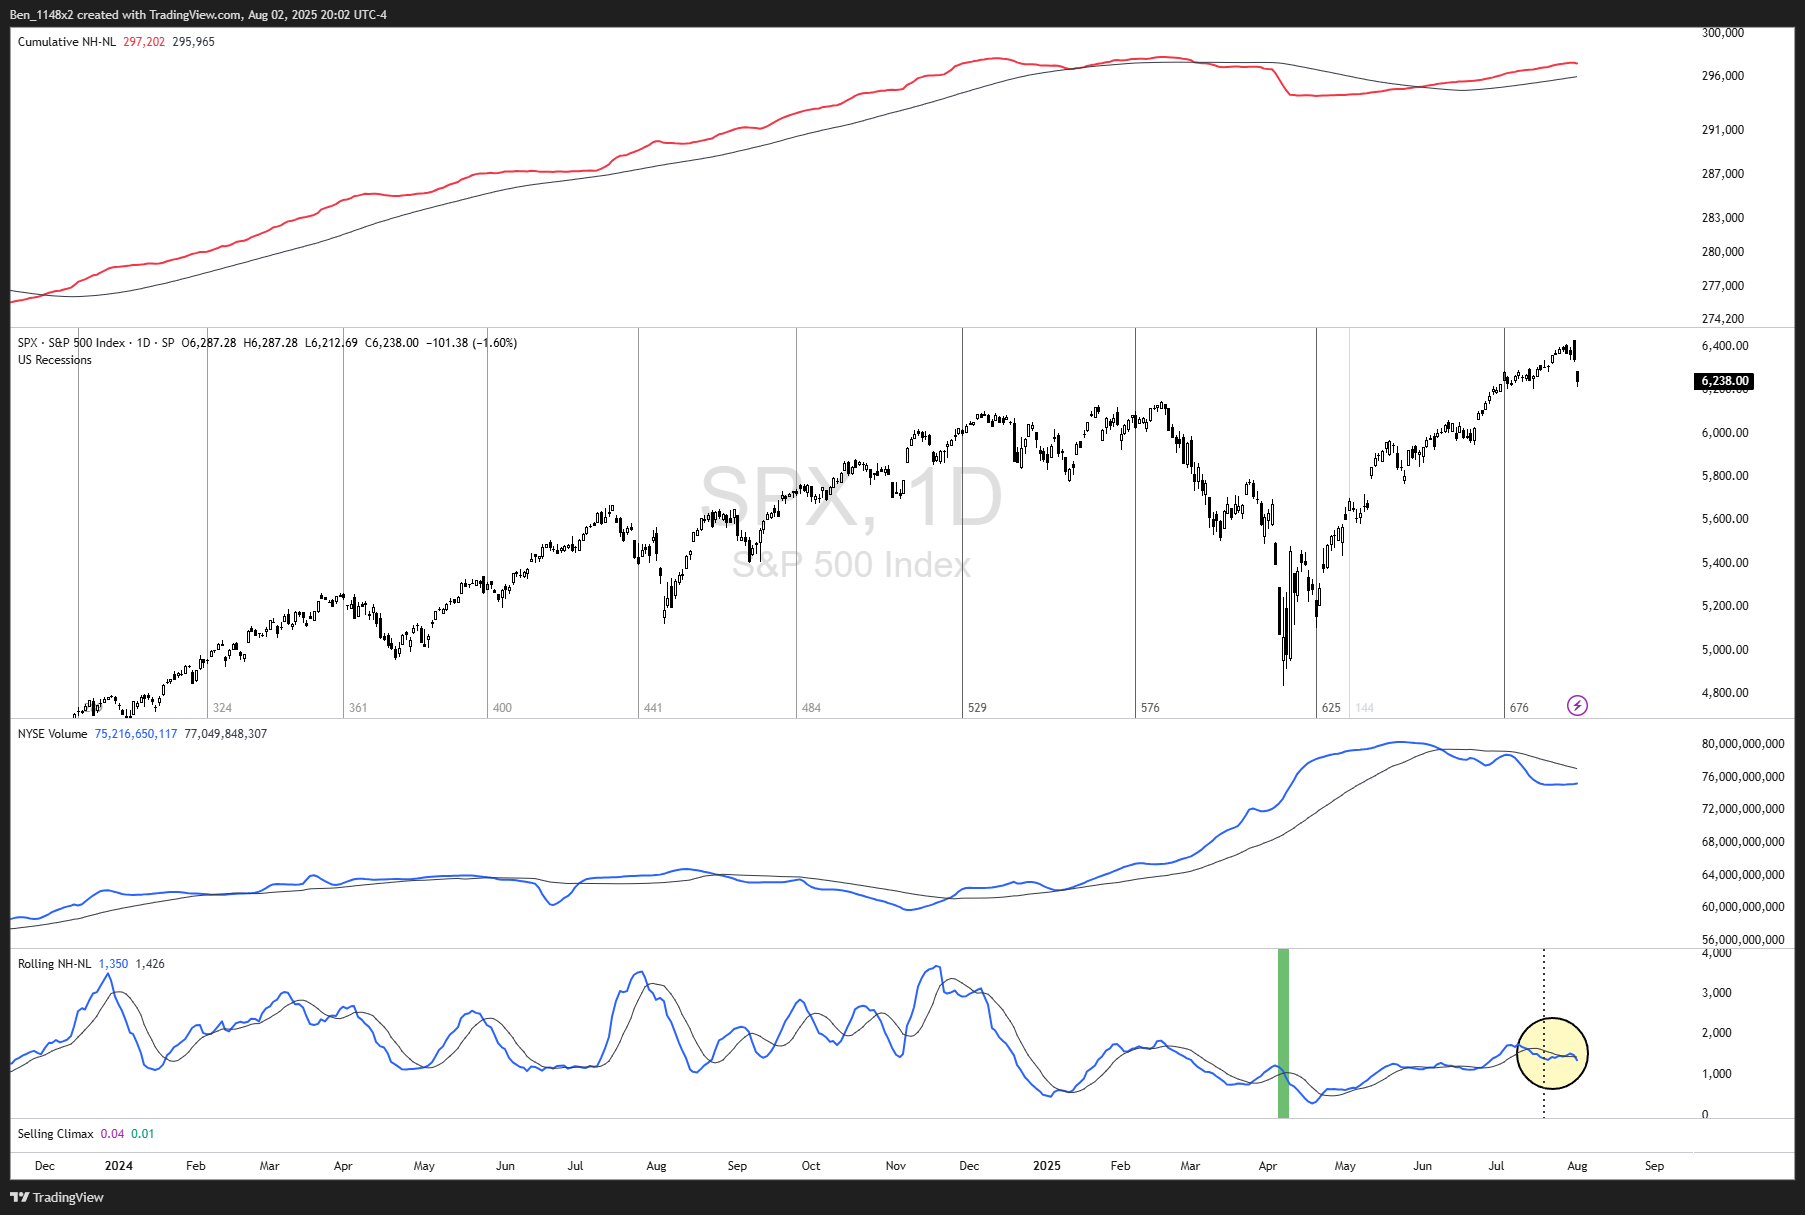
The 10 day rolling new highs minus new lows is below its moving average and downward sloping.
The advance decline line divided by its moving average gave a warning on Friday. The first time that it breaks below its Bollinger band is very rarely the low of the move in the S&P.
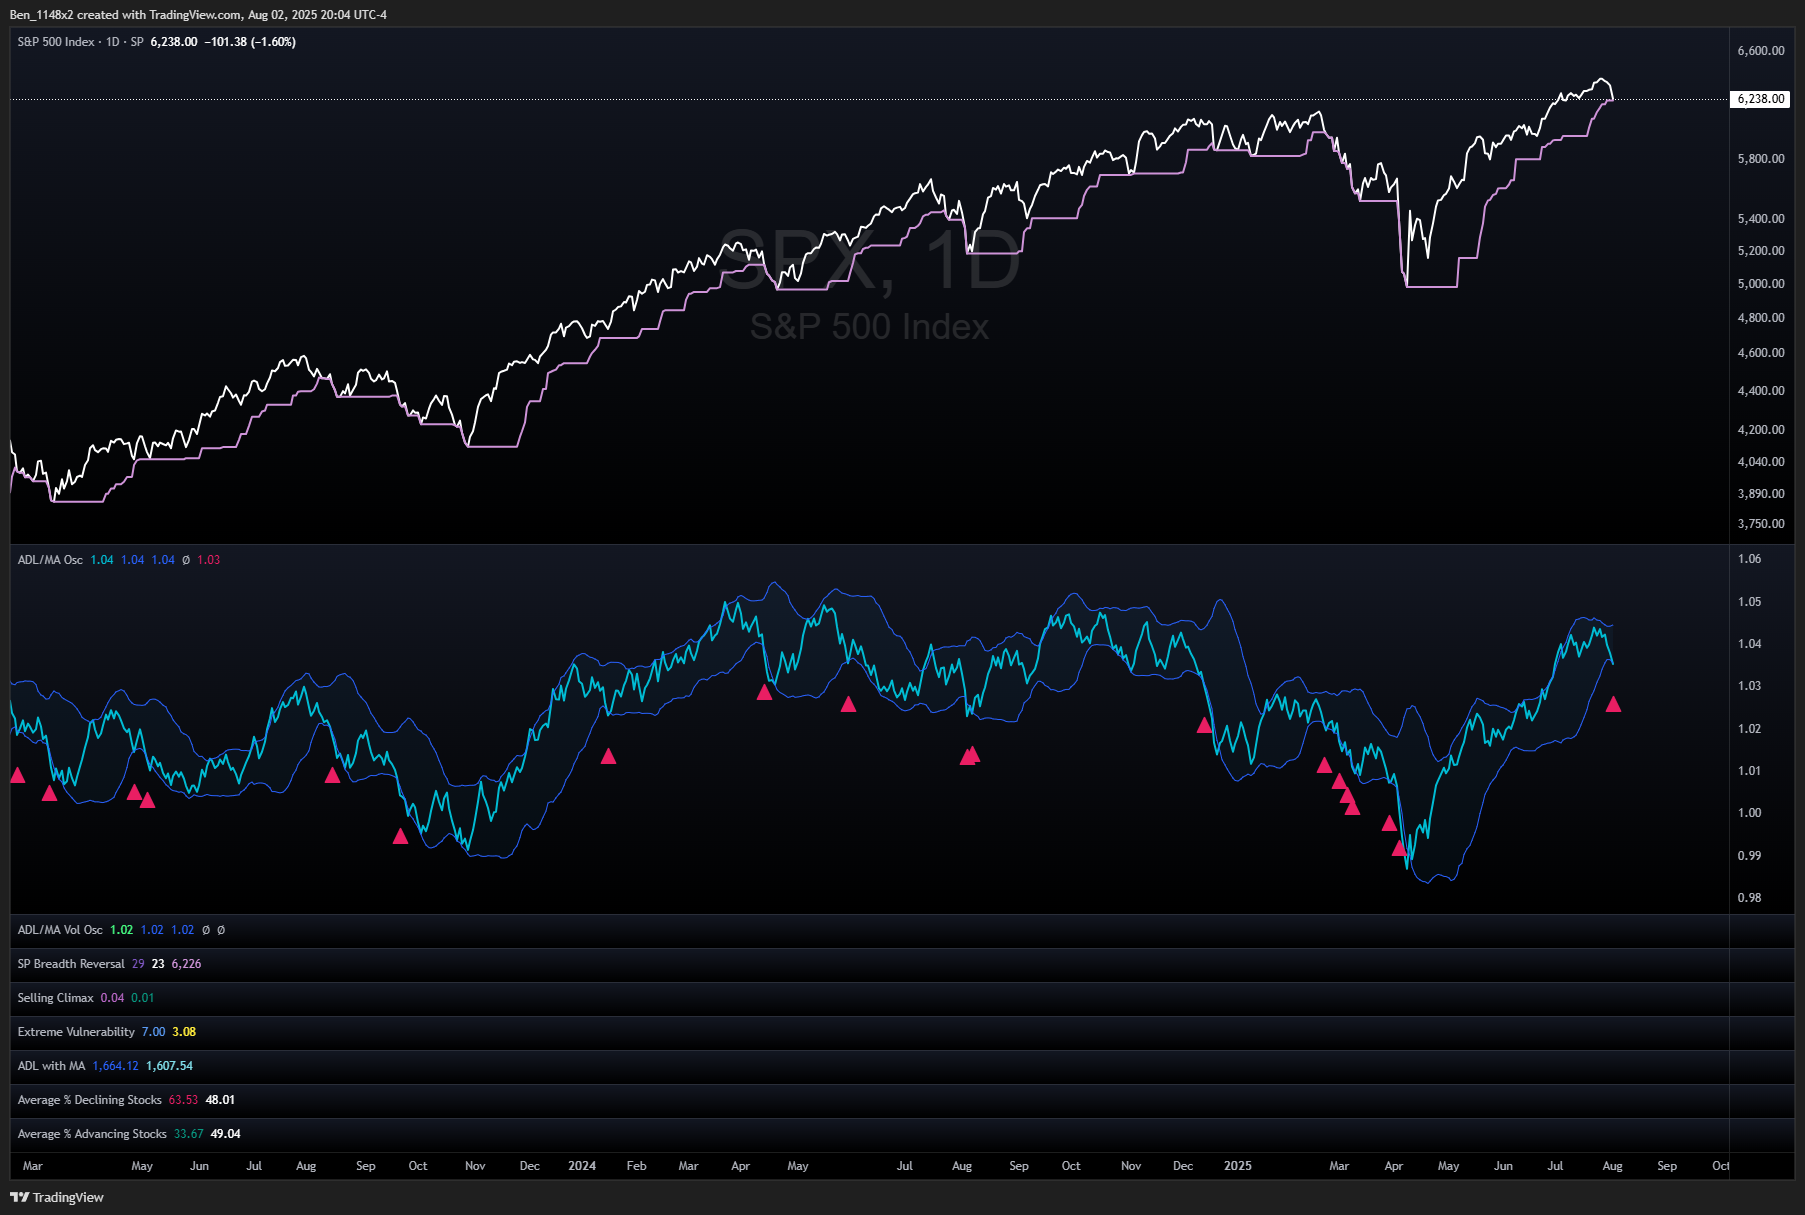
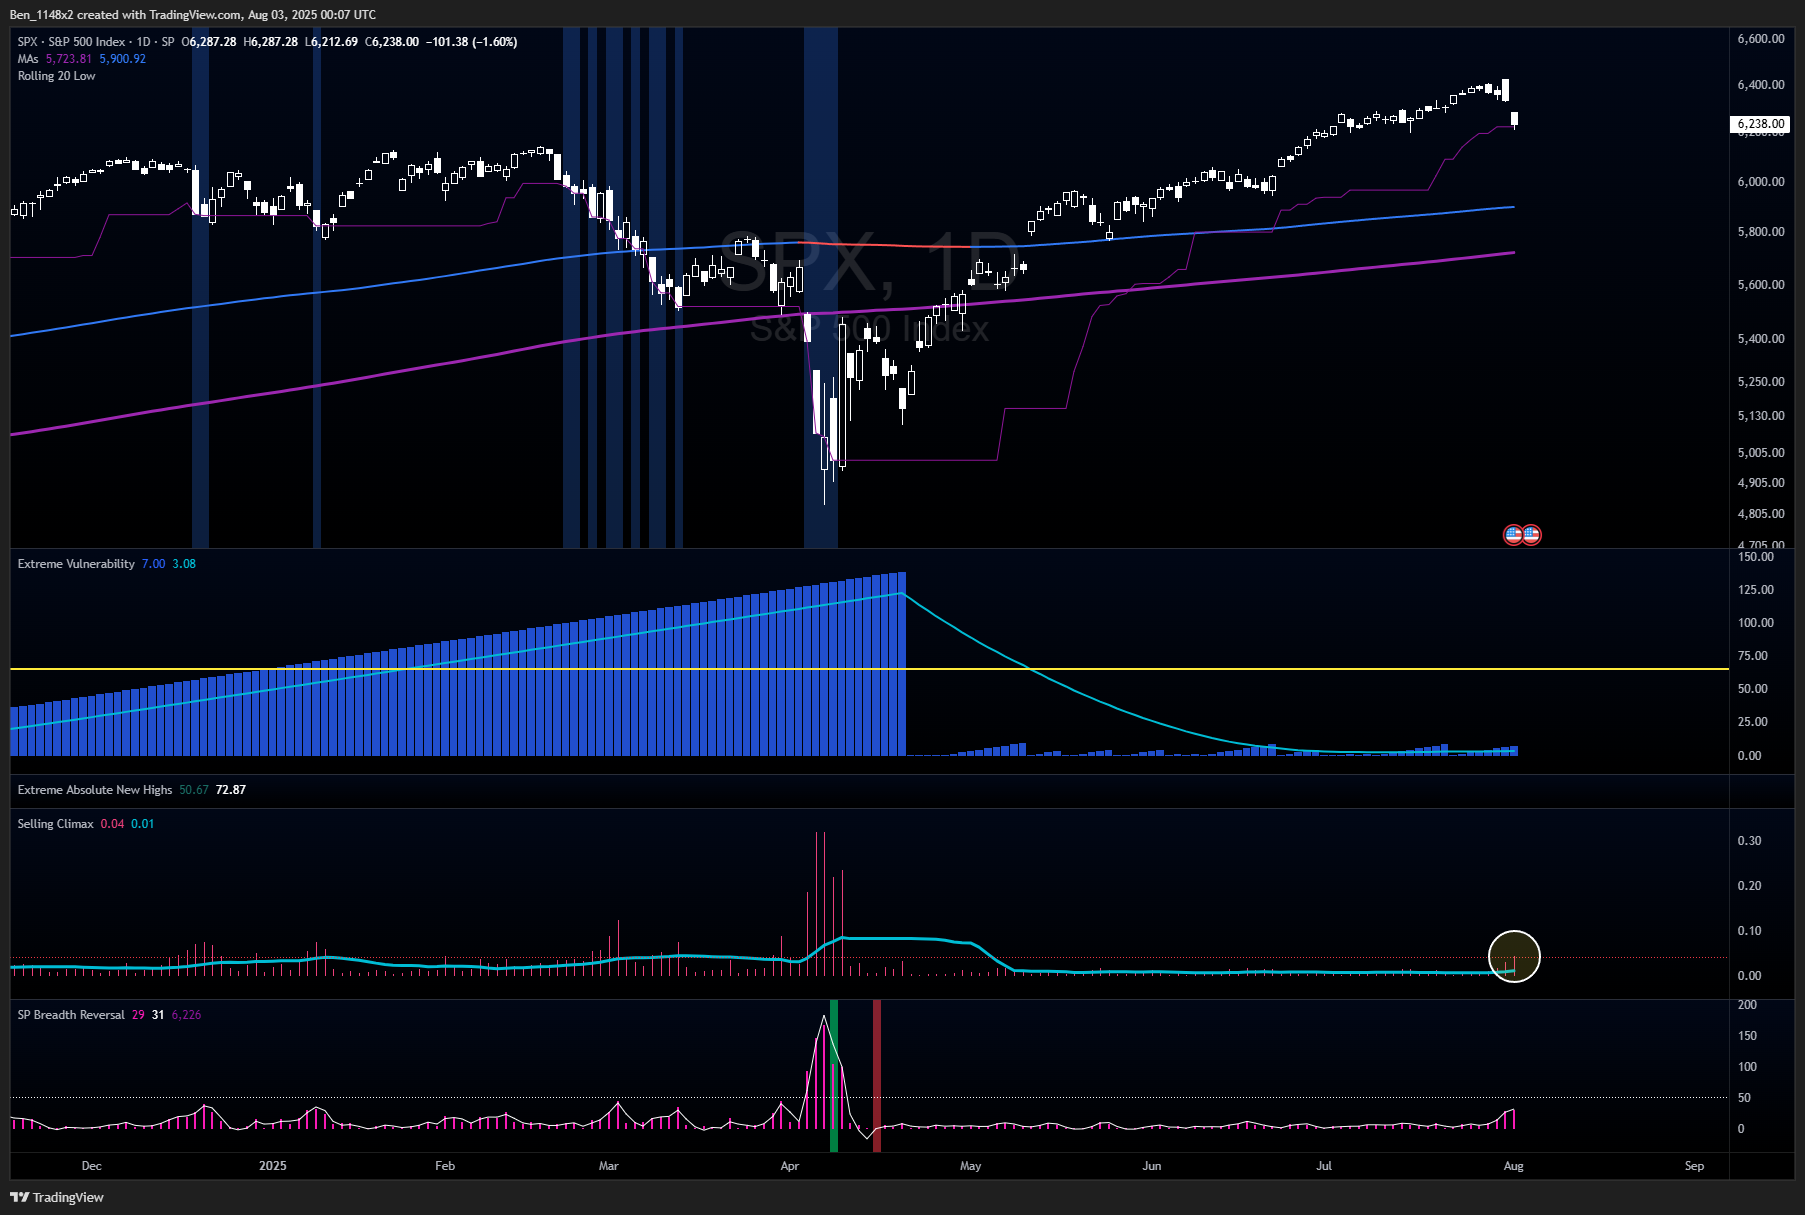
The selling climax indicator for net new lows reached the 4% threshold for a warning on Friday.
VIX
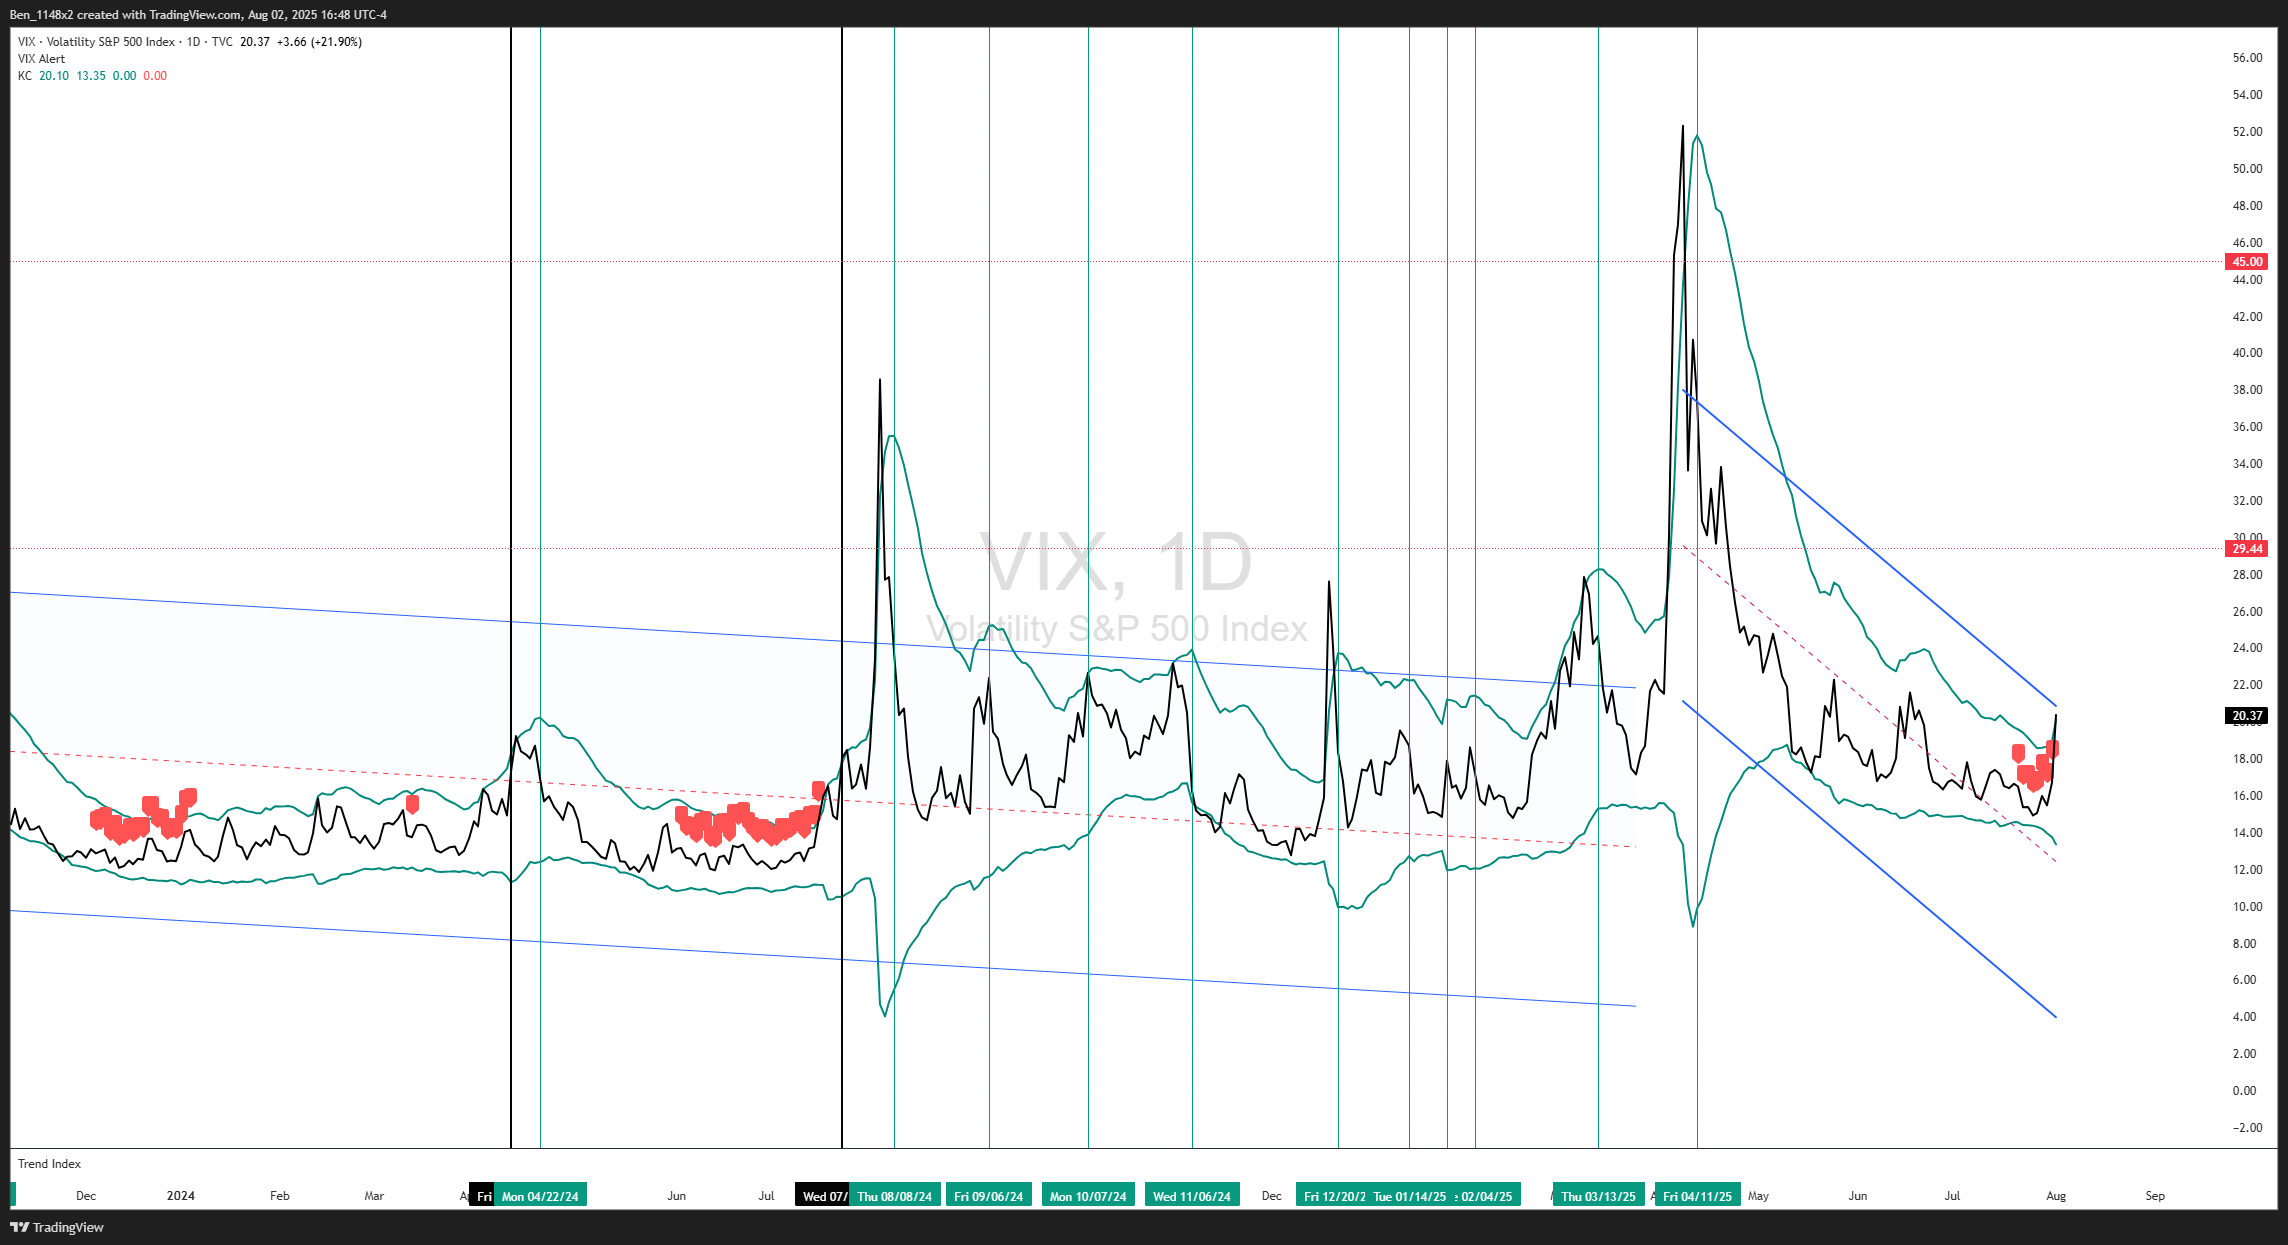
VIX had a 20% spike on Friday. When the upper channel of the Keltner channel rolls over we will have seen the local low in the S&P.
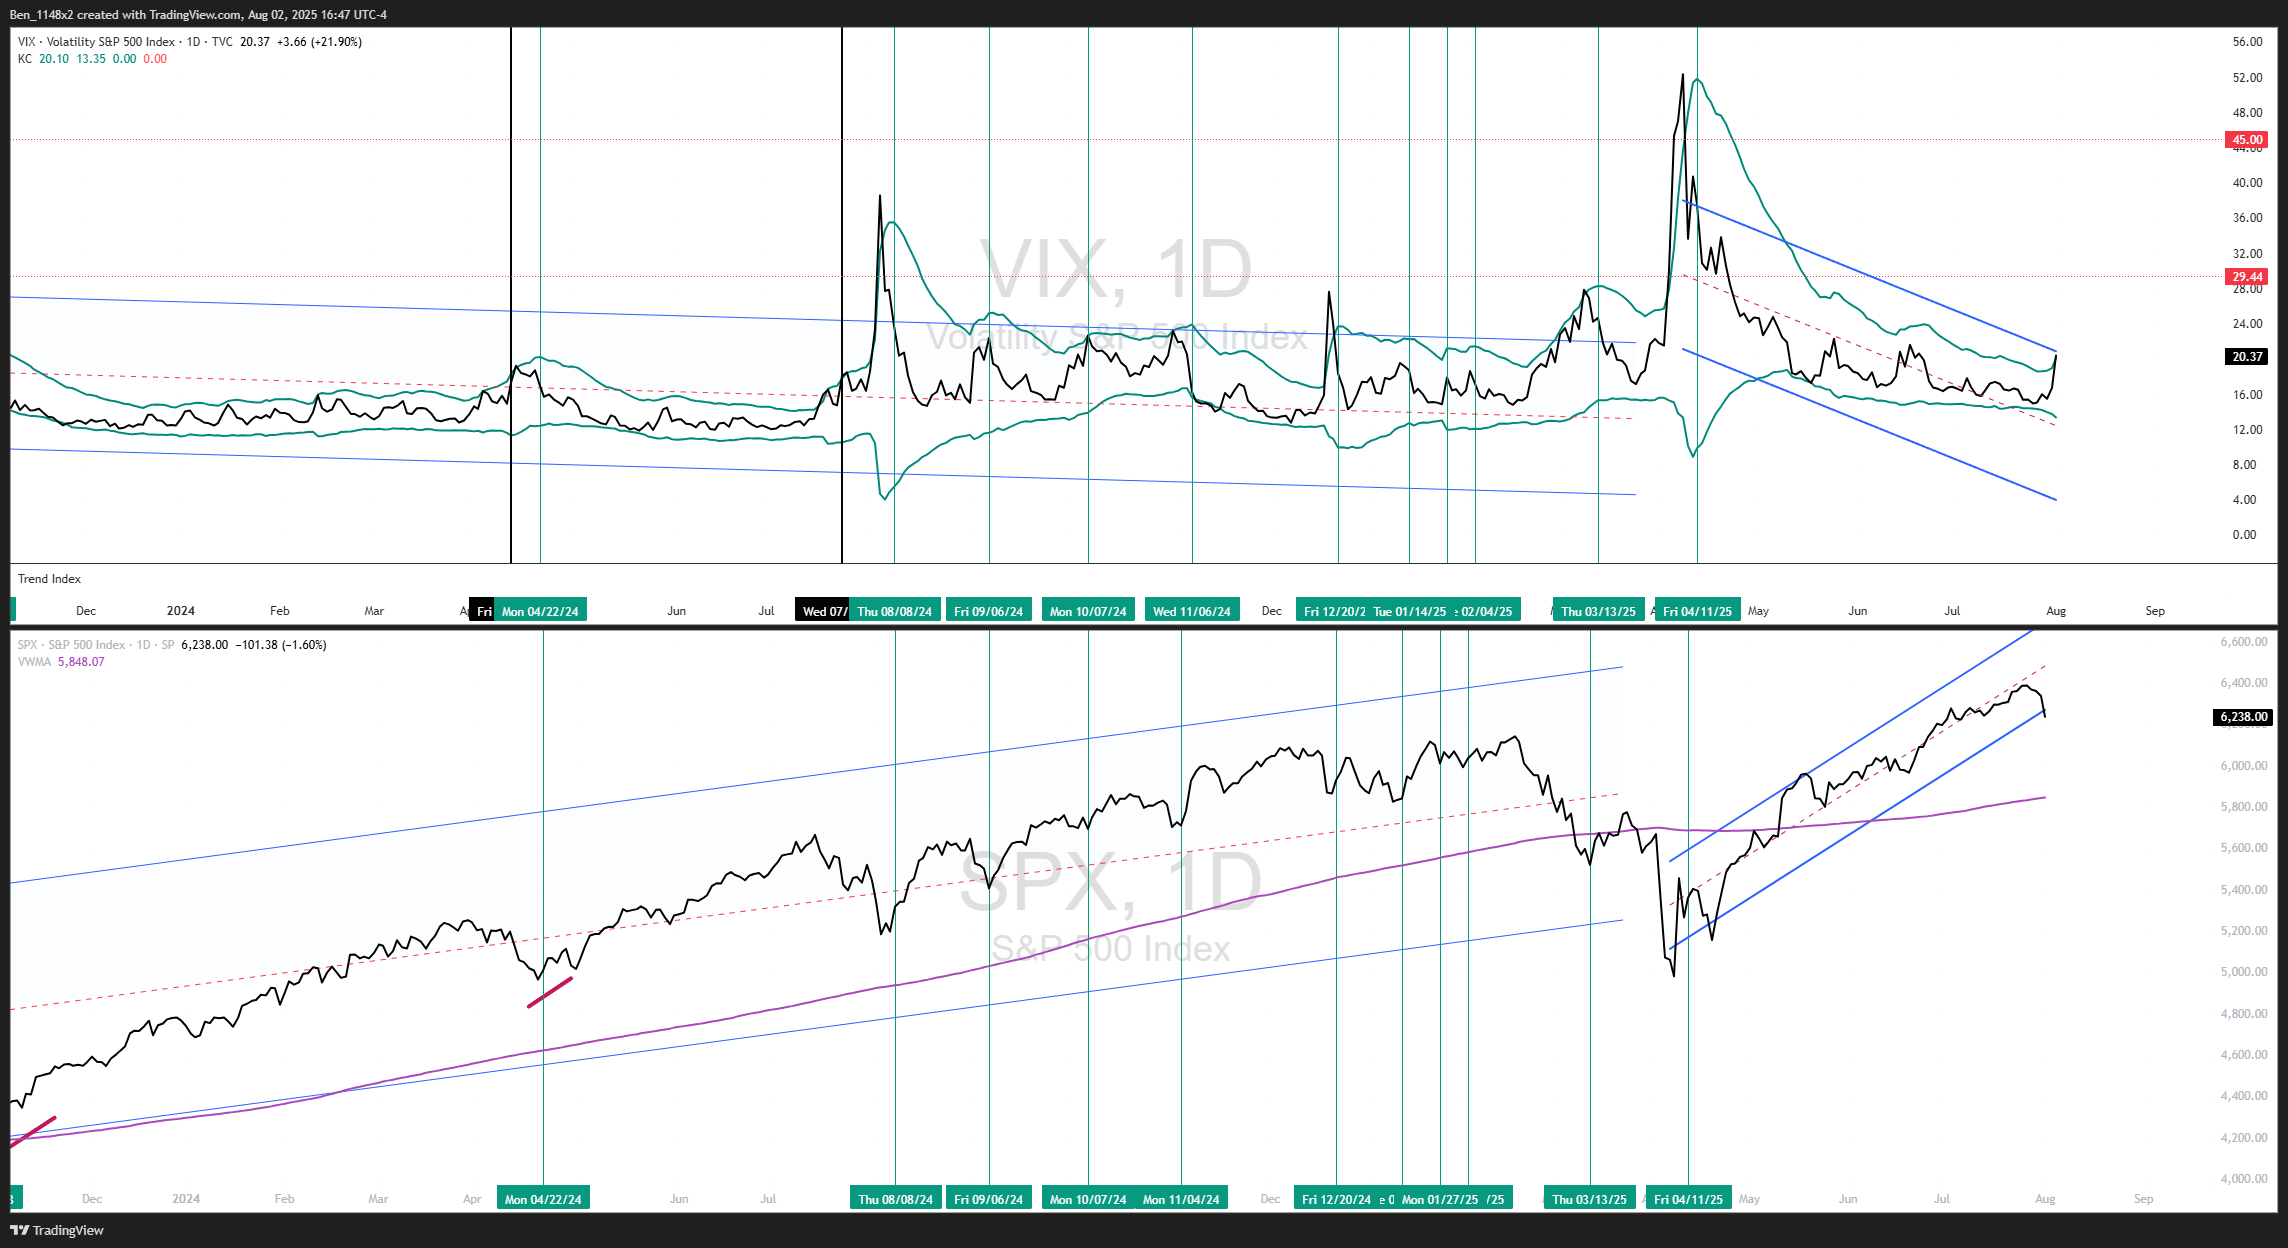
This comes a few after Andrew Thrashers ‘volatility tsunami’ signal. This signal tells us when volatility is very compressed and to be followed by a volatility spike within 2-3 weeks.
Read more about the volatility tsunami here.
S&P
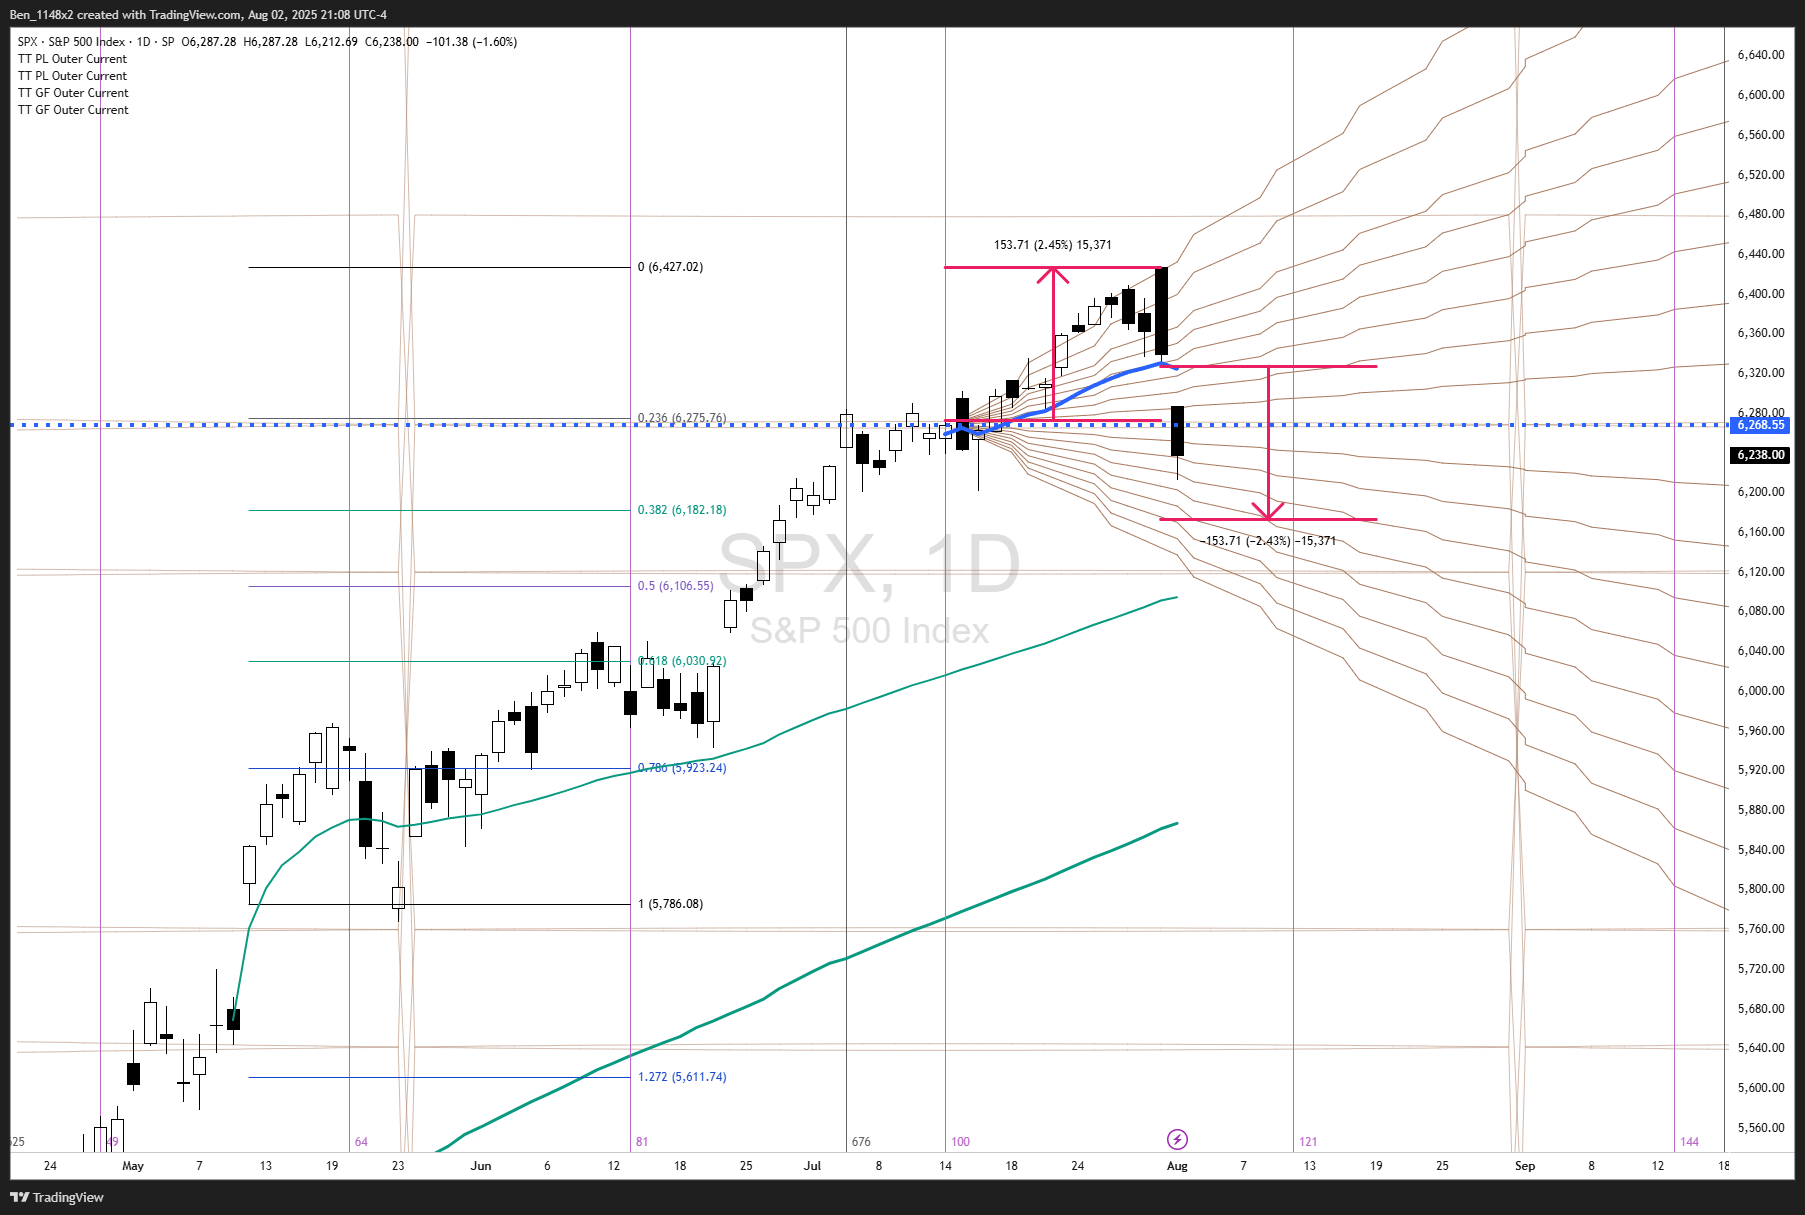
The move down in the S&P comes very close to the 8/4 pivot point identified in the chart with the planetary Gann fan and square of 9 tools anchored to the March lunar eclipse. 8/22 will be a “black moon” (second new moon in a calendar month) and 9/8 will be the next lunar eclipse.
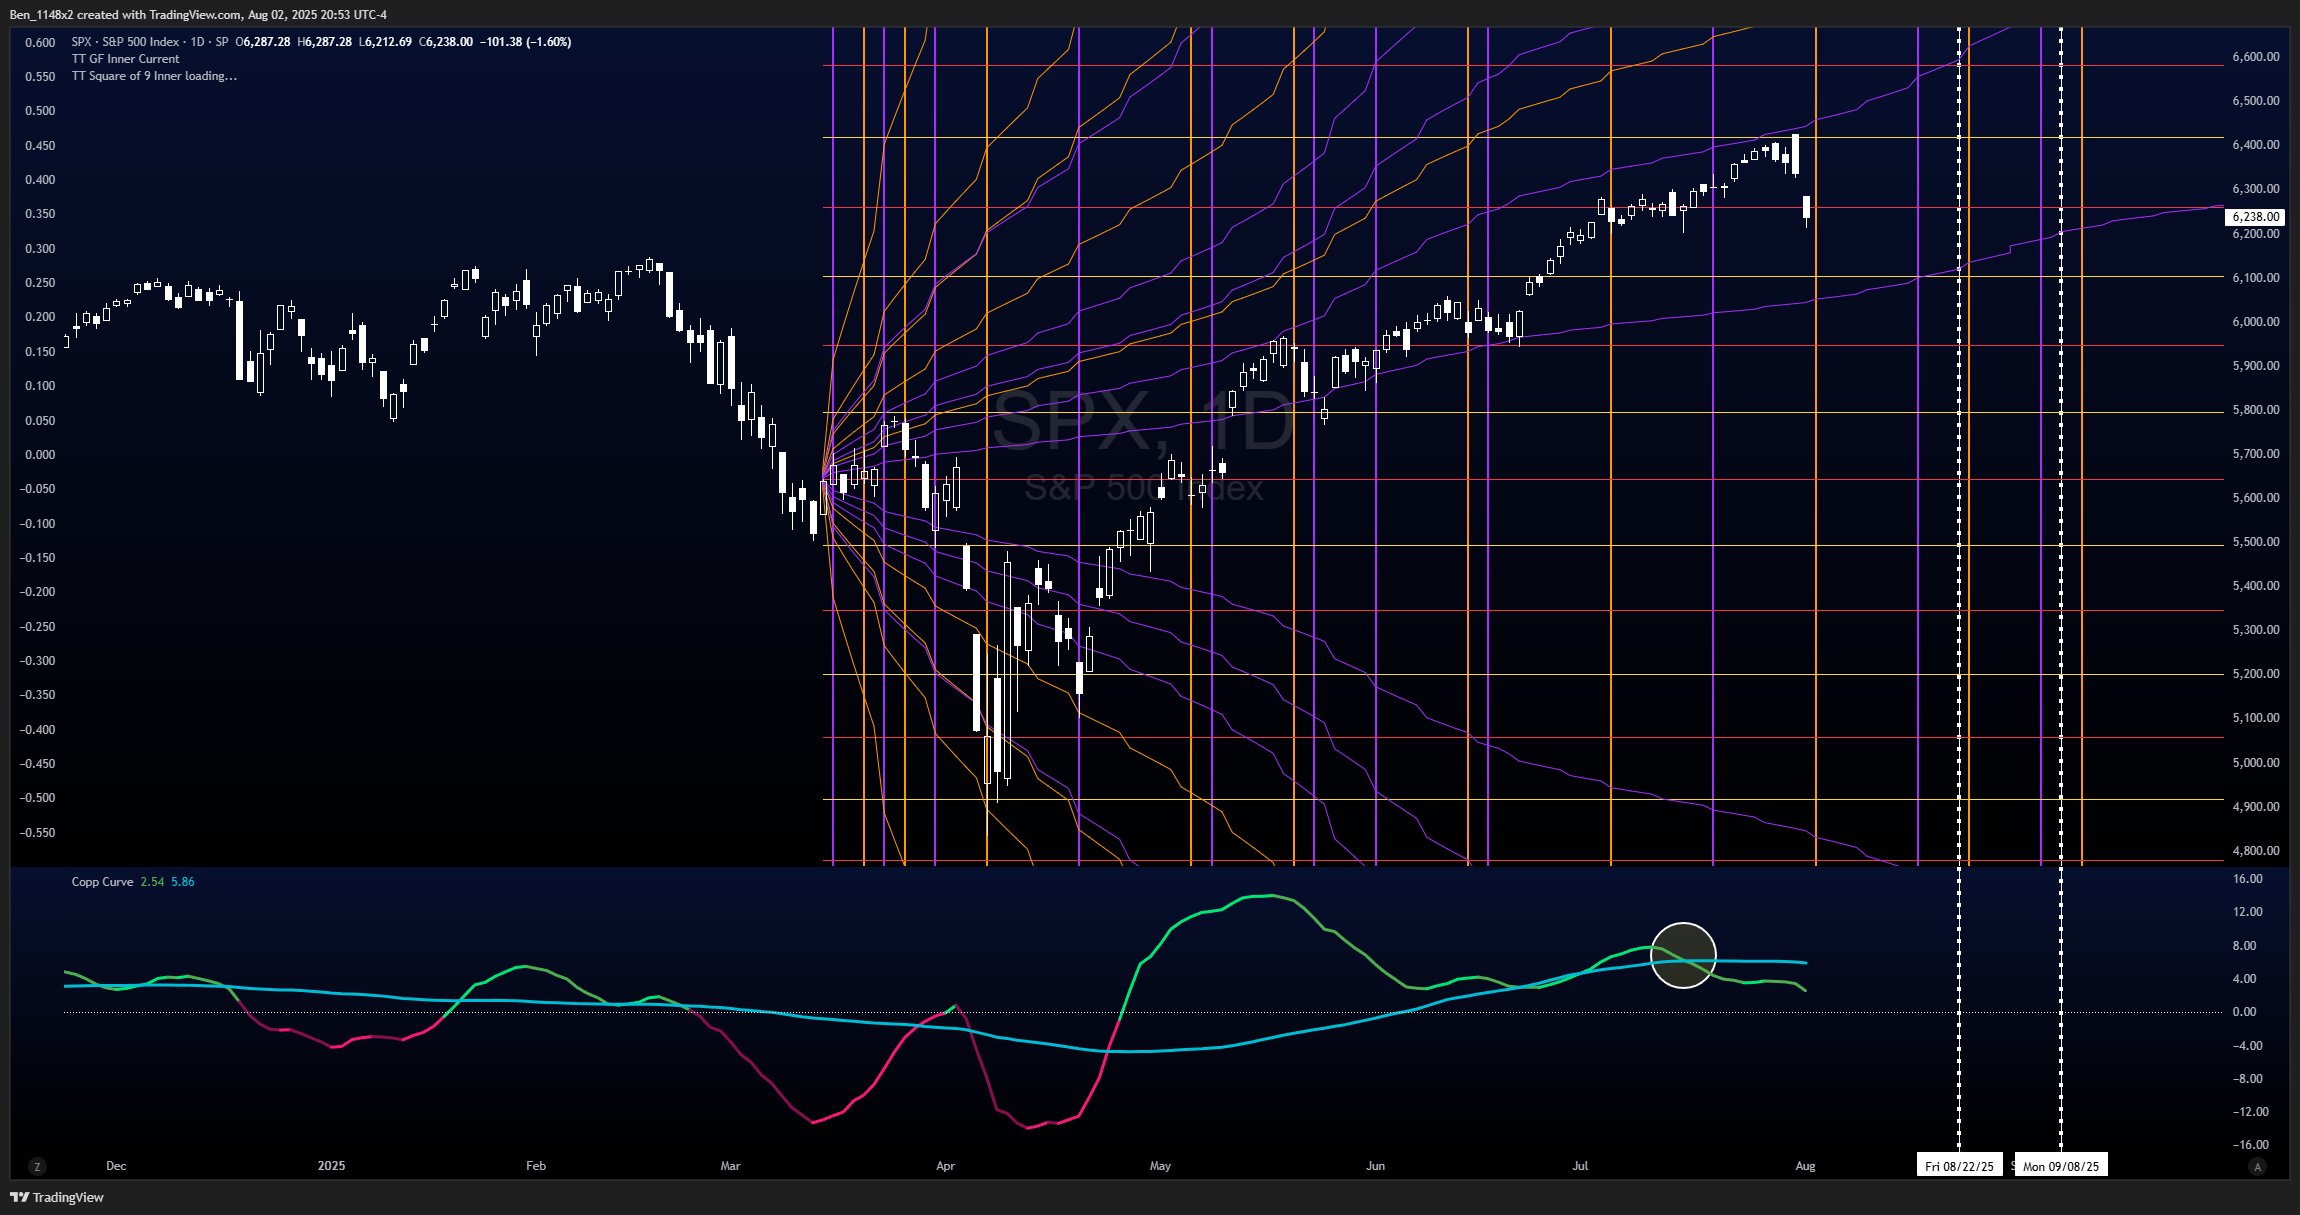
The Saturn retrograde was exactly 100 sessions from the prior high. Margo recommends using the closing price as an area of interest. This chart uses an anchored VWAP from that date and a planetary Gann fan. A proportional move below the AVWAP is ~6175. This would align to the 0.382 from the last momentum cross over and the time frames that align to angles in the Gann fan are 8/4 8/8 and 8/18. 8/4 and 8/18 are also dates of interest on the prior chart.
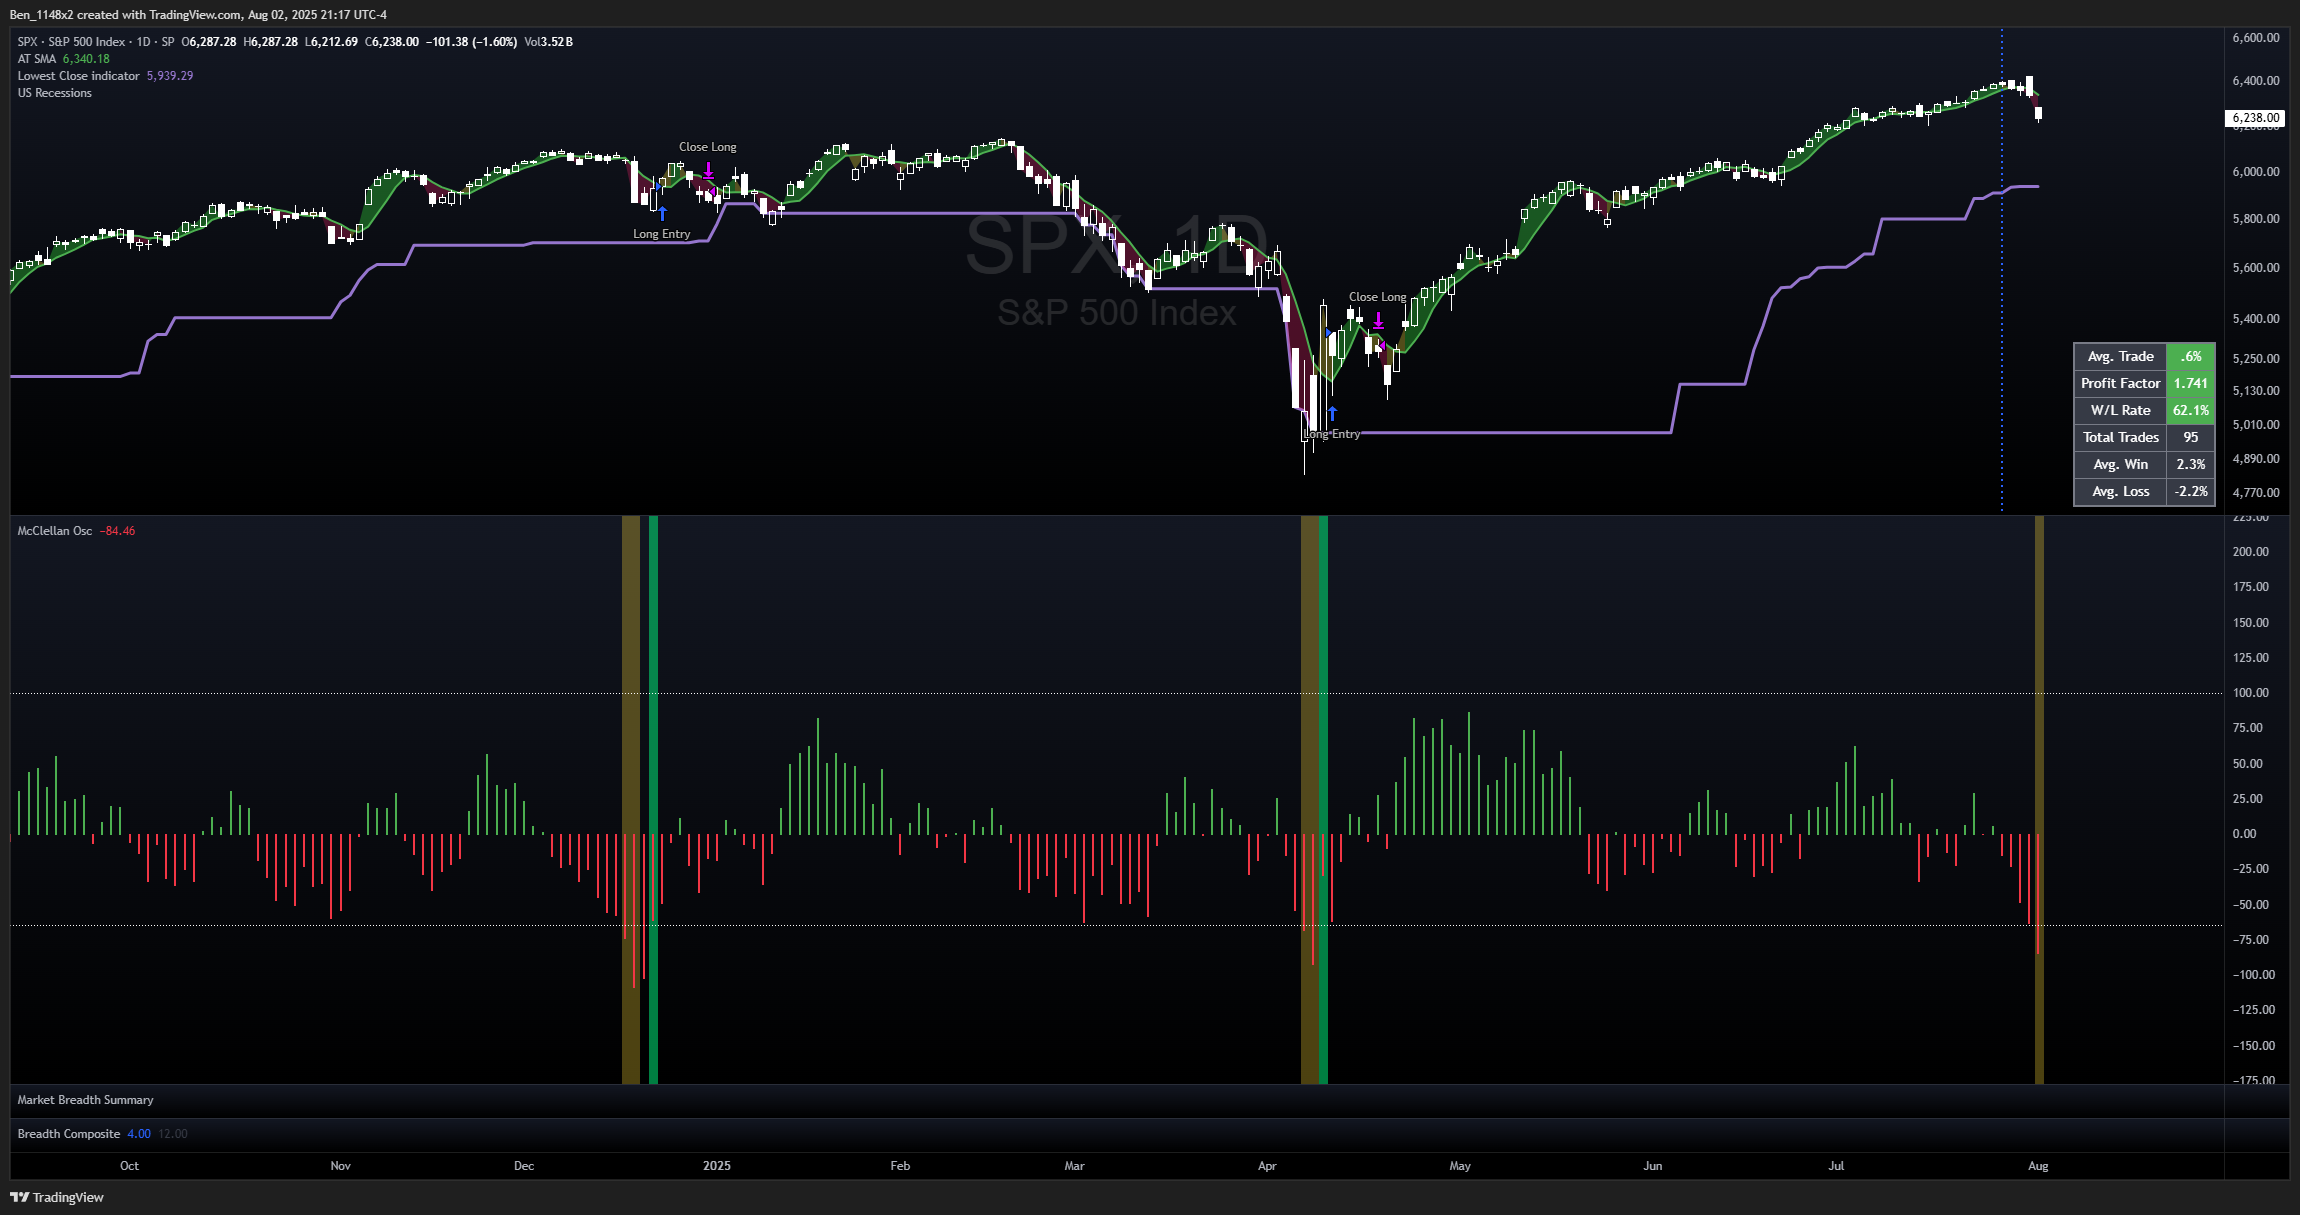
Tradeable breadth condition
We have a signal on the McClellan oscillator. When breadth falls below -65 we are in a more extreme selling situation. The short term trading strategy buys when it closes back above -65, then sells 5 trading days later.
BTC
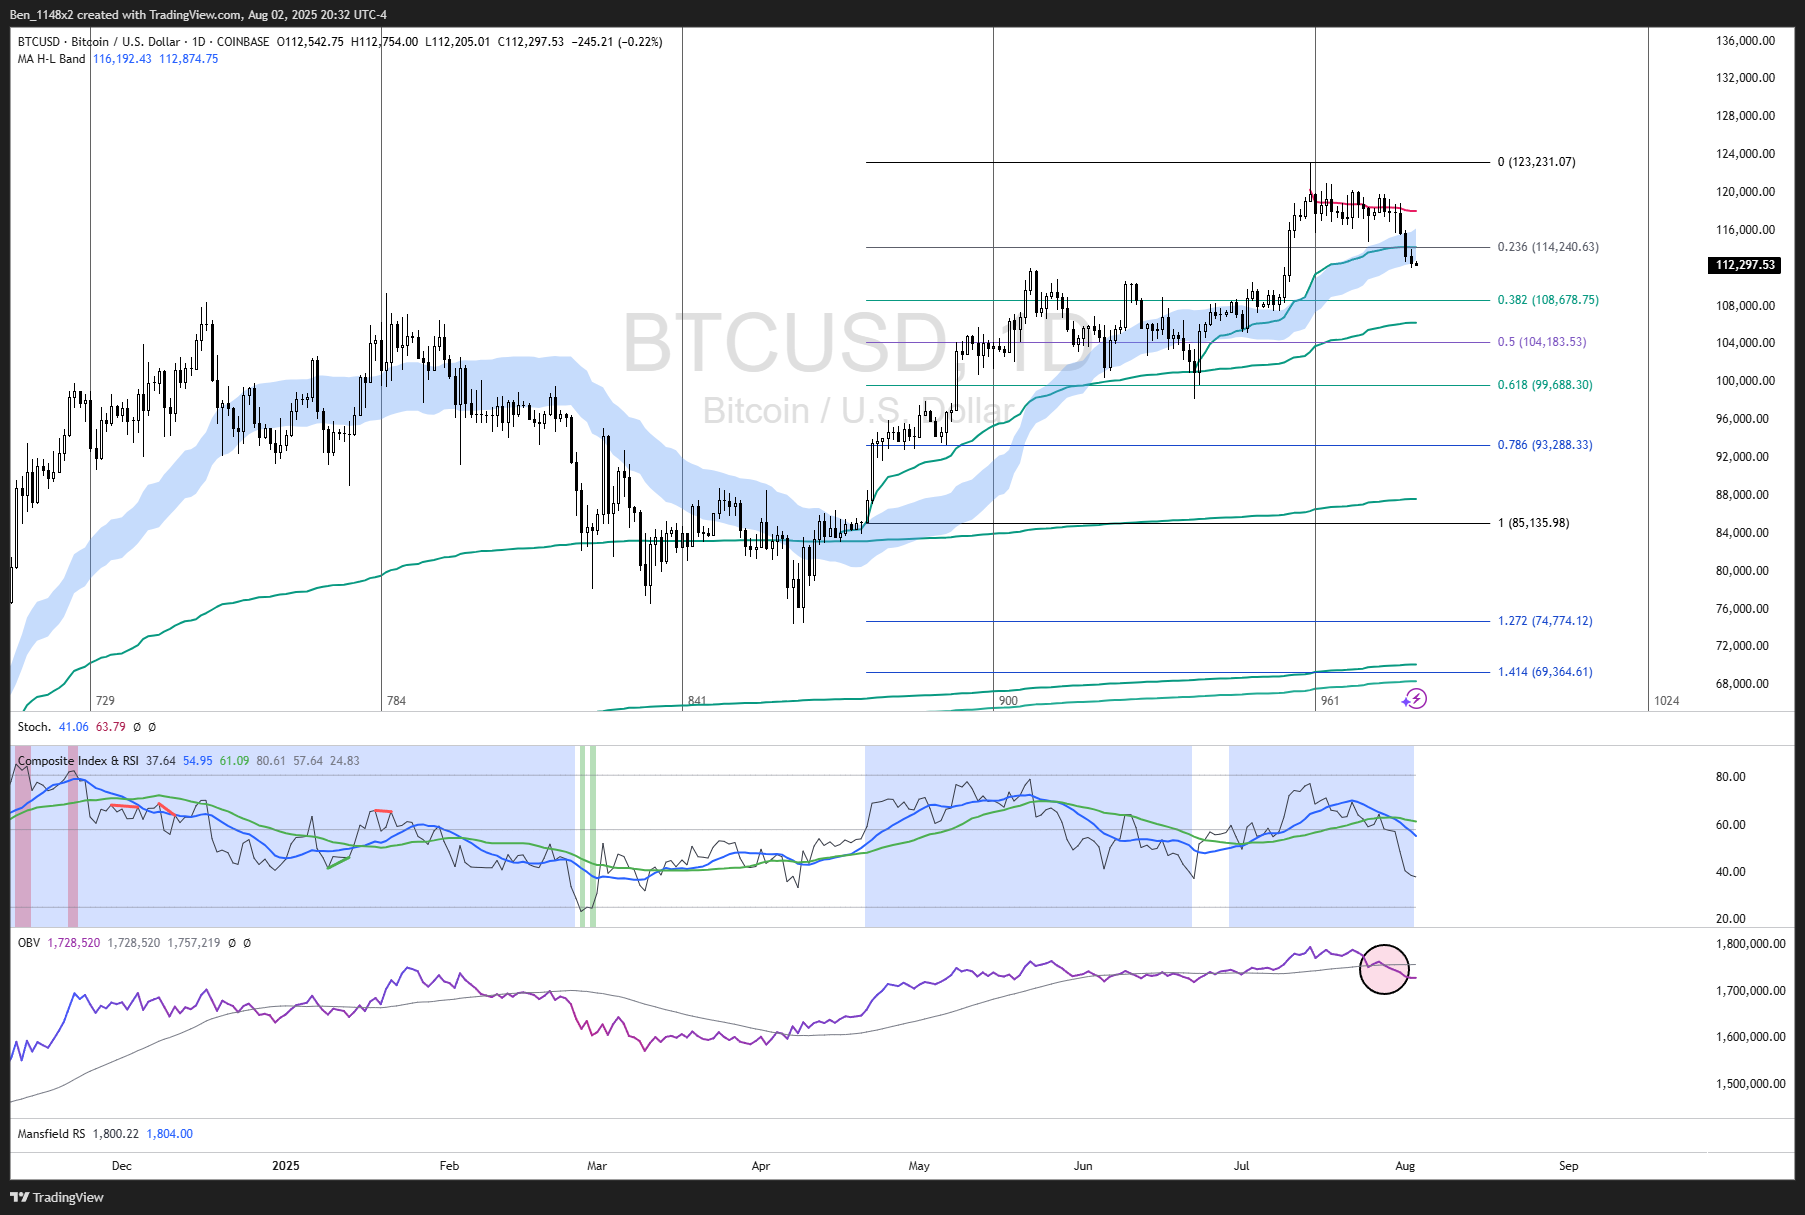
We have some risk on BTC. The AVWAP from the June low failed. On balance volume has rolled over. And the RSI is falling with declining moving averages. 108k is the next area of support using this chart.
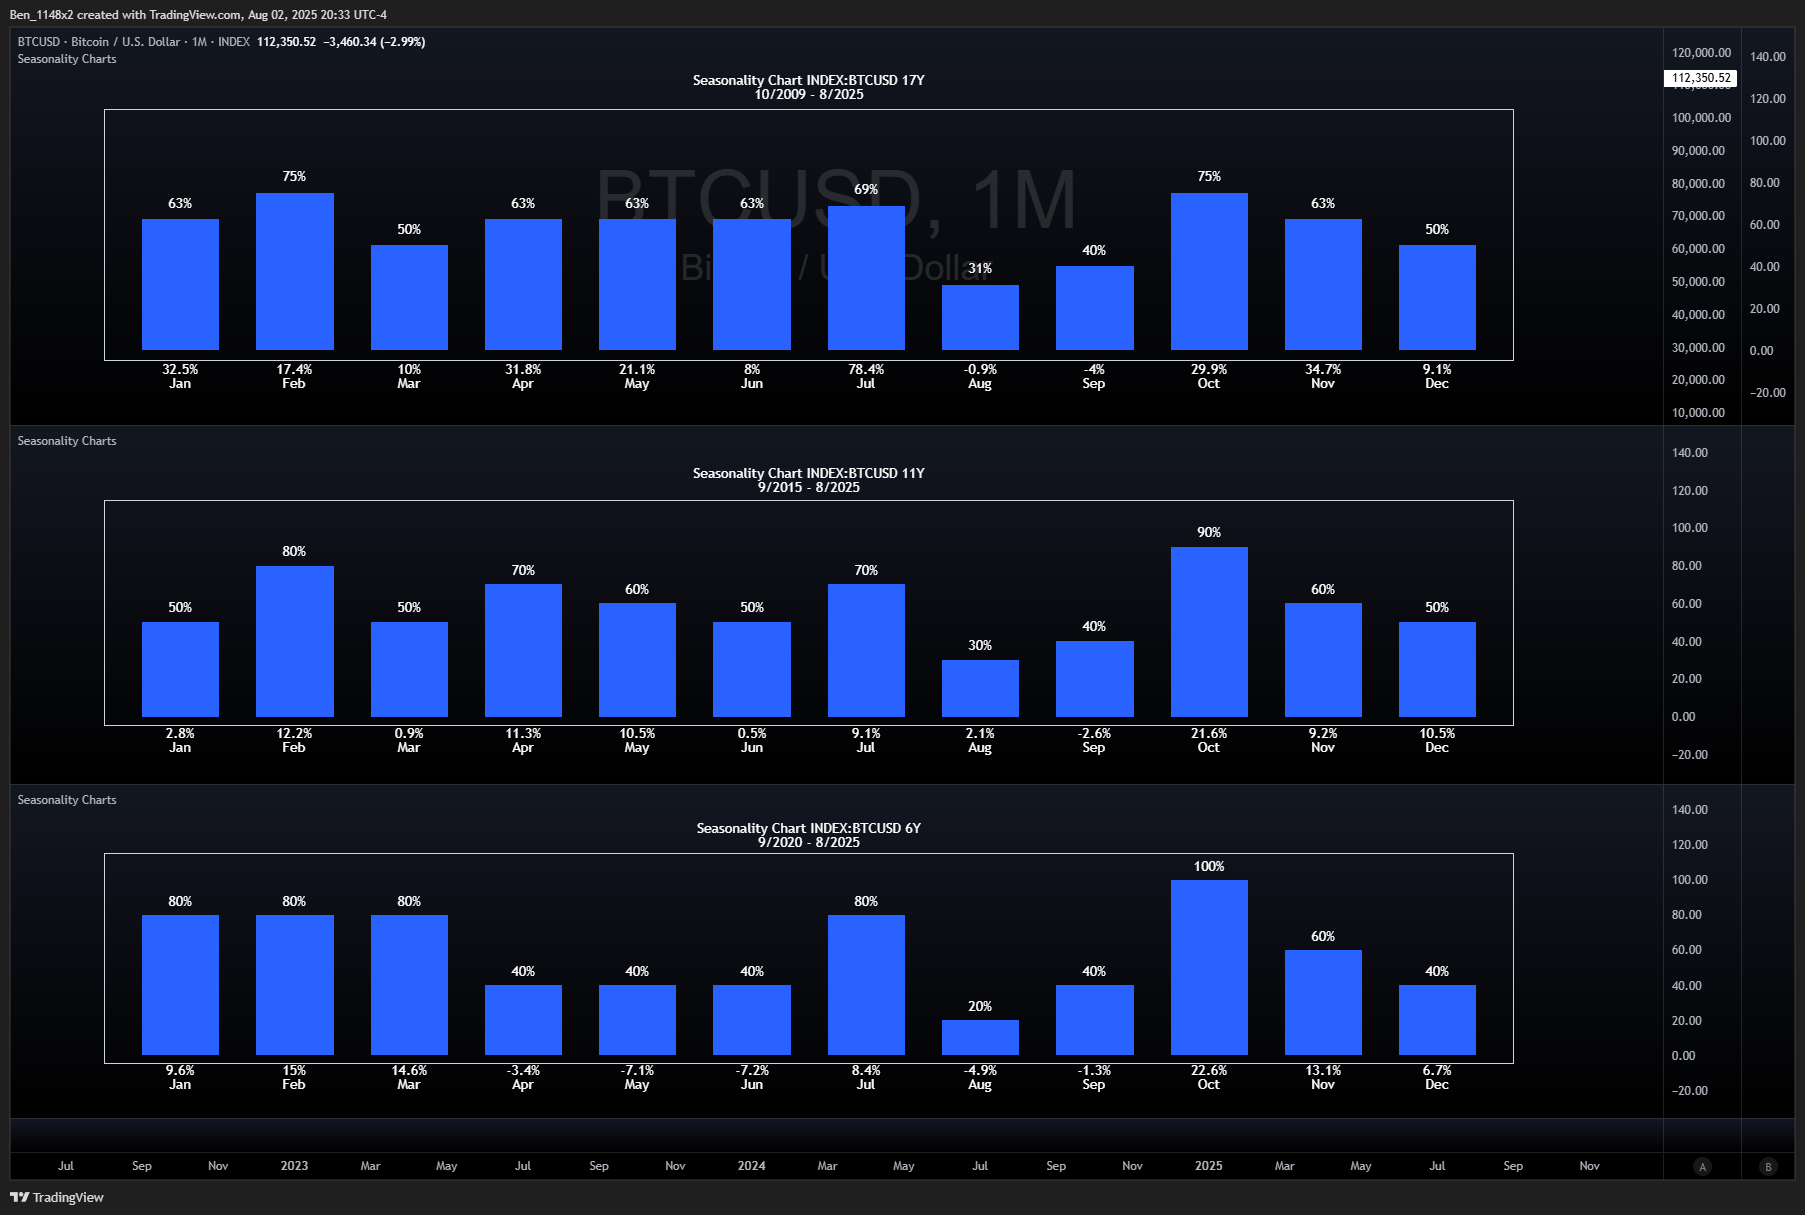
August and September are the worst months for BTC. This is when I normally make my purchases in my seasonal playbook. I will likely wait until September as we are getting some slightly mixed signals
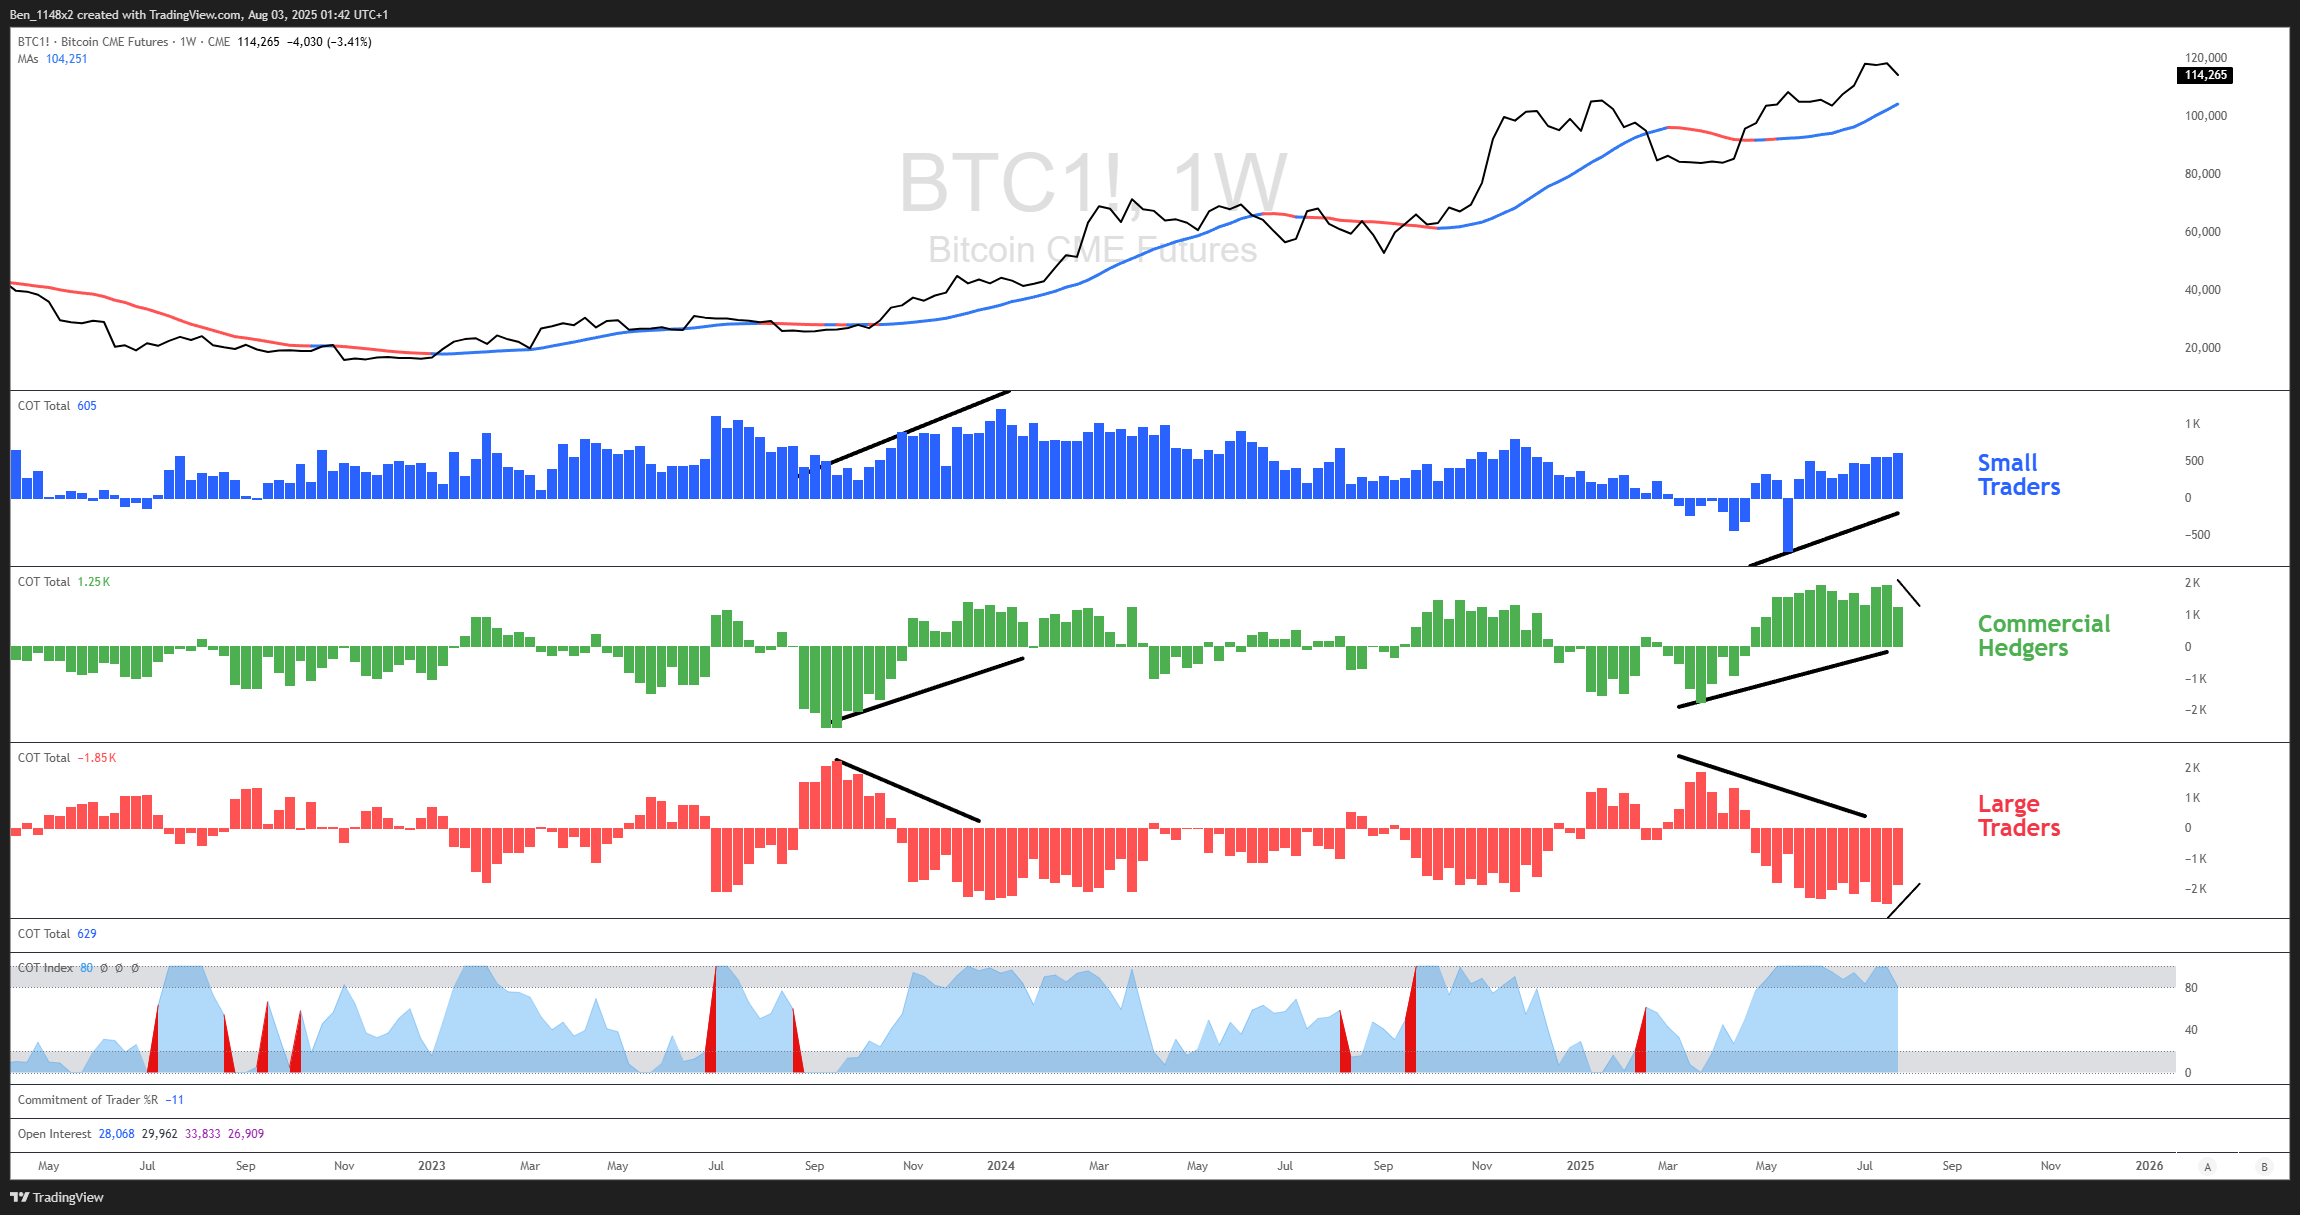
The commitment of traders report shows a slight shift. Small traders and commercial hedgers are typically on the right side of the trade for BTC, and large traders are generally losing. This is not what we see in most other assets. Large traders net short positions have reduced, as have commercial hedgers net longs. If this trend continues, BTC will head lower.
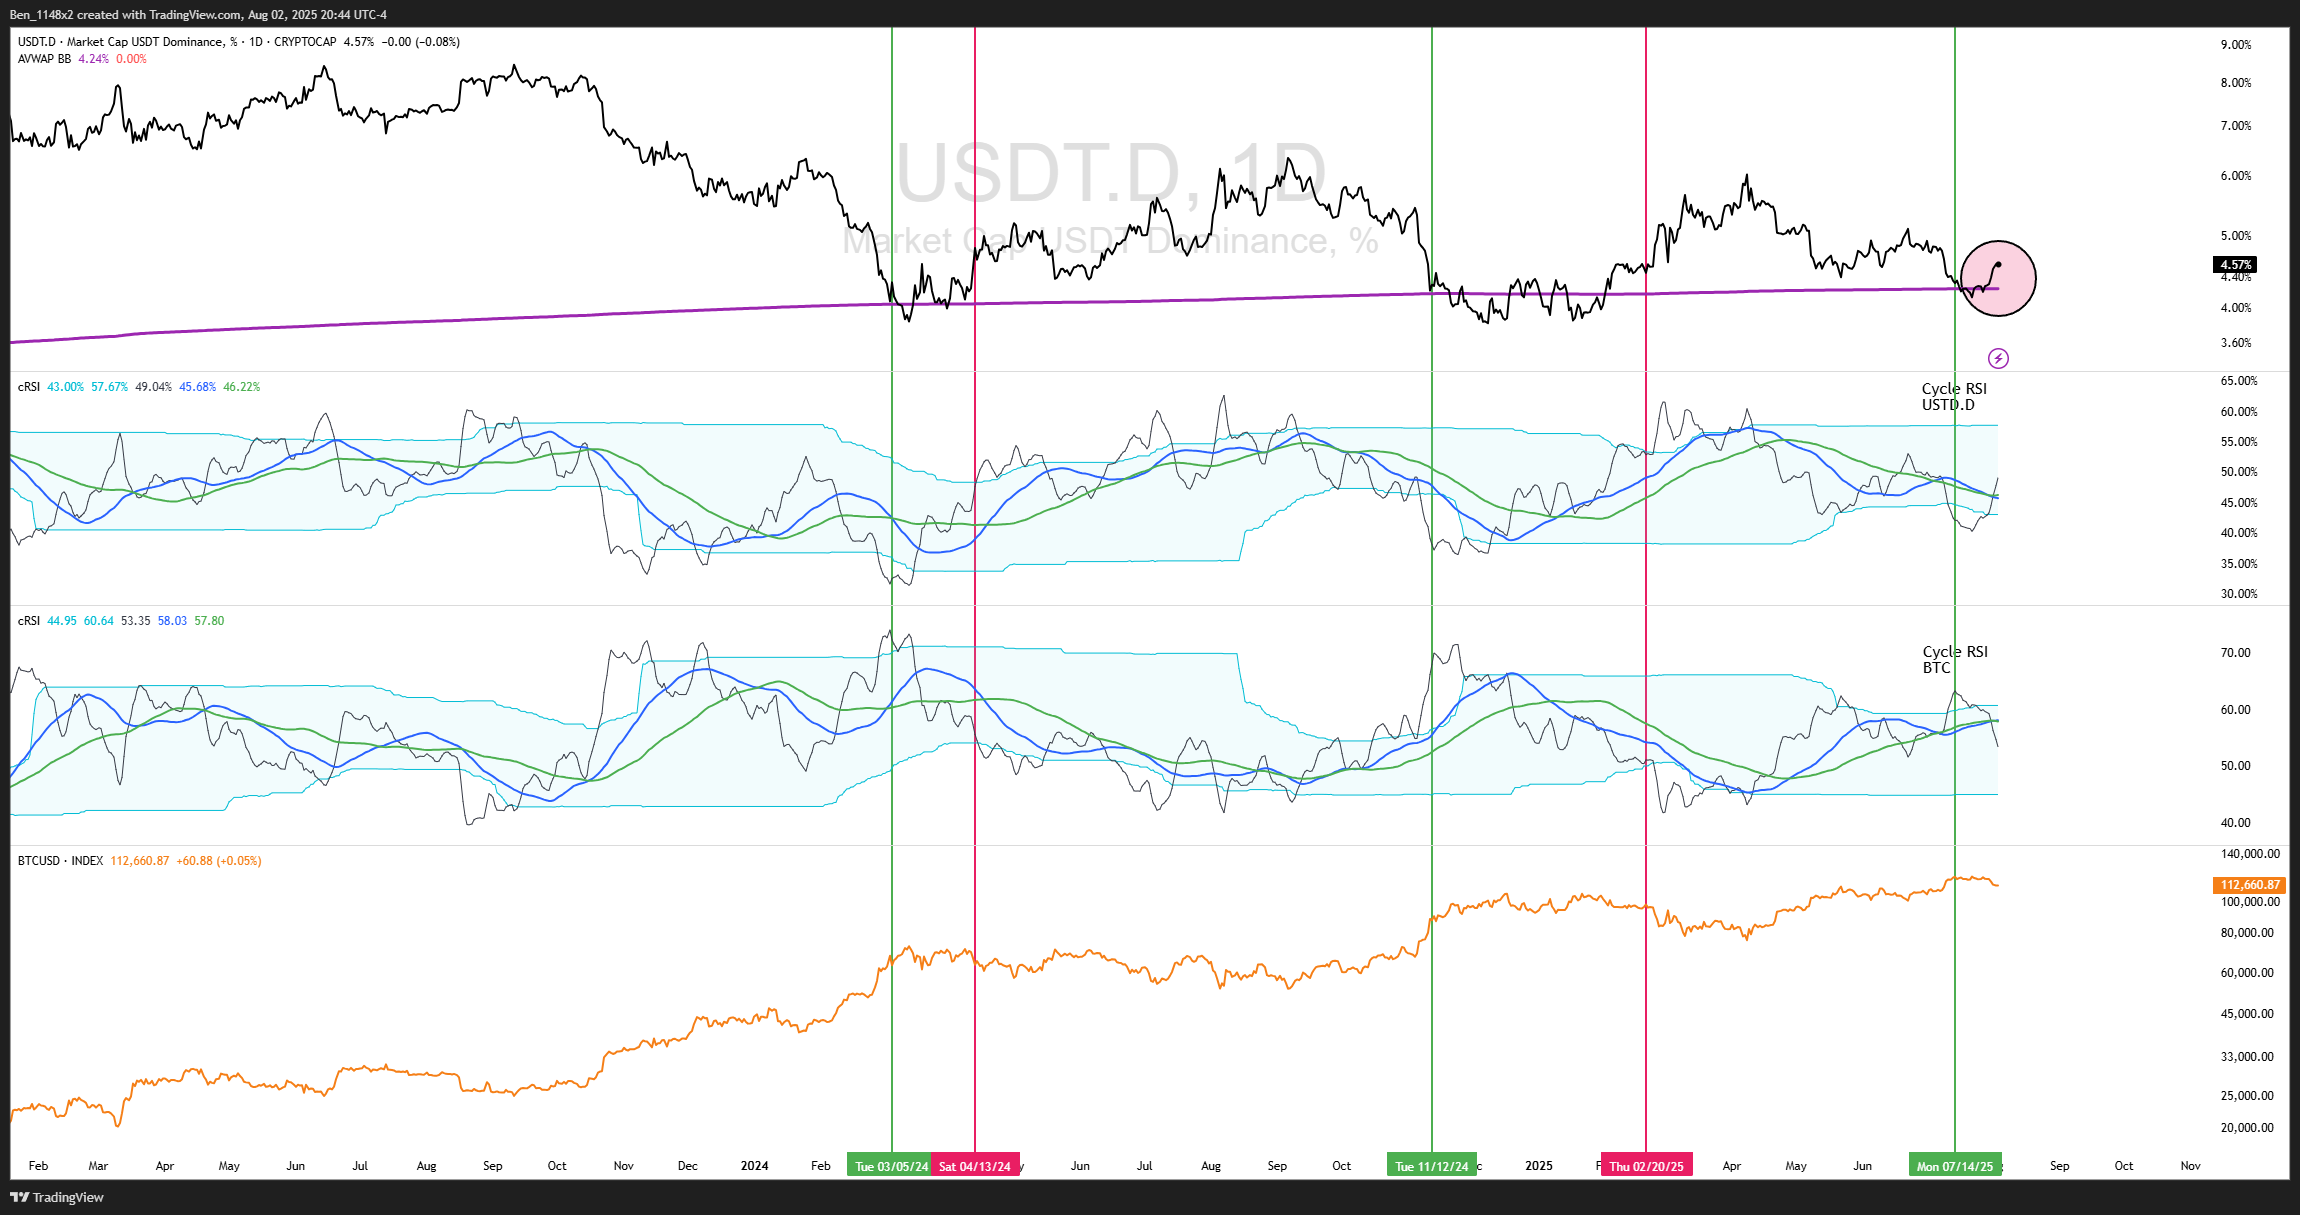
This uses the cycle RSI with USDT dominance versus BTC. When USDT is above the purple line we are at risk of BTC moving lower. If the USDT.D cycle RSI moves above its upper band it will confirm that BTC is moving into an extended consolidation or downtrend.
If you want to use this chart yourself, a version of the cRSI can be found here: Cycle RSI indicator
Set it to 84 for USDT.D and 83 for BTC.
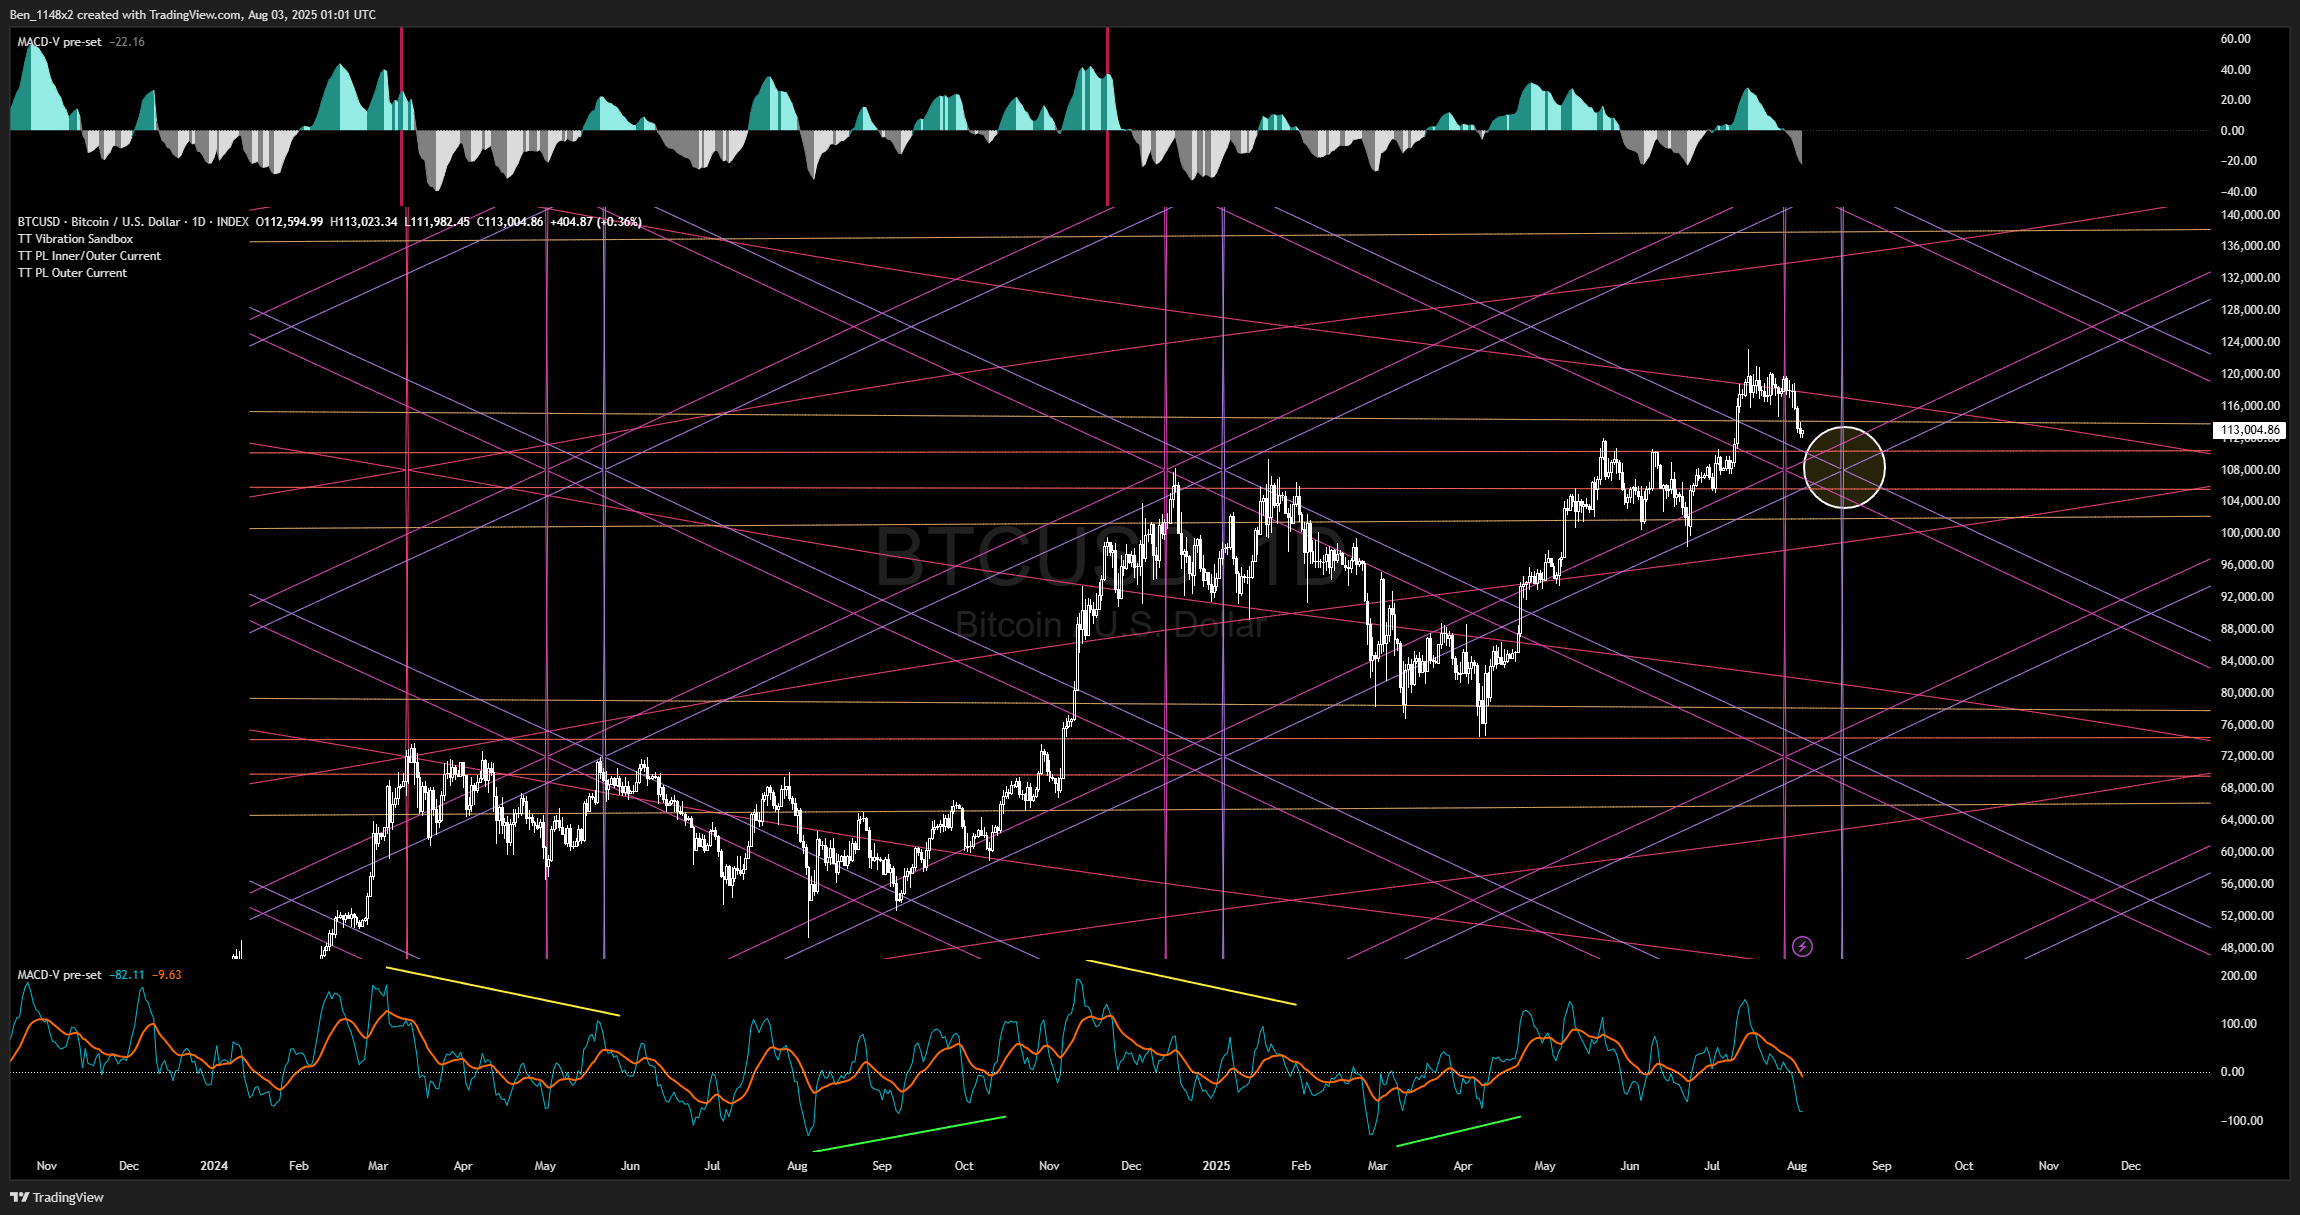
This planetary chart for BTC shows us open spaces between the diagonally angled planetary lines where BTC is more likely to experience steeper movements, versus the slower horizontal lines where we see it drawn into consolidation. Direction is confirmed with two configurations of the MACD. This move needs to settle before I attempt my seasonal buy.
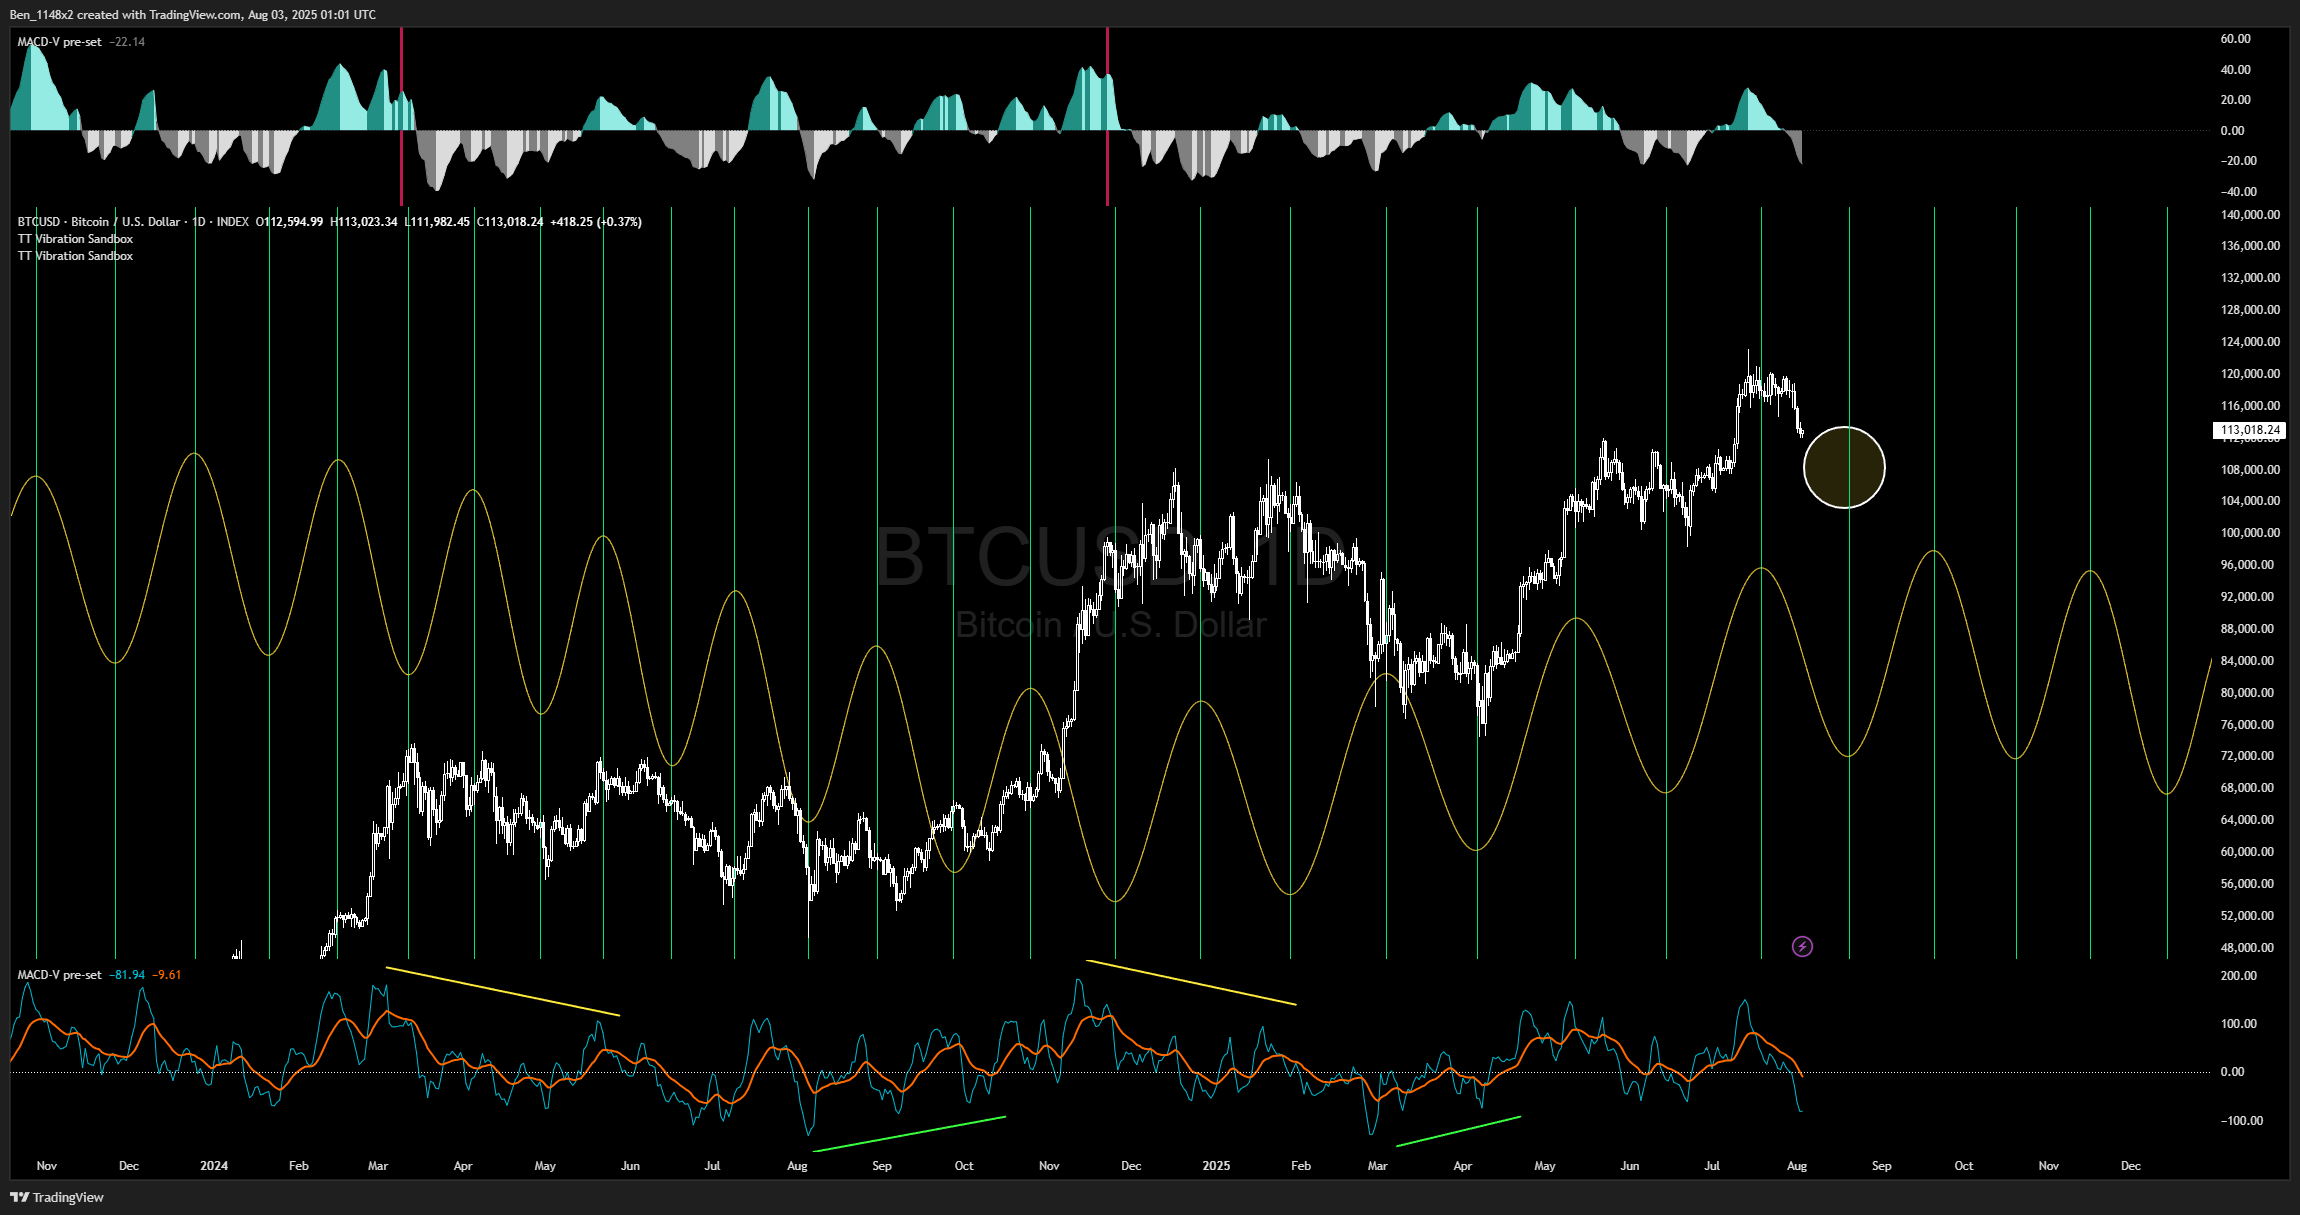
This iteration uses the updated Time Trades law of vibration. It anticipates a swing low into 8/20.
Gold
Small traders are backing off of their long positions, while commercial hedgers extend net short and large traders extend net long. This suggests the pullback in gold is over.
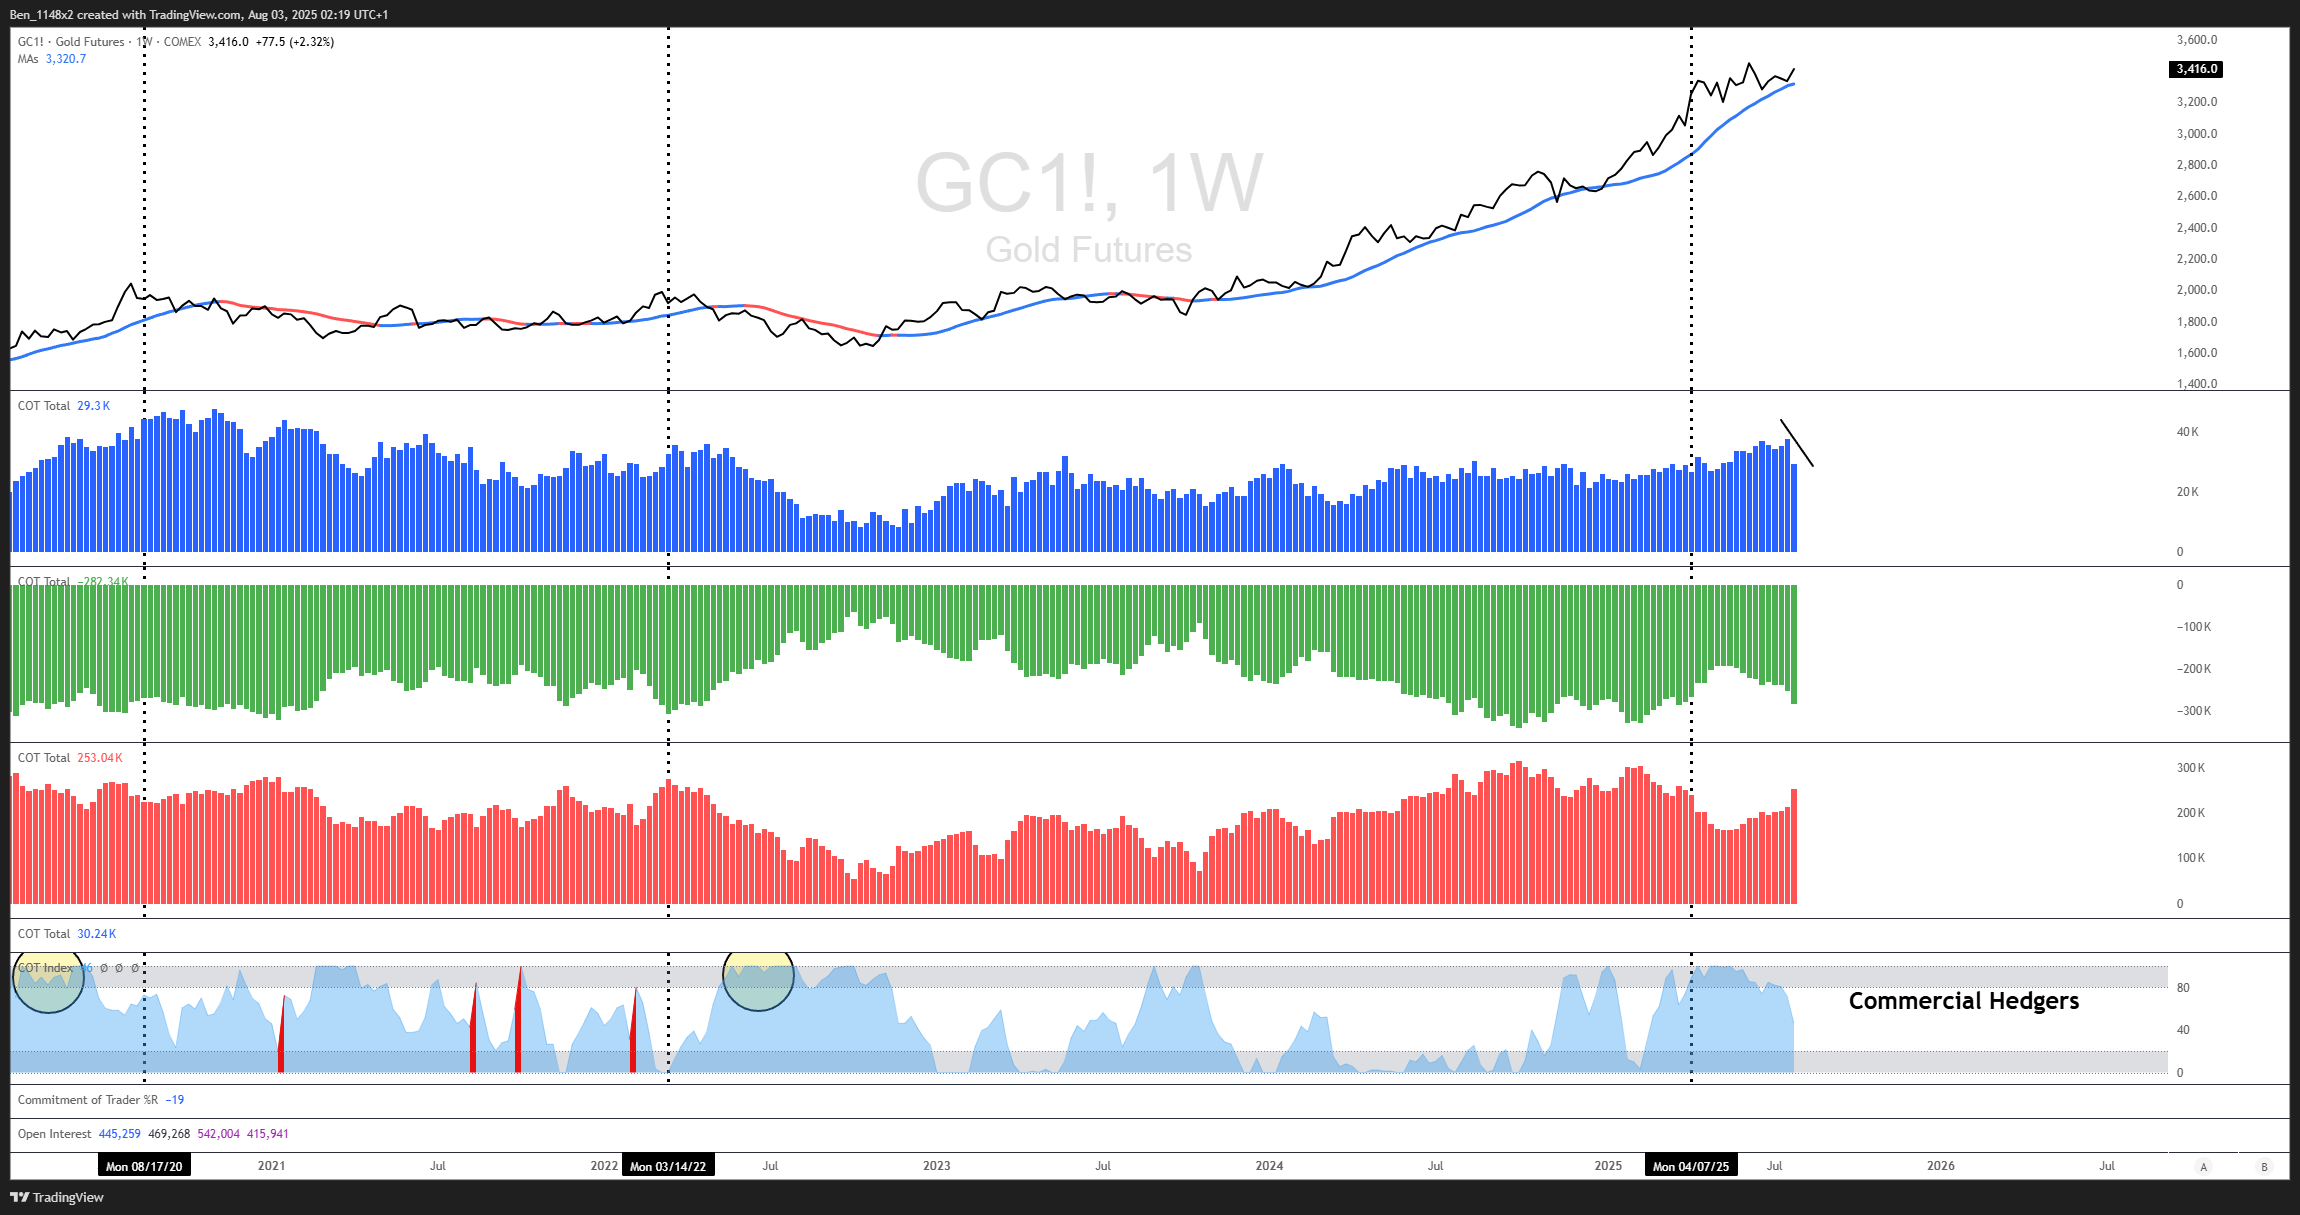
A break above 318 could take us to 340-355.
Commodities
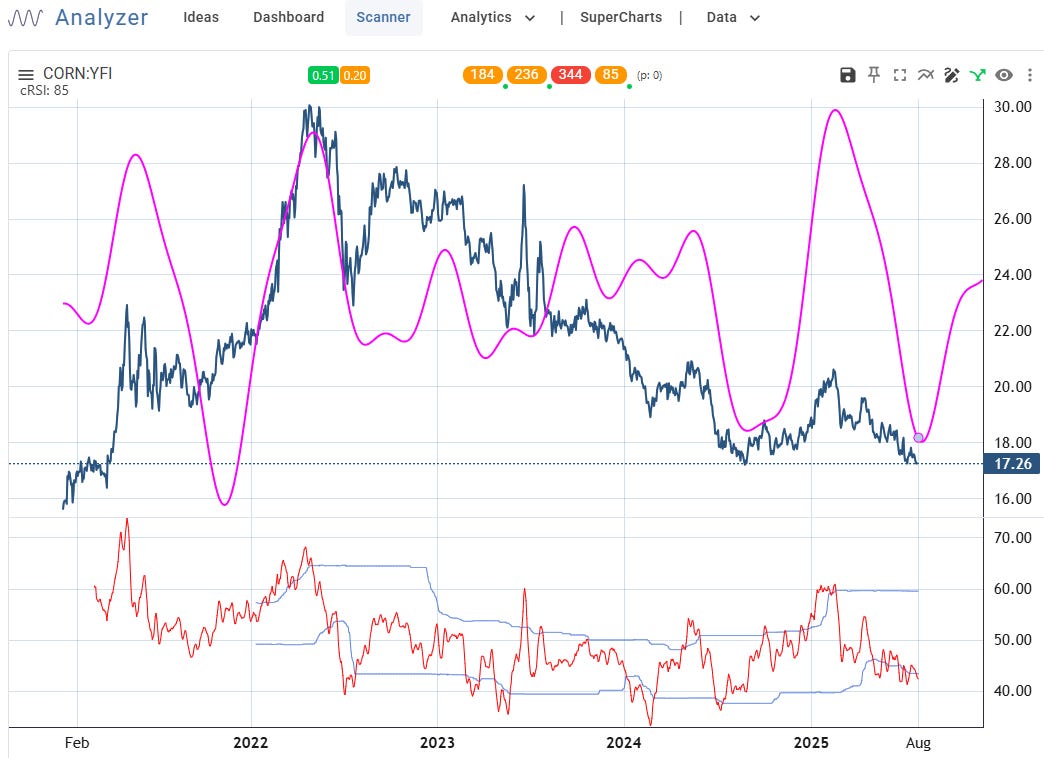
Strength in the dollar should put near term pressure on the run that the metals have had. I will let that settle out before re-accumulating. Keep an eye on sugar. The CANE ETF has suffered more than the other commodity themed ETFs and could be near a pivot low.
Copper met the range that we had forecast and then got killed. This was very unusual move, but it’s very important to take profits into these forecasted ranges.
Earnings
We have seen some very volatile reactions to earnings. This is something that we see in extended markets where participants are chasing and/or protecting profits. It is risky to hold short term positions through earnings. You’ll see an upcoming earnings date on the lower left of my charts now. Red indicates that we are within 15 sessions of earnings.
This week I’ll be watching PLTR DASH AMD HIMS CAT VRTX ETN UBER DUOL MCD JOBY NVO LLY COP TTD FUBO RKLB SOUN KTOS SHOP and FTNT.

Individual Opportunities
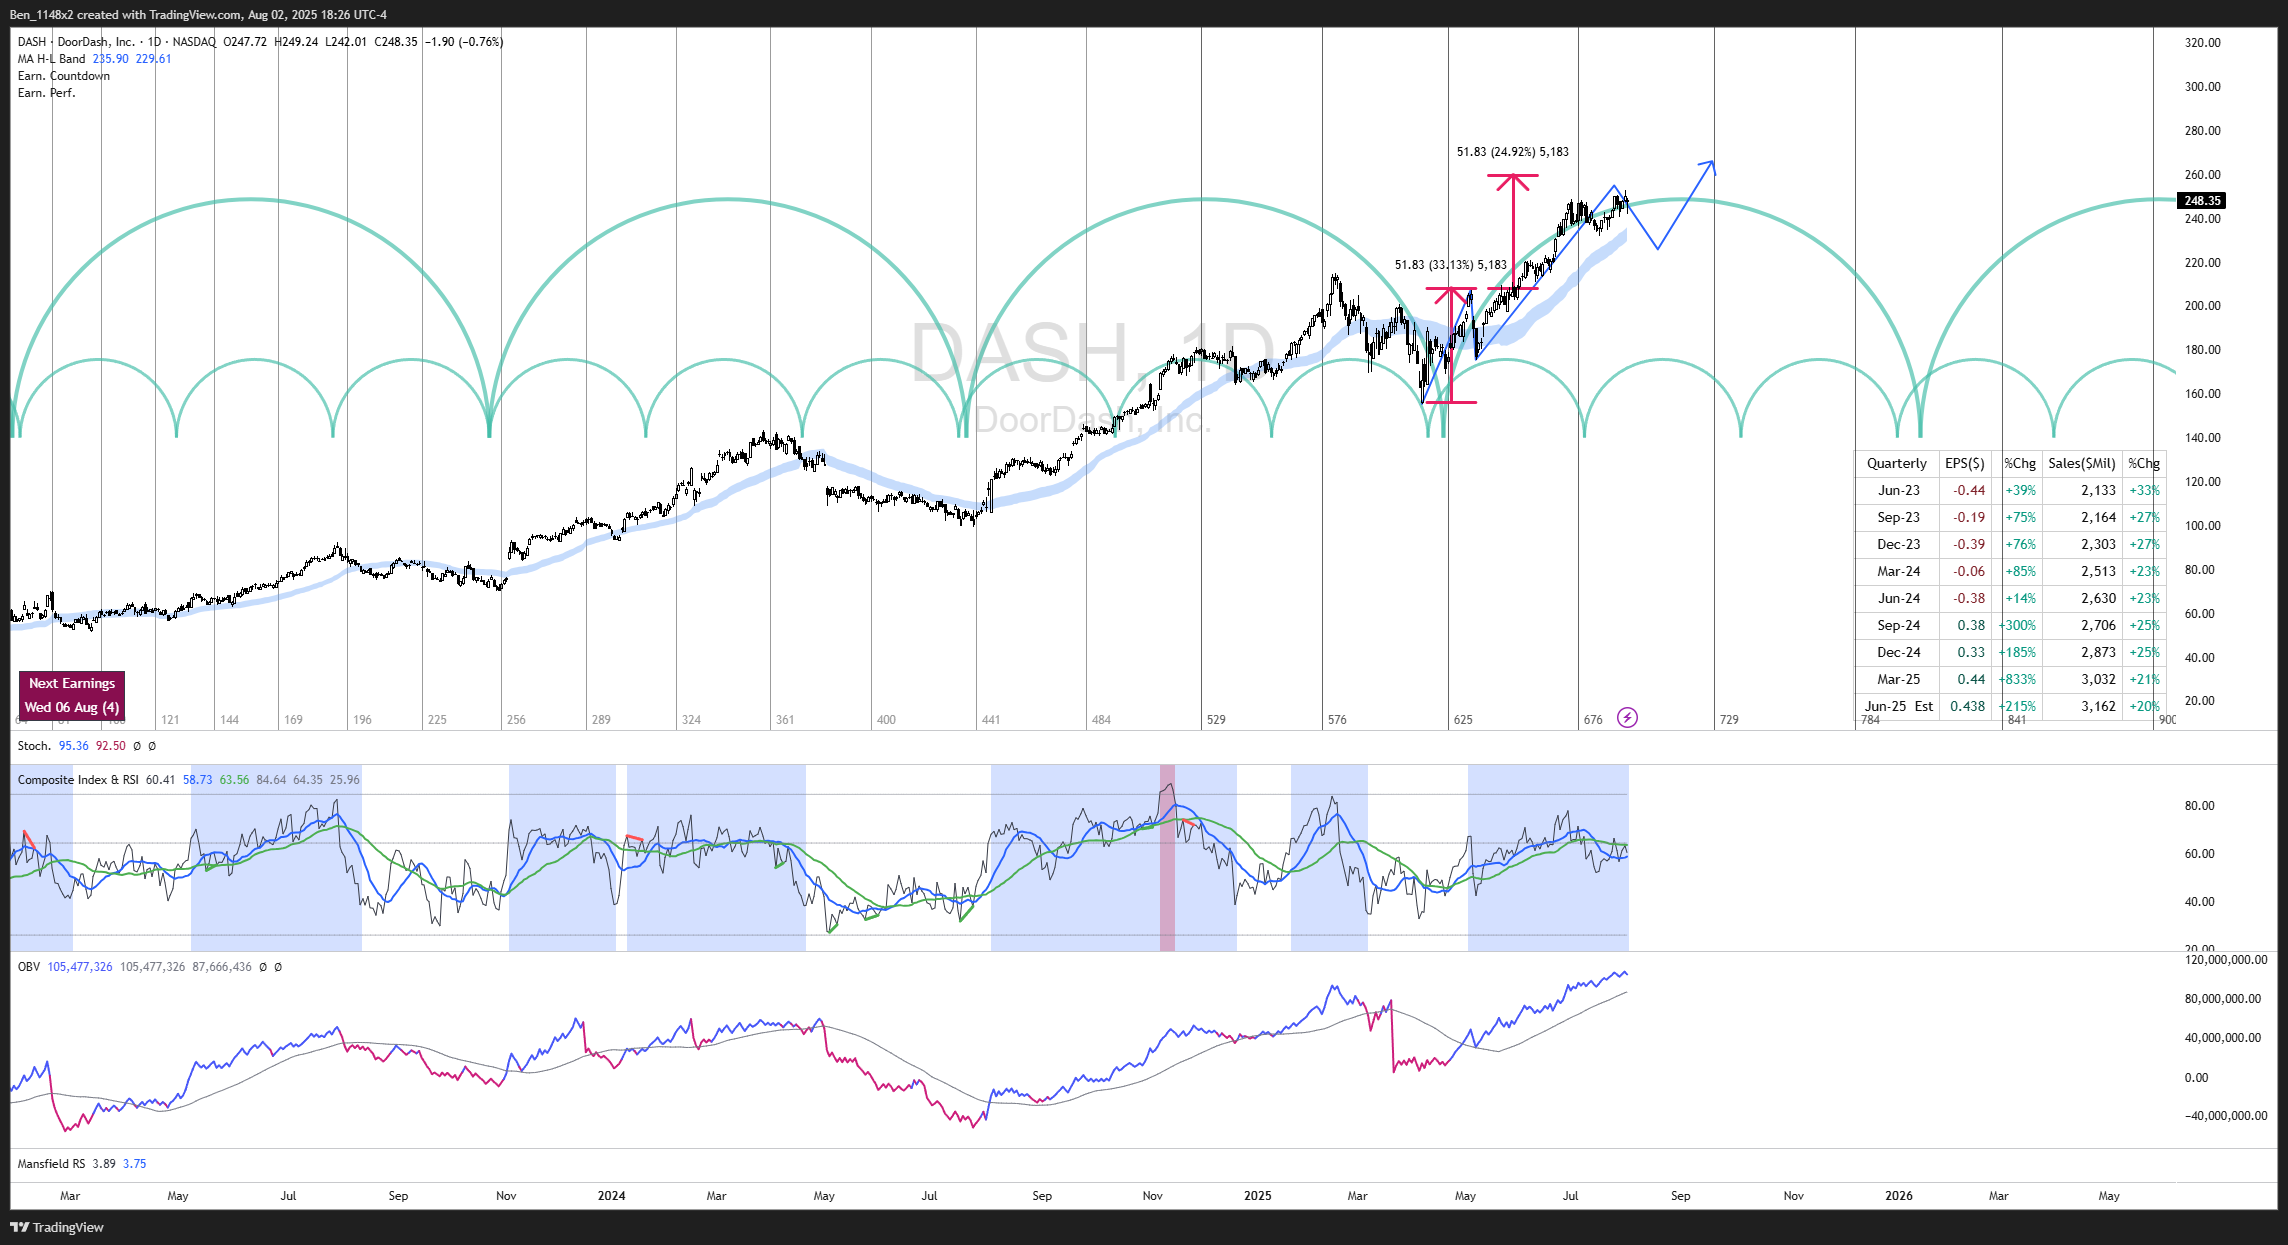
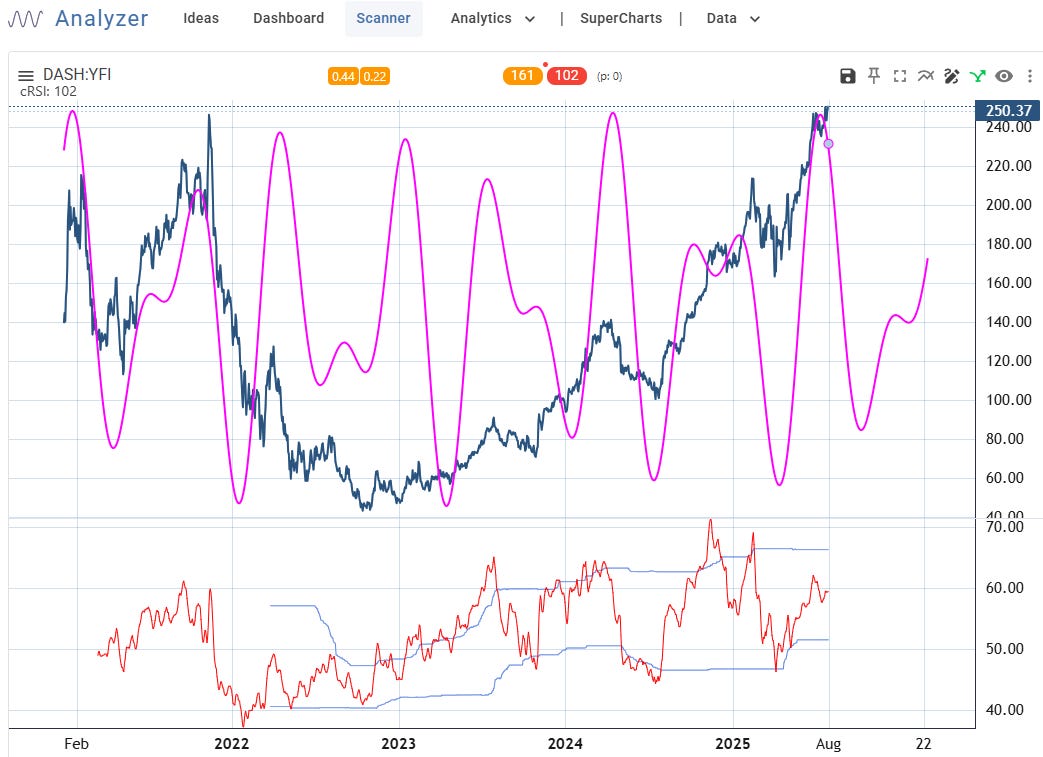
DASH
Doordash is likely in wave 5 up with a target between 260-265. They have earnings this week and a strong earnings track record. Don’t forget that we’ve seen wild swings up and down on earnings results this quarter.
A retest of the 213 to 230 area is where I will look to add to my position.
V
Visa looks like could correct to 315-320.
EQR
EQR is in strong distribution.
LLY
LLY has failed to reclaim the AVWAPs from recent highs, but on balance volume remains in accumulation. This weeks earnings will be critical. any bad news on the heels of NVO lowering its guidance will be punished by the market. Despite already having a very large position, I am a buyer if the scenario with the blue line plays out.
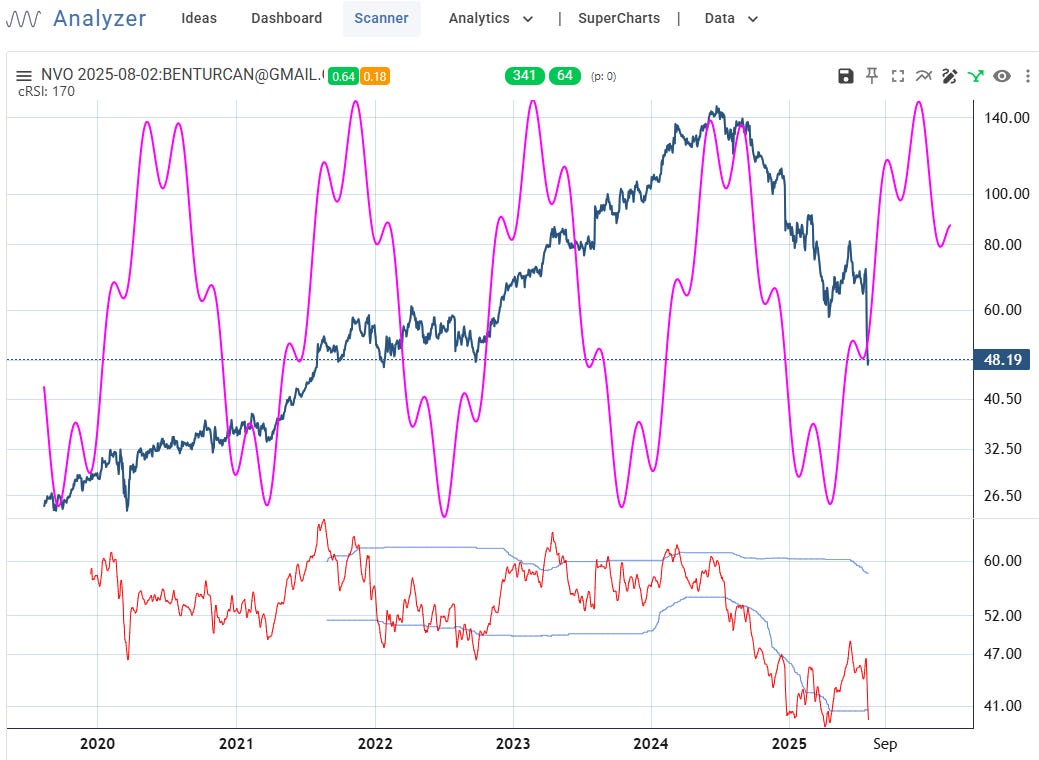
NVO
We have strongly oversold conditions on the pre-announcement of NVO’s leadership change and reduced guidance. This weeks earnings should offer clarity that the market needs, but a recovery from here is likely slow.
The cycle analyzer anticipates a pivot.
BE
I like BE if we see a successful test of the $30 area.
MO
MO’s break above 62 implies continuation to 65-66.
PLTR
PLTR looks like a completed 5 waves up. A correction could revisit 136.
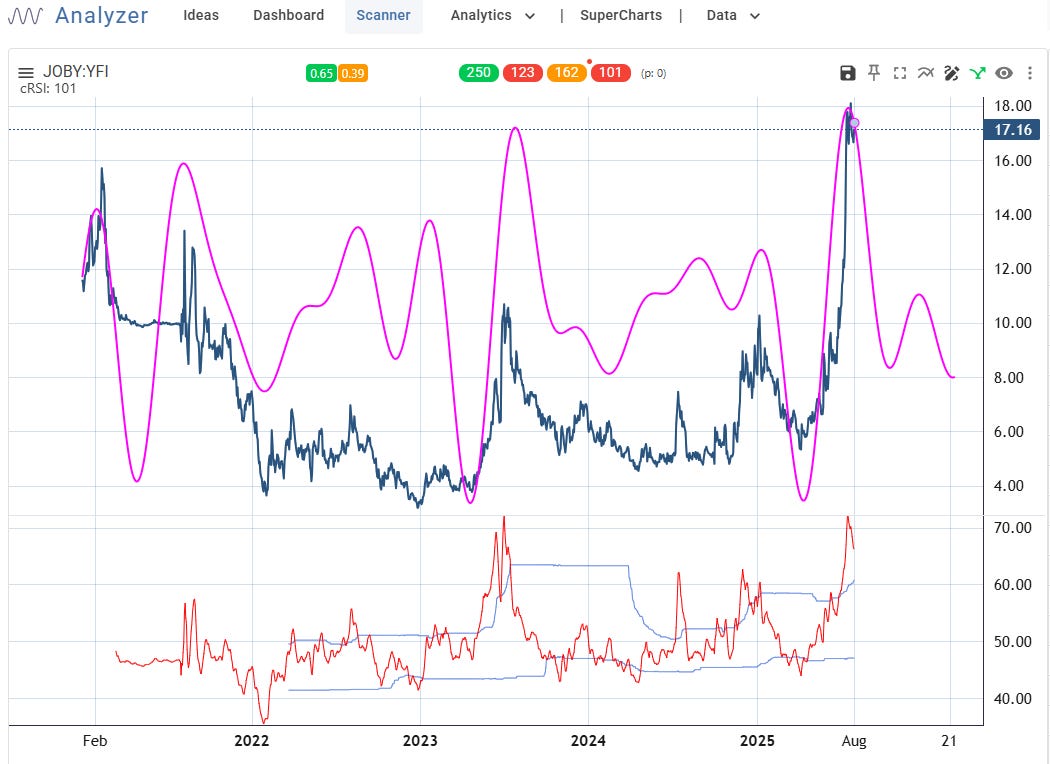
JOBY
Does it feel like we’re seeing a pattern repeat?
Buying & Selling Climaxes
Buying climaxes are screened by looking for assets with a recent 12 month high followed by a weekly reversal. Selling climaxes are screened by looking for assets that have a recent 12 month low and a weekly reversal. We need to be very disciplined with reversal patterns. I close them quickly and with small losses if they aren’t working.
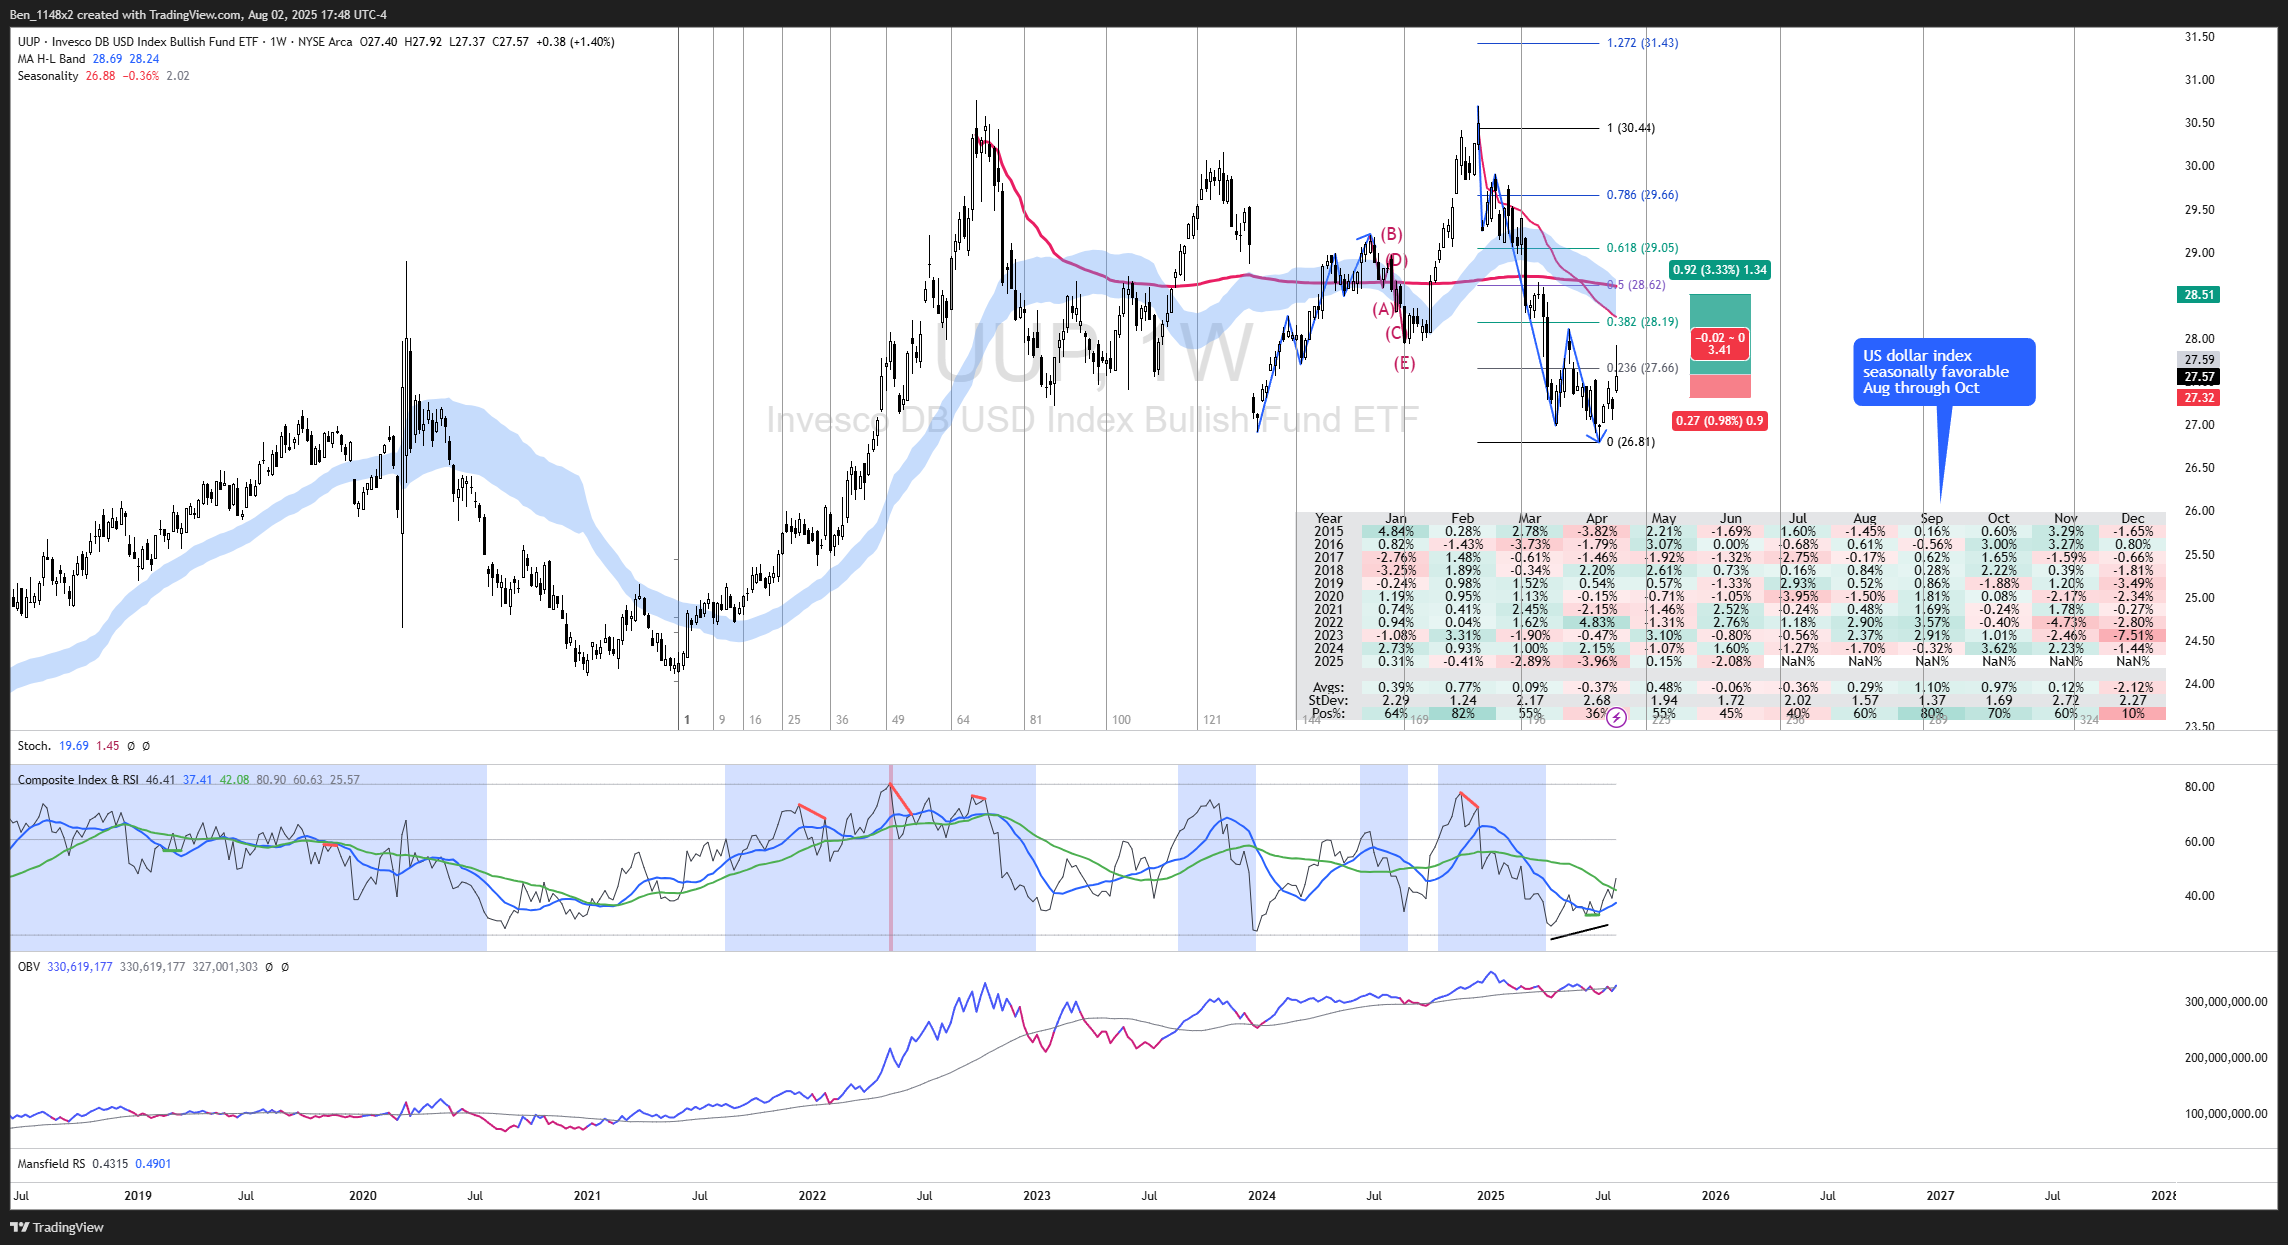
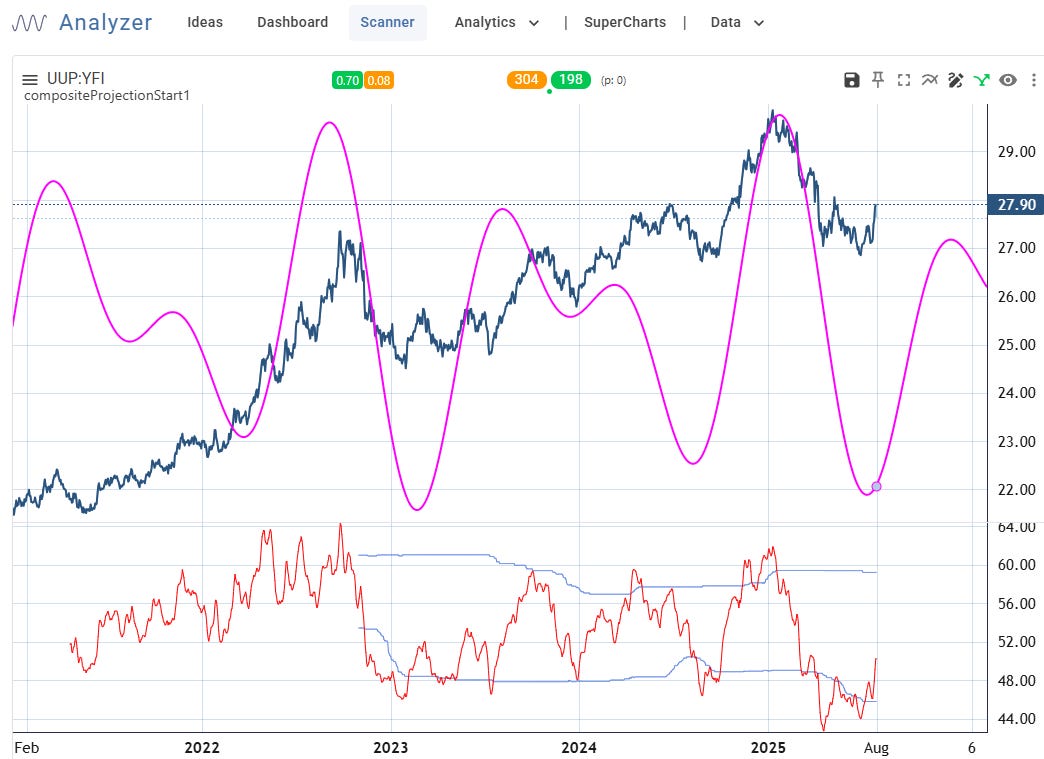
UUP - selling climax
DXY is bouncing from multiyear lows. UUP is the long US dollar ETF. Recall what we said earlier about the impact on the USD when the treasury general account is refilled.
Note that it goes into a strong seasonal period, but that the forecasted range makes this a relatively small trade opportunity.
Another way to play this with a higher return is with an options trade. Remember, I never make recommendations for others. REMINDER: I use this substack as an open journal of my thoughts on the market, things that I am interested in over time, and opportunities that I may or may not pursue.
I am looking at the 9/19 $29 UUP calls for 0.30. I will sell 2/3 at a 50% profit and hold the rest. I will let the options expire worthless if the opportunity fails, so I always size this type of strategy with funds that I am comfortable losing.
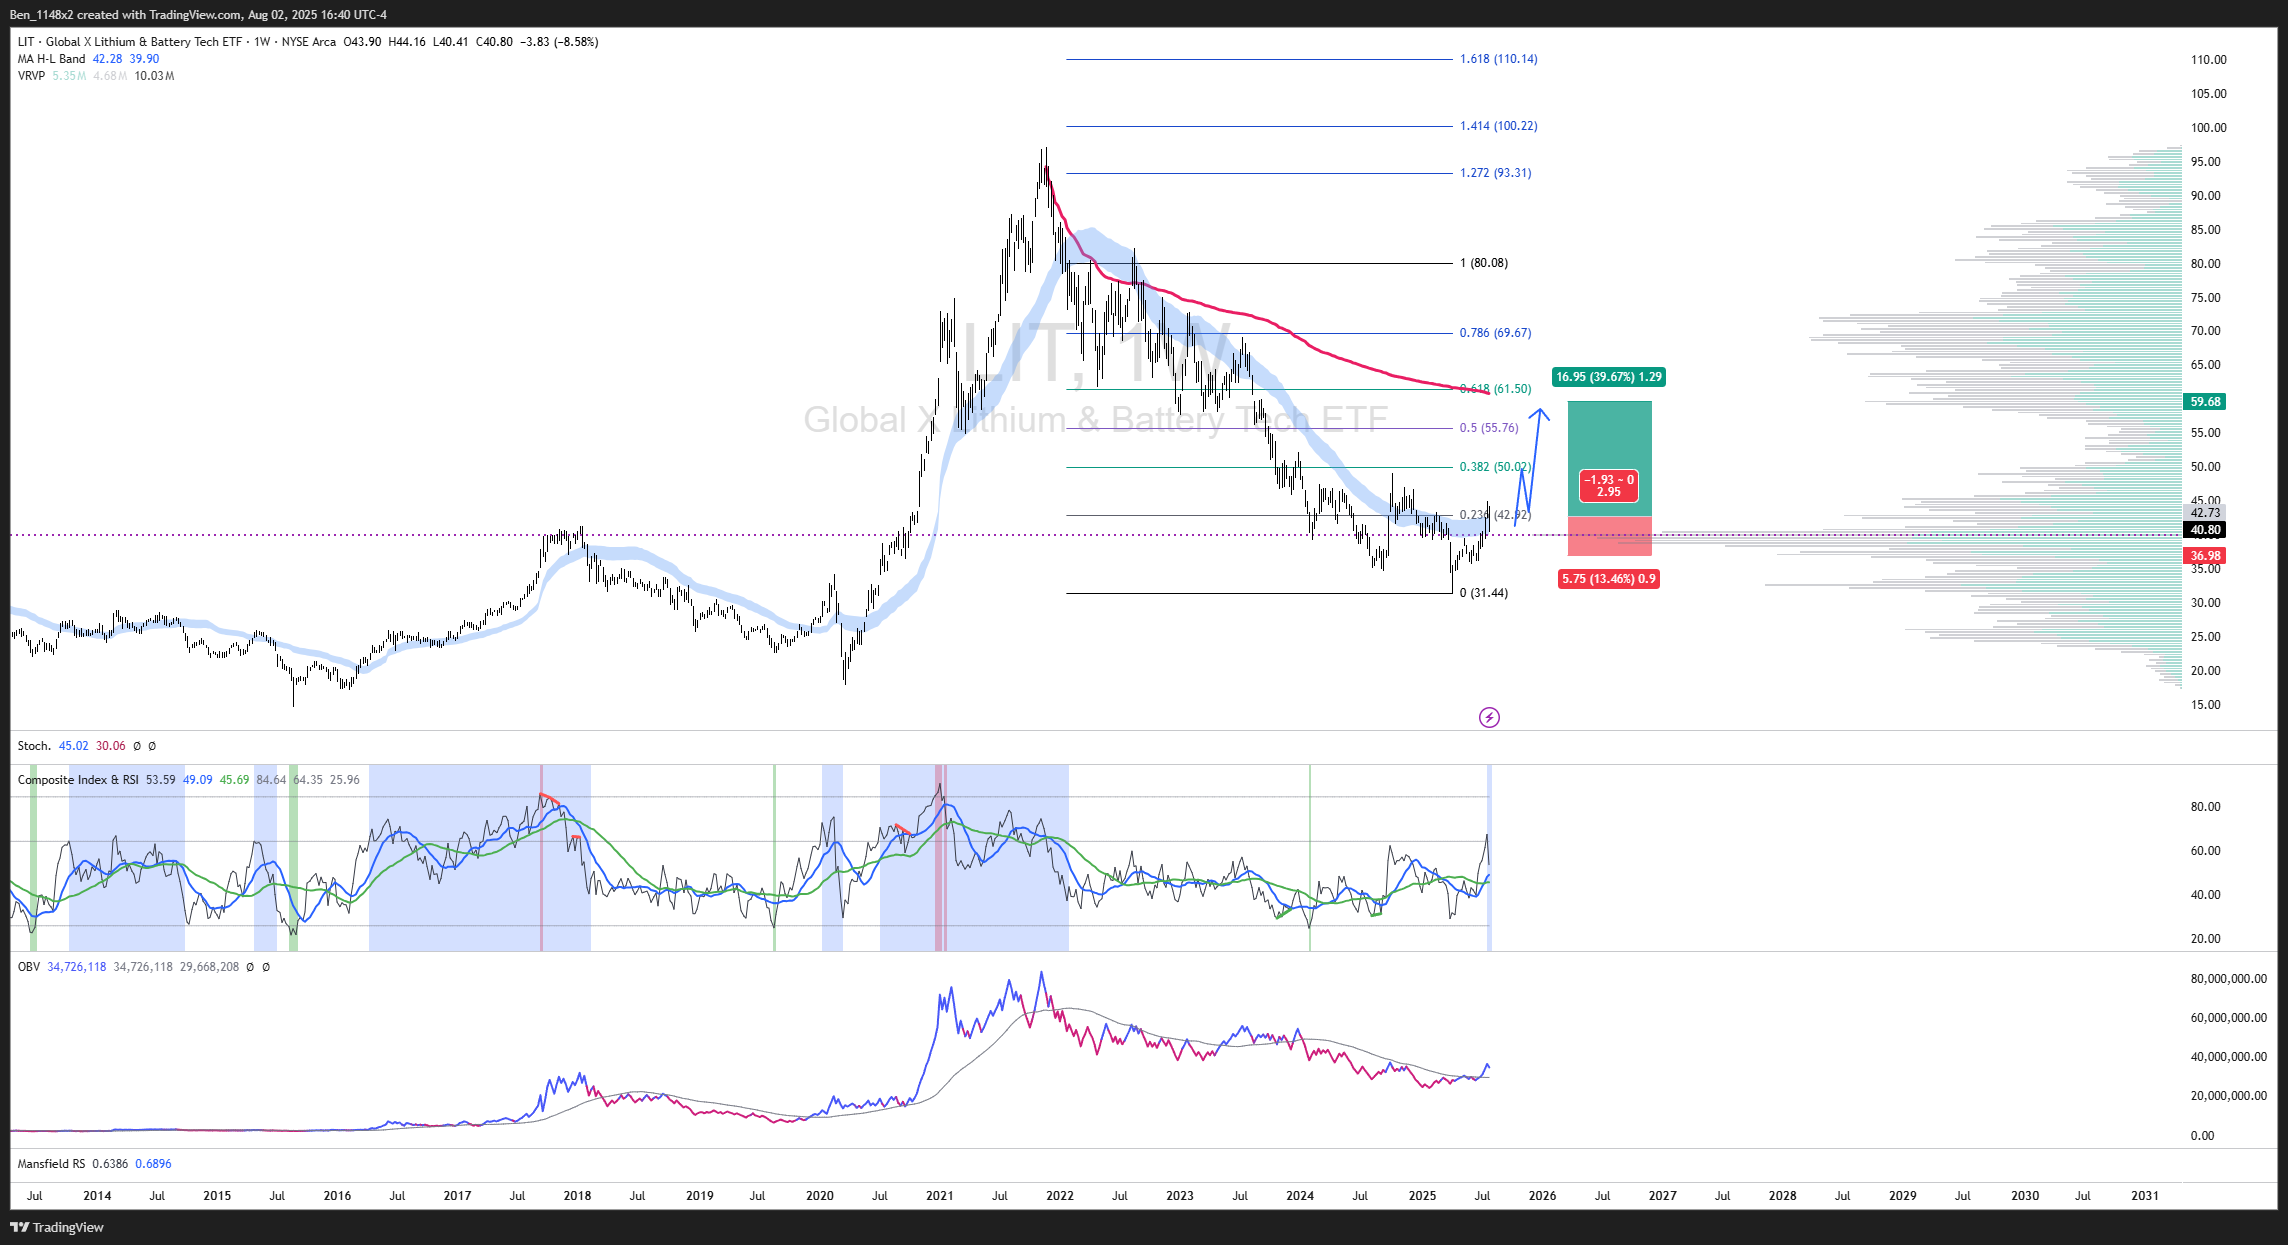
LIT - selling climax
LIT the lithium ETF retraced after a weekly bullish RSI crossover. On balance volume is bullish. The recent selling climax could see us build a base if physical AI and drone production continue to draw the markets attention.
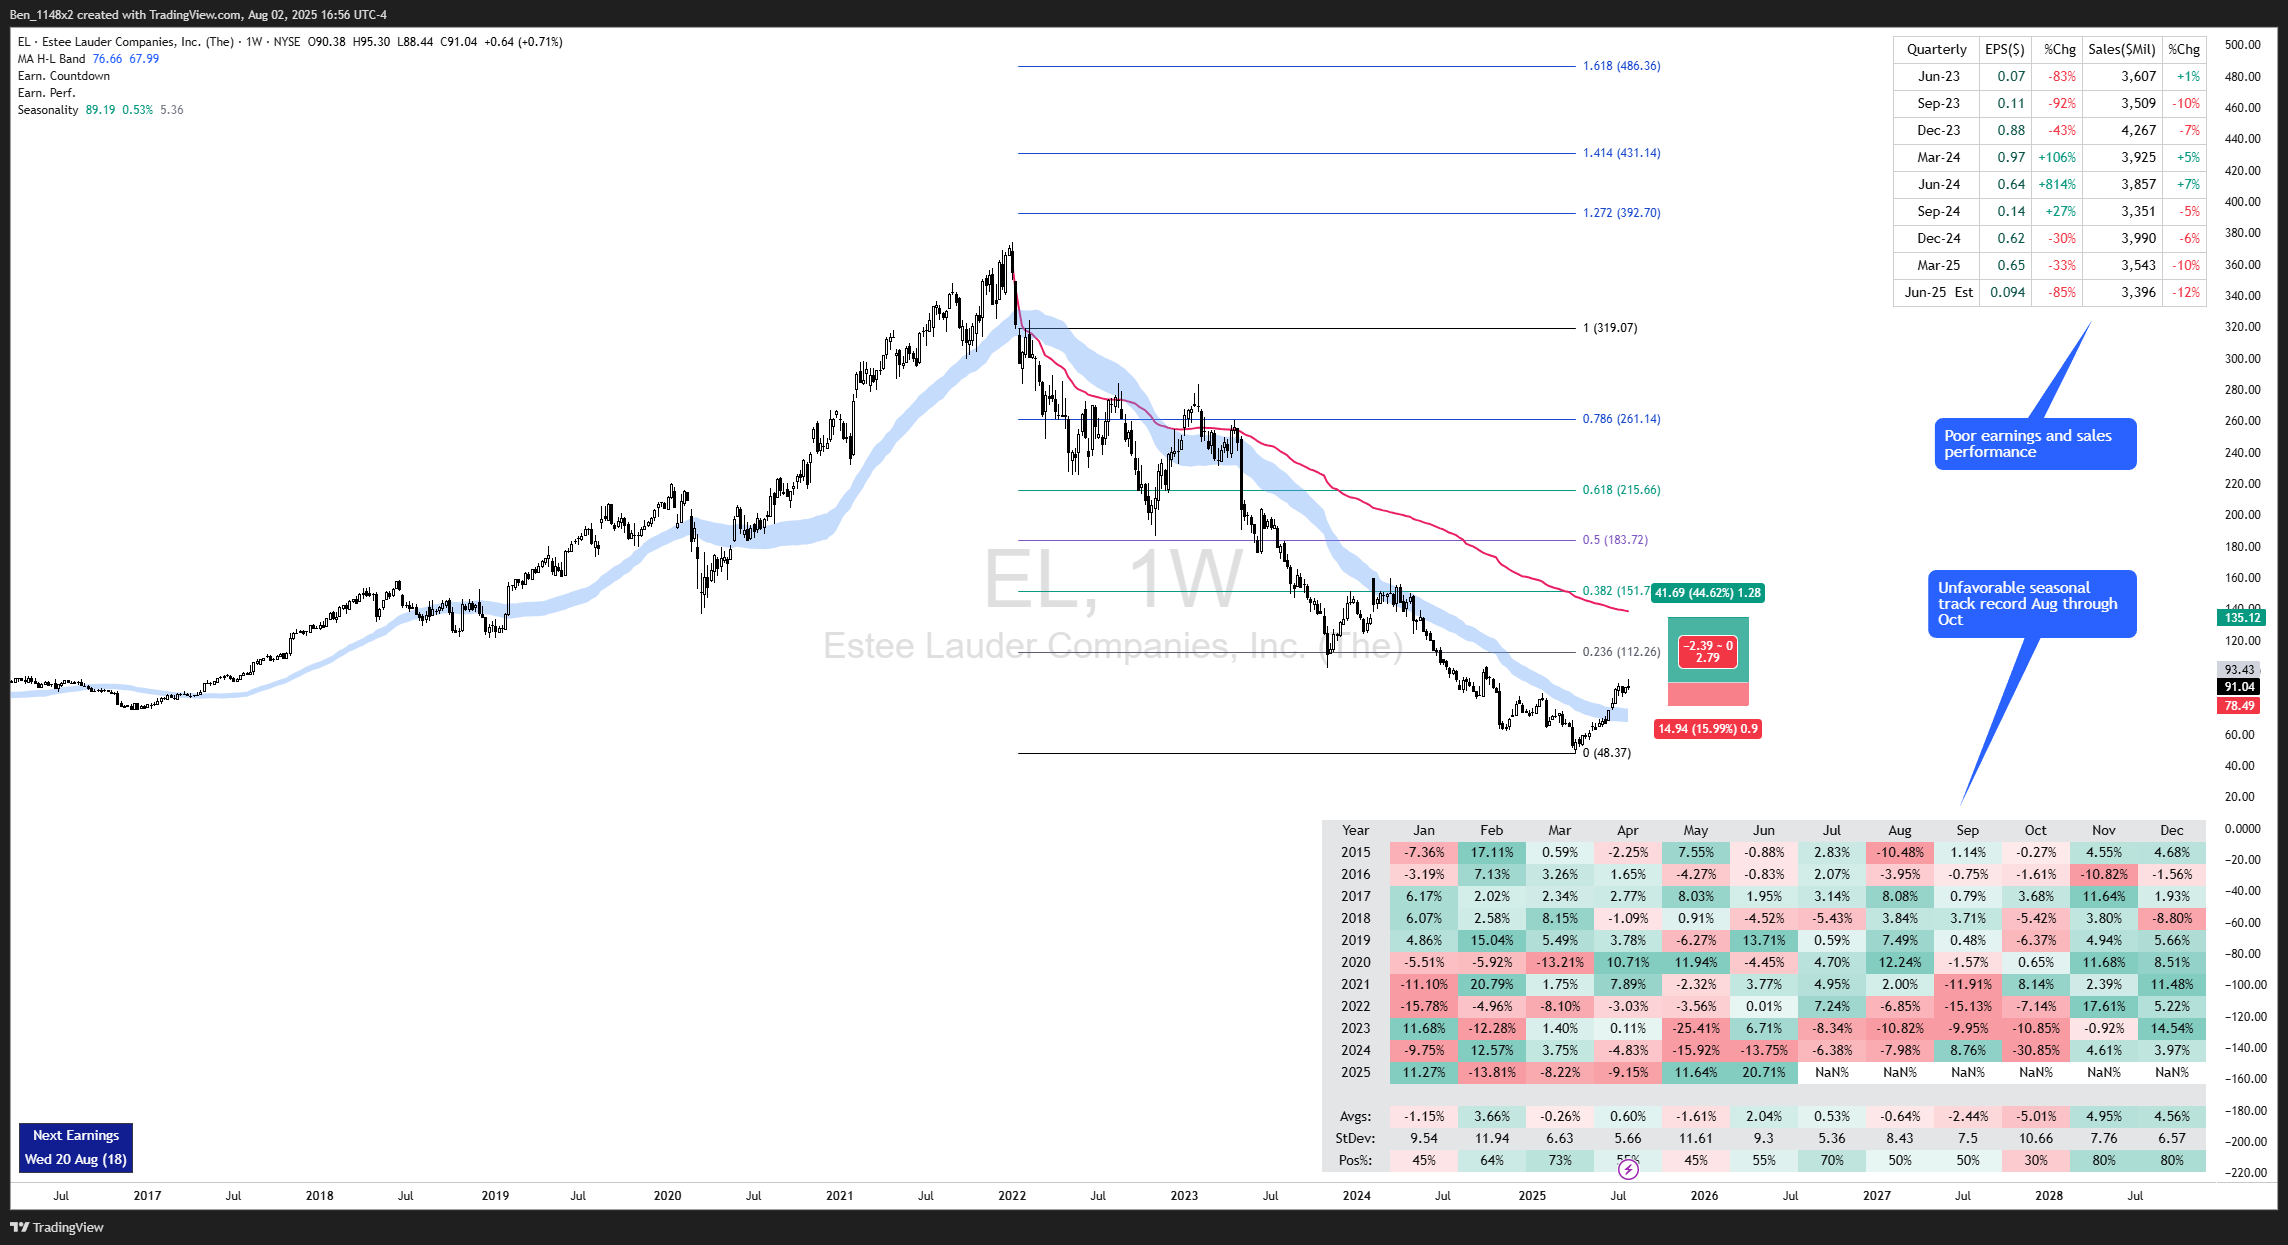
EL - selling climax
Estee Lauders reversal from a selling climax is being confirmed by on balance volume.
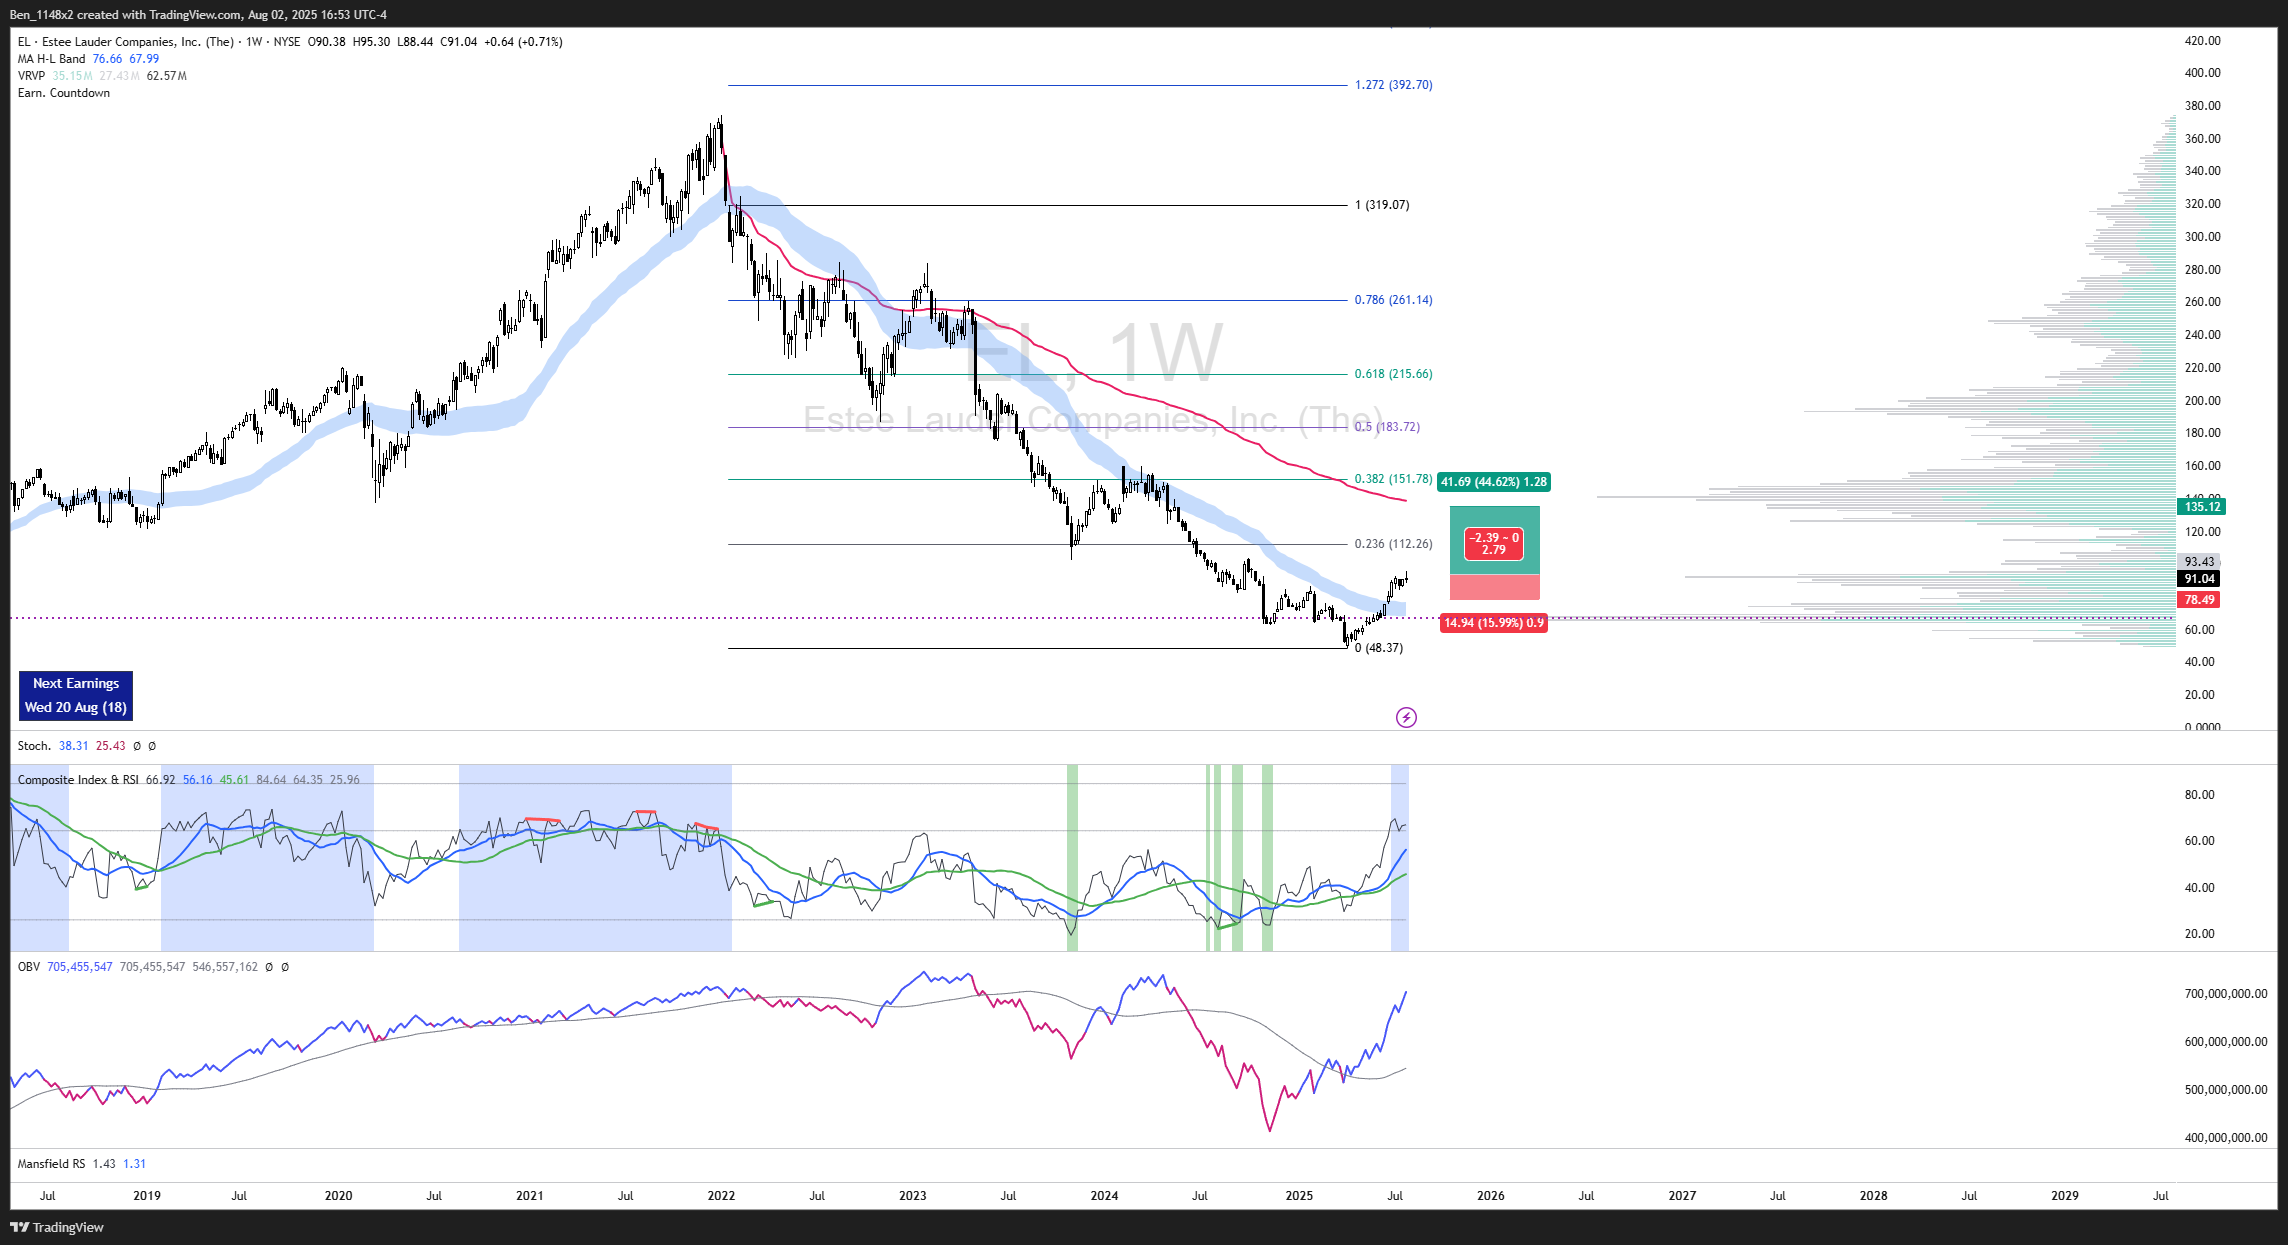
Be aware that earnings are on 8/20. There has been a poor earnings track record and we are heading into time of the year that has seen poor seasonal performance. A bounce up to the target area might offer us an opportunity to short after earnings.
WTAI - Buying Climax
WTAI saw a weekly reversal from a high. The AVWAP from the May gap is approaching the 0.618 at $24.
ETHA - Buying Climax
ETHA the ETH ETF pumped up with the help of news of Tom Lees ETH reserve. A reversal from here could be a nice short opportunity to $21.