
Next Subscriber Call: 2025-10-16 6PM ET
BTC SPY NVDA

Our next subscriber call will be this Thursday, October 16 at 6PM ET.
These sessions are working discussions where we look at charts and trends together. They’re open to all readers.
The content is educational and informational only. We won’t provide individualized advice, portfolio guidance, or specific investment recommendations.
Call details:
Live Chart Review - It’s All in the Reflexes
Oct 16, 2025 06:00 PM Eastern Time (US and Canada)
Meeting ID 848 1649 9249
Passcode 528427
https://us06web.zoom.us/j/84816499249?pwd=DXFKtBN5GB07v7BPp9kmeFB7X0CG5z.1
Brief Update
SPY
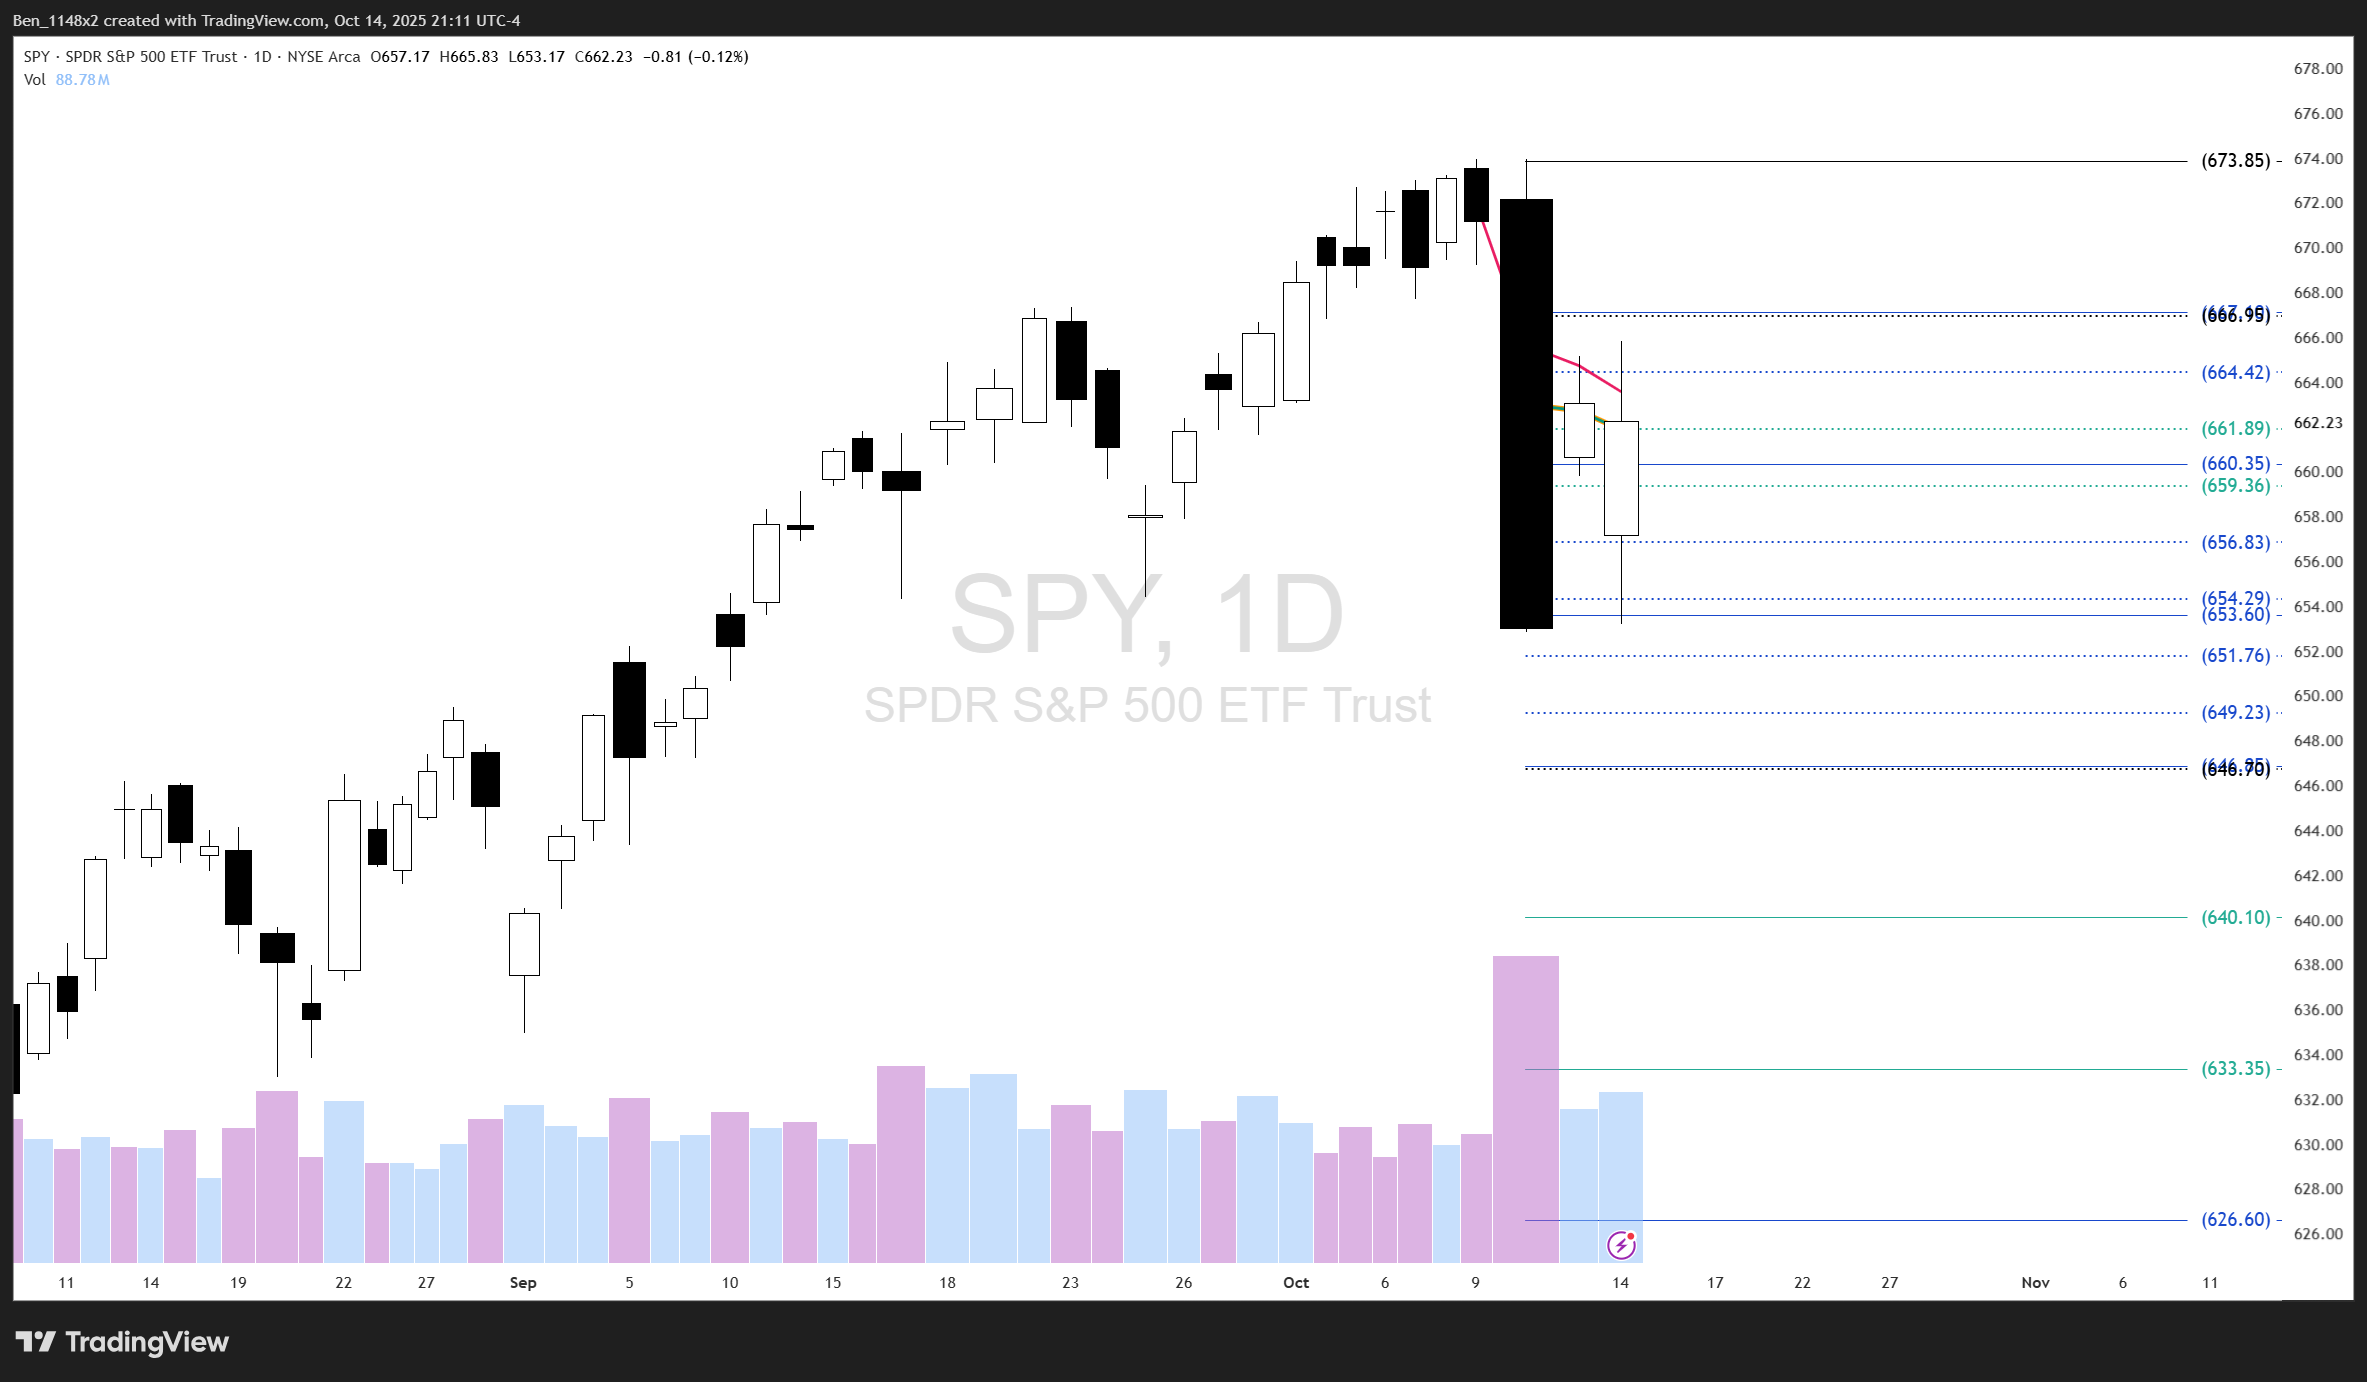
On Sunday my second video covered the way that I would look at SPY over the past couple of days. Here is what I see so far.
On the lower time frame 5 minute chart we can see consolidating behavior.
Monday’s activity moved above and held support at the AVWAP from the low (green) and the AVWAP from the start of the drawdown (orange). During the day it claimed the TWAP (blue), but it hit resistance at the AVWAP from the all time daily high (red). Volume was relatively light, suggesting low participation.
Today’s price action gapped down to fill the gap between Friday’s close and Monday’s open. Then it closed today’s opening gap. Trading took place in a narrower range, producing a higher low and higher high relative to Monday.
Price reclaimed the TWAP and AVWAP from the low as support, but fell below the AVWAP from the prior high during after hours.
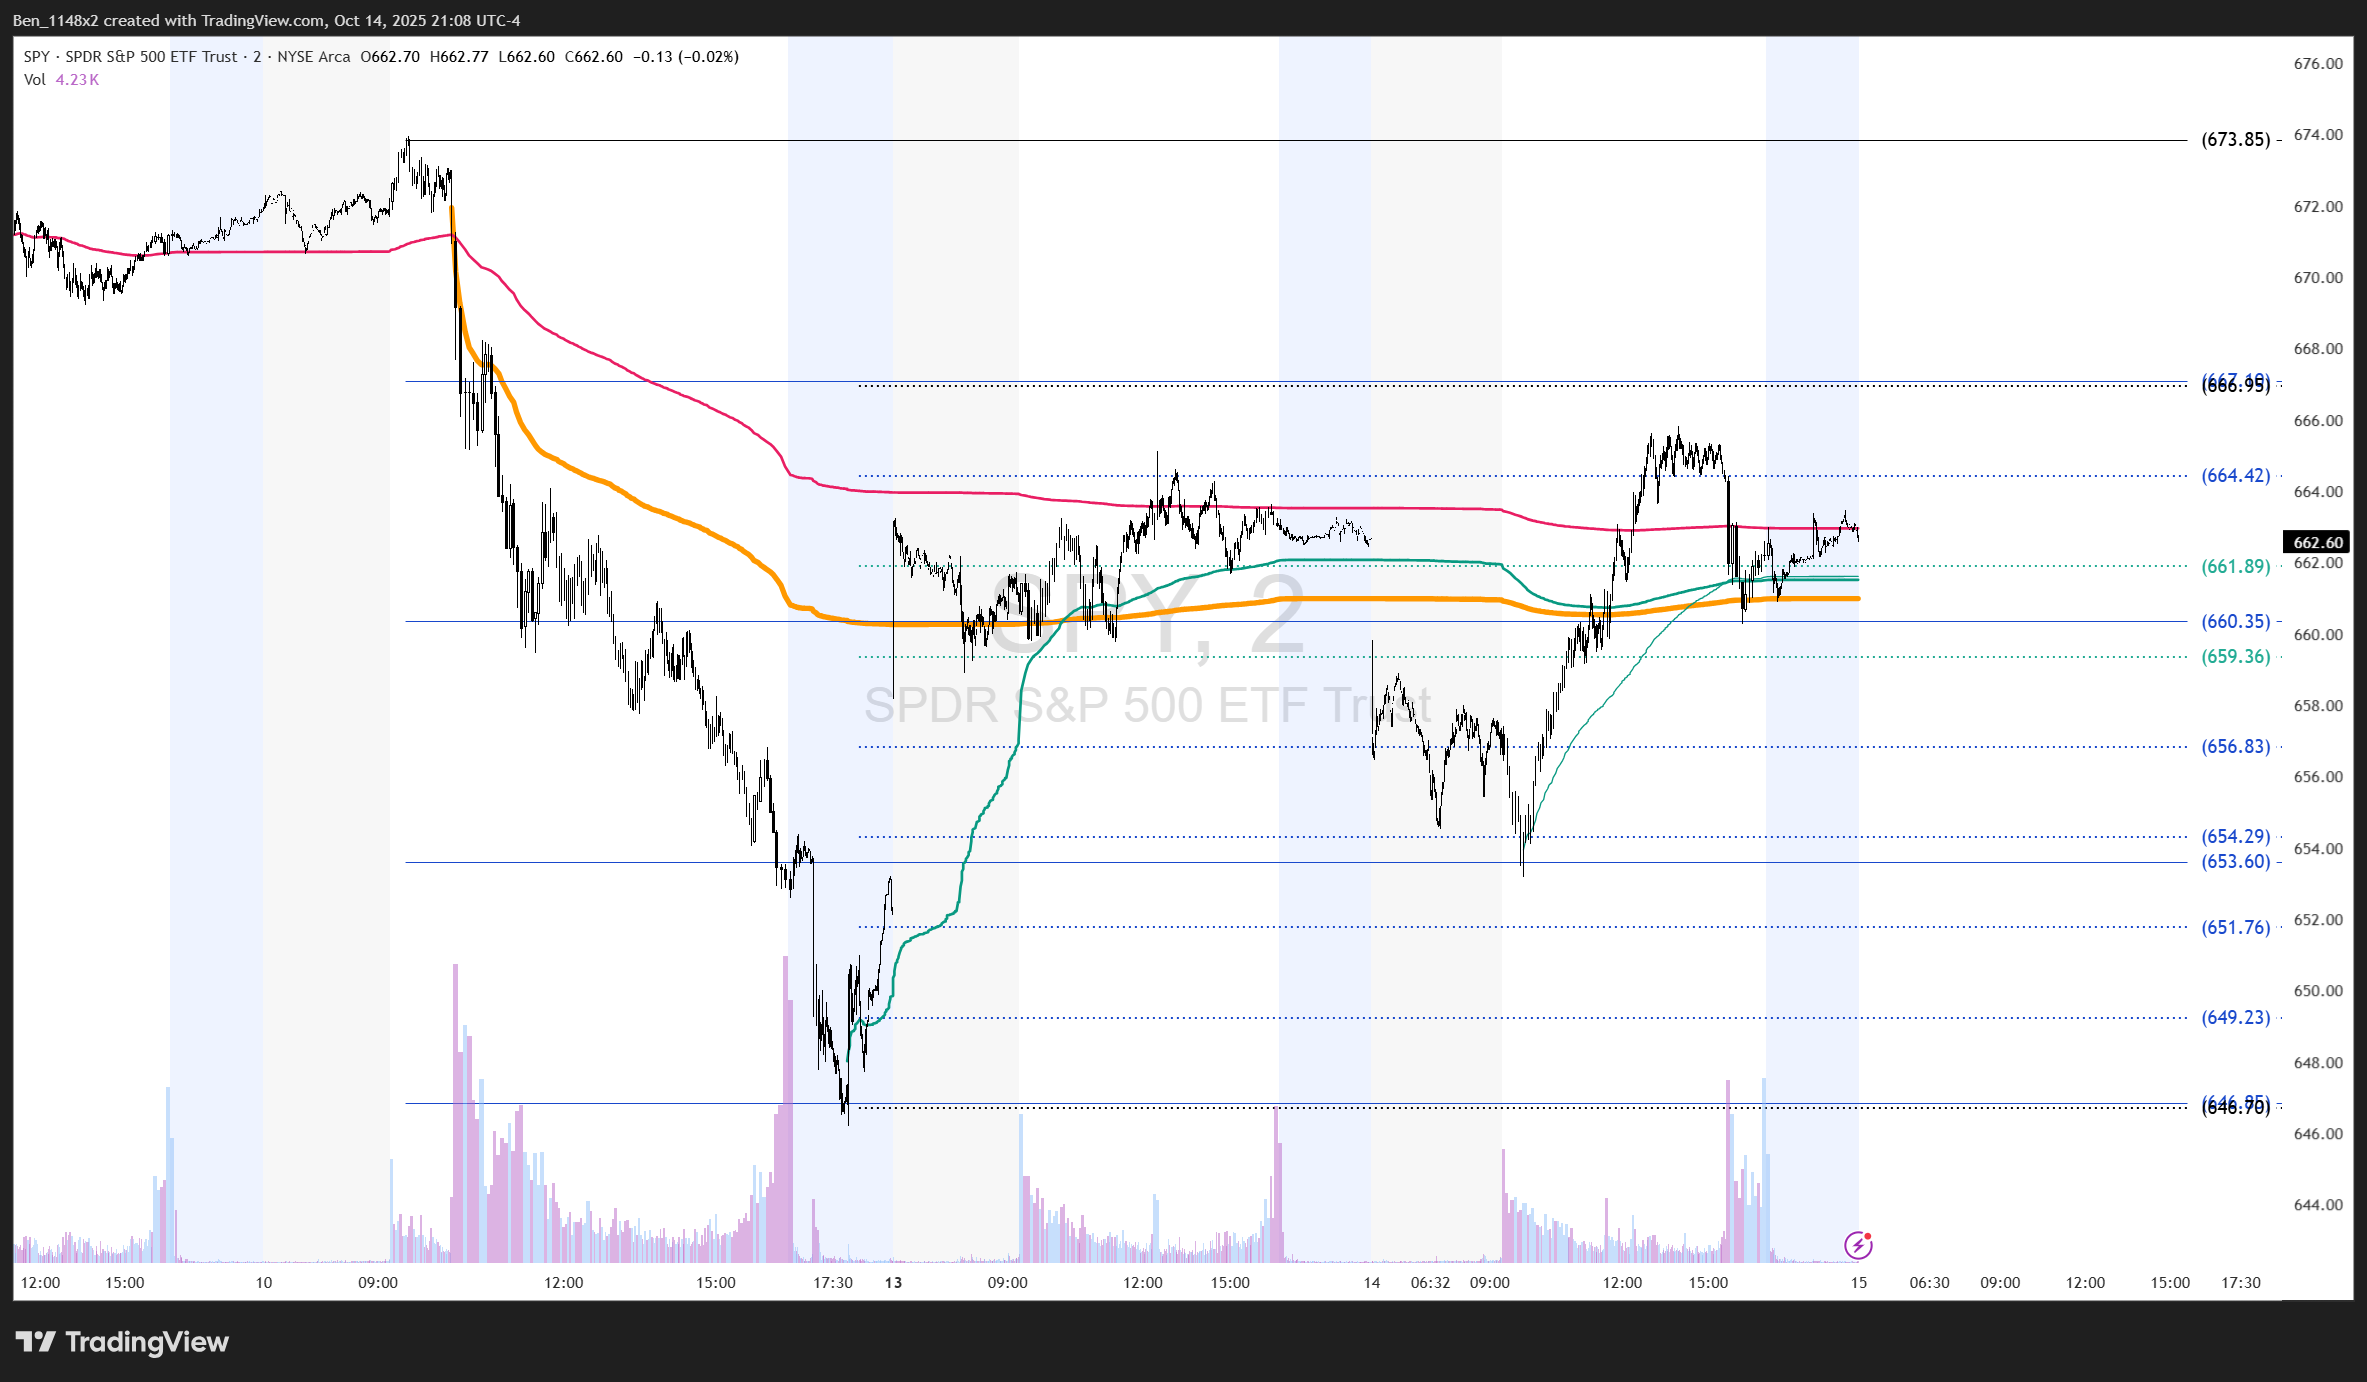
Volume candles and candle patterns indicate that we’re still in a bearish reversal. I didn’t catch this over the weekend, but Thursday’s candle was a “dark cloud cover.” This happens when the first candle (Wednesday) is green (white) and among the larger recent candles, and the next is red (black). The second candle opens higher than the previous and then closes below the middle of the prior candle. Two candle reversal patterns require confirmation, and Friday’s candle is about as clear of a confirmation candle can be.
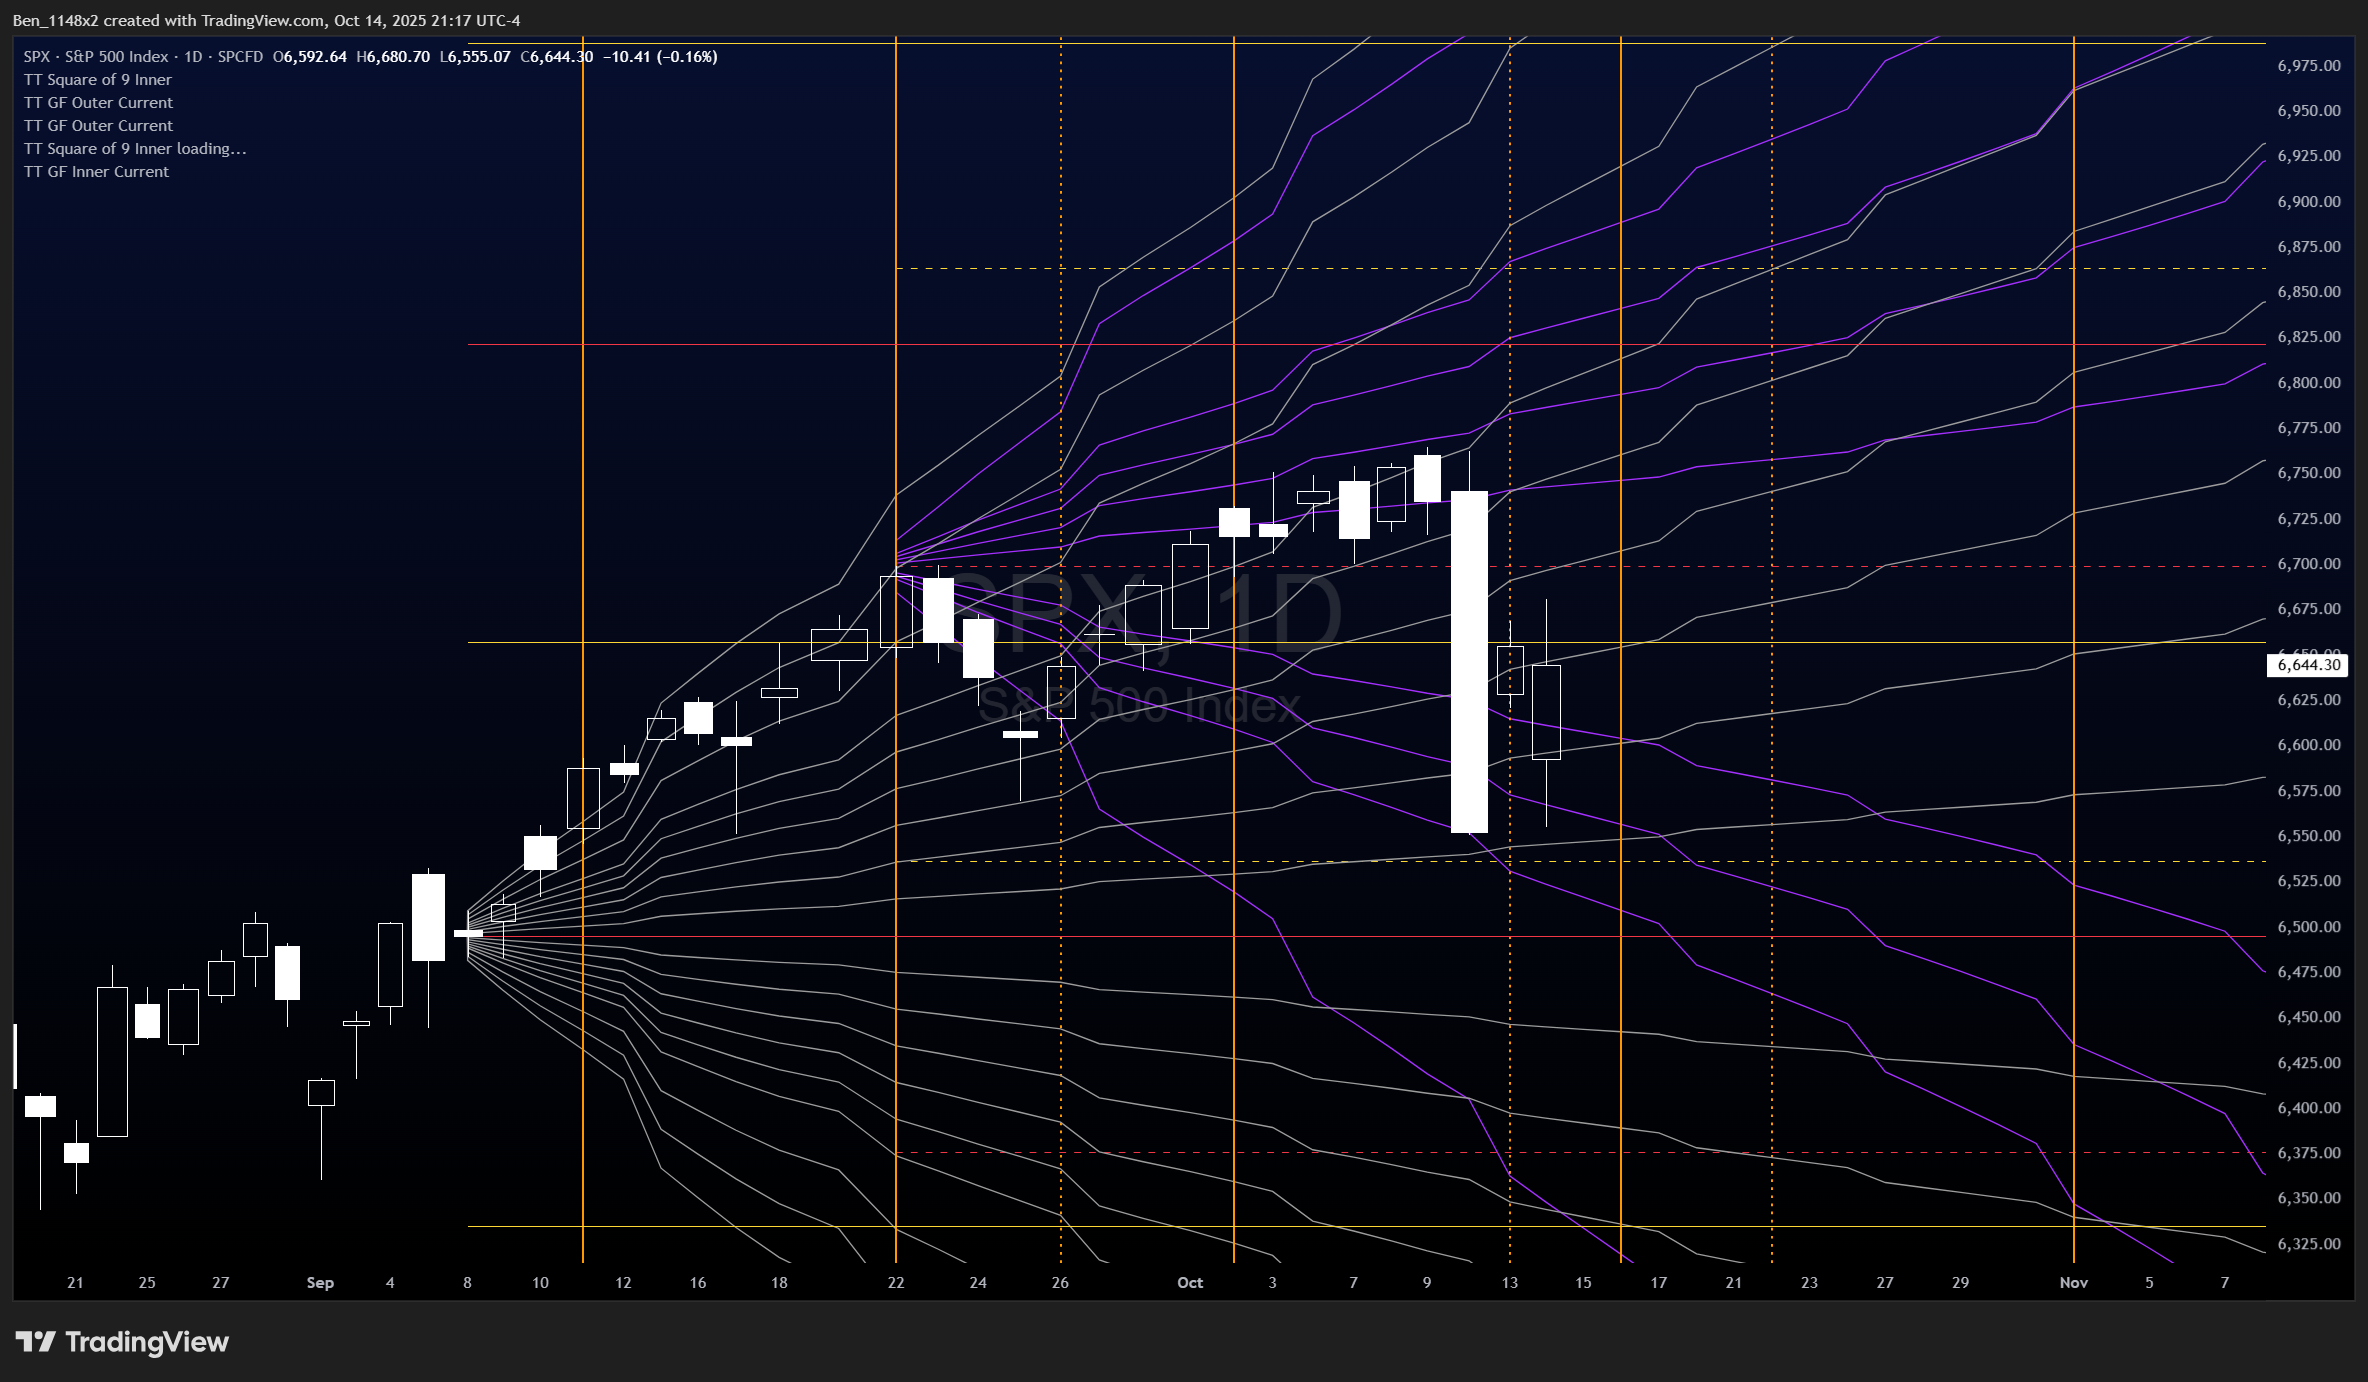
The good news is that price appears to be respecting the ascending angles in the planetary Gann fan.
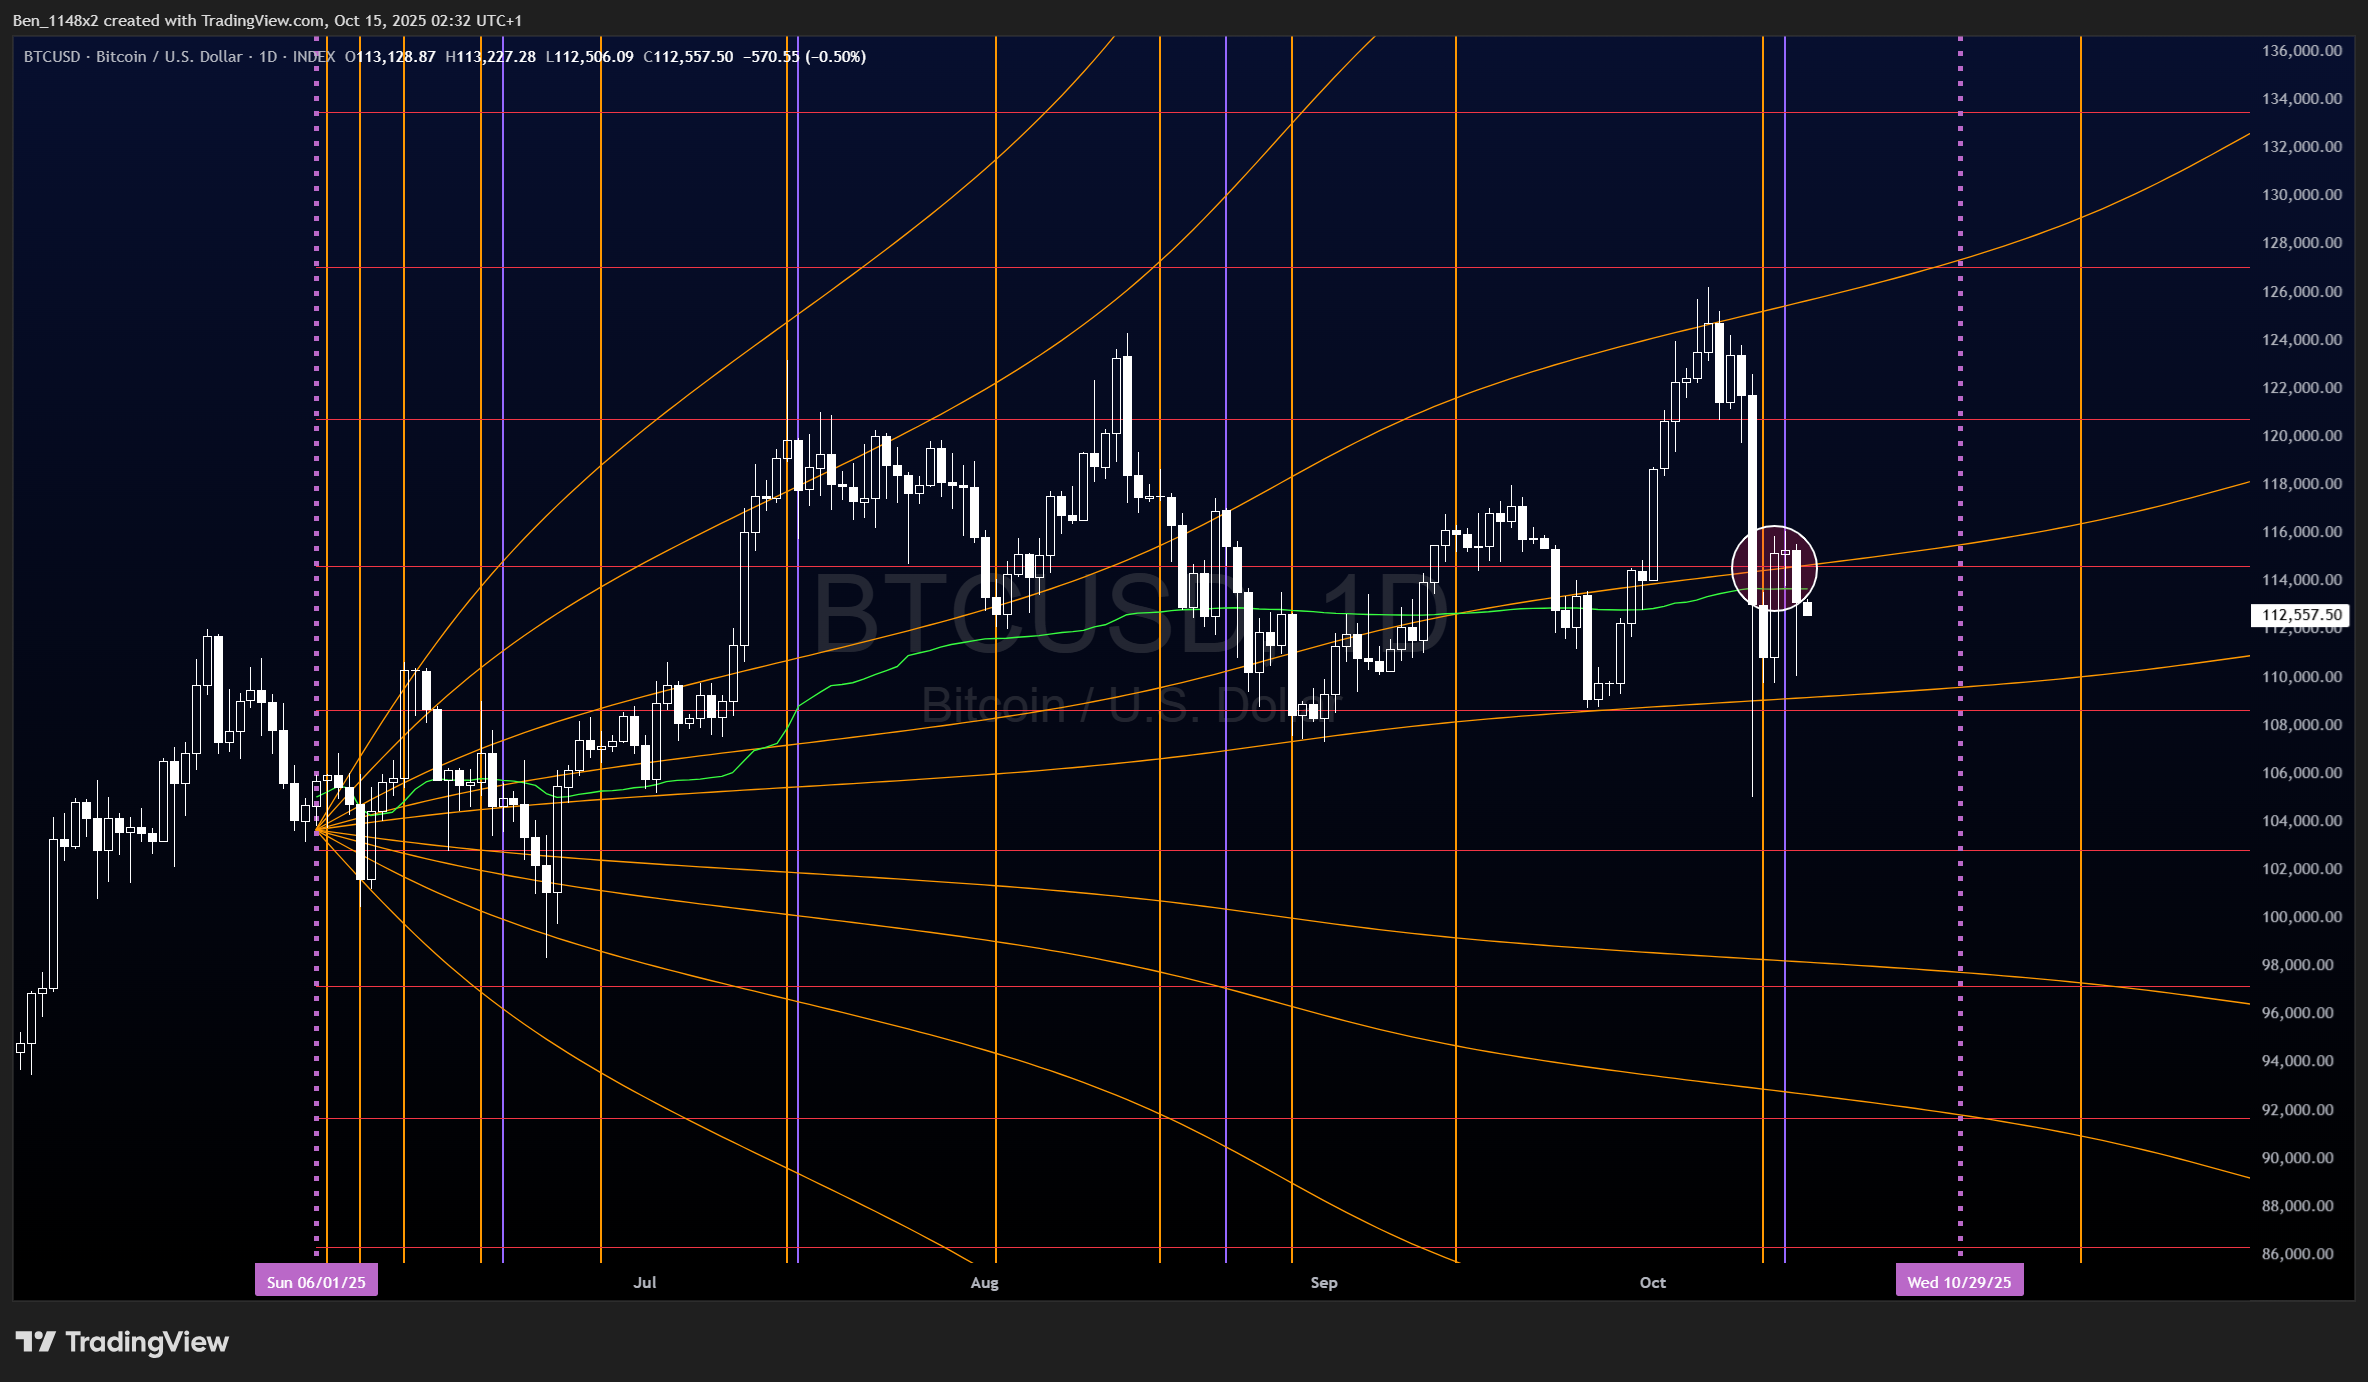
Bitcoin
BTC is below the AVWAP from all time high and the prior high. The RSI is in the bear zone and below descending moving averages. The -DI line in the ADX has overtaken the +DI and ADX, and the ADX indicates that the bearish move has strength.
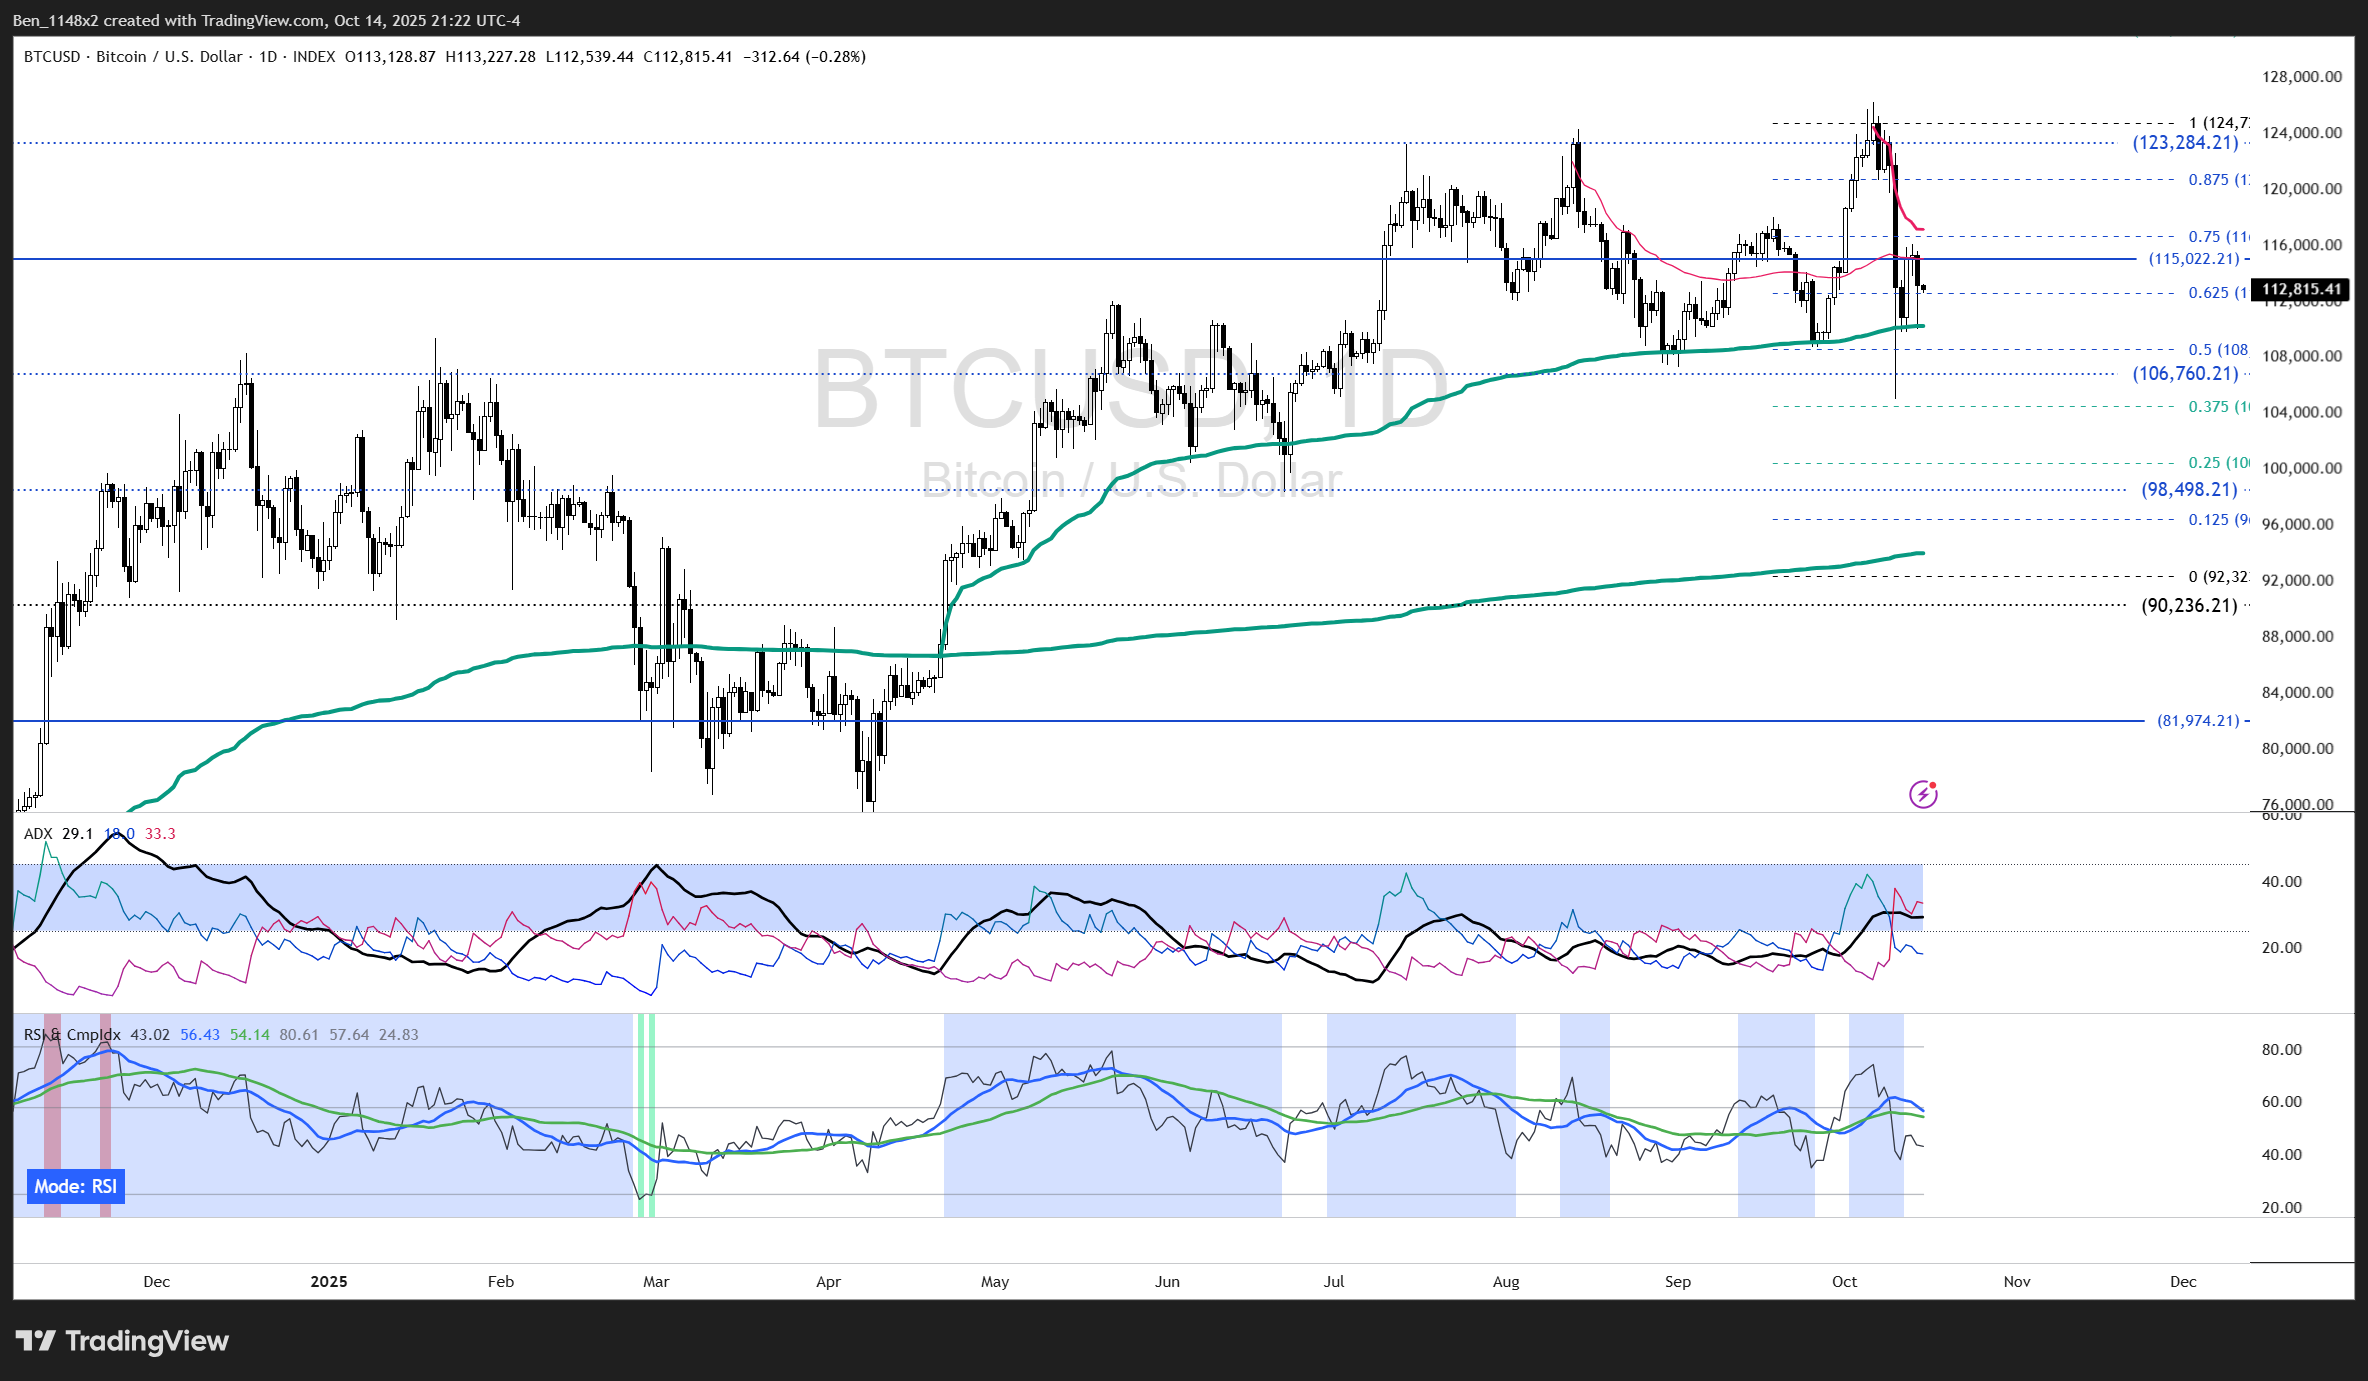
The harmonic levels with dashed lines are anchored to an area of contraction. The solid and dotted are anchored to expansion. We are seeing resistance at the levels anchored to expansion and price does not appear to react to the levels anchored to contraction. This is subtle, and favorable.
We are squeezed between AVWAPs from the highs and the one anchored to the April hand-off. This is the third test of it and previous hand-offs have either failed or succeeded after 2 to 3 retests.
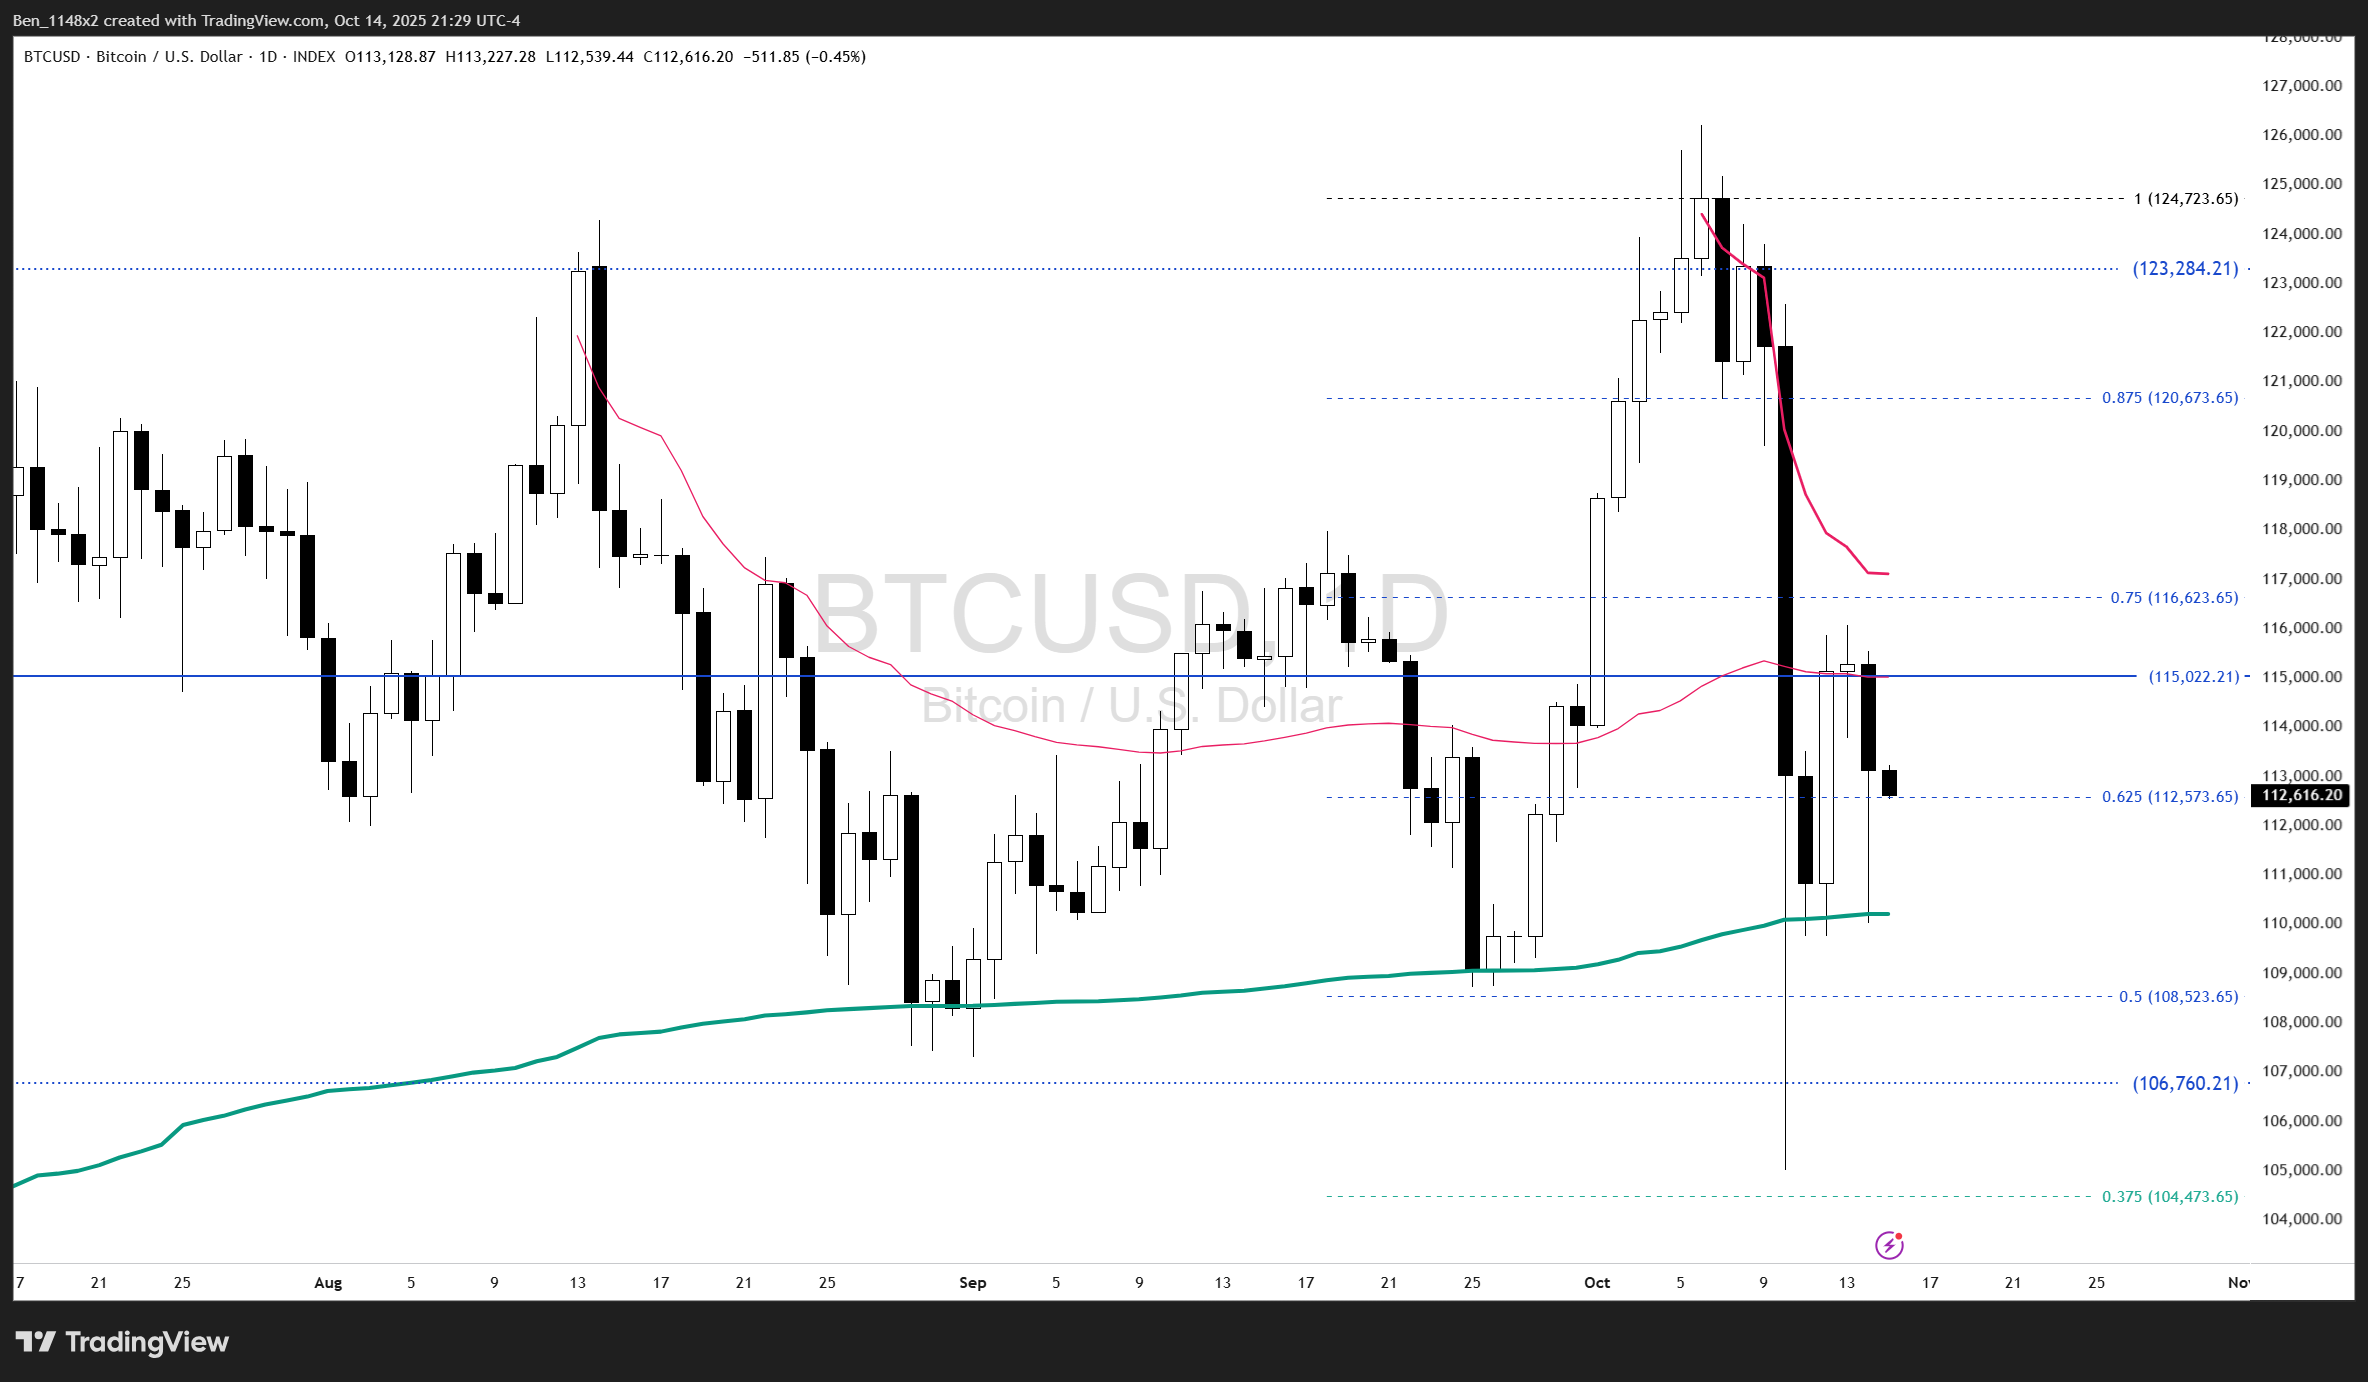
Rejection and moving lower at this area of interest and intersection of the square of 9 and Gann fan is unfavorable. Based on these conditions, my next BTC allocations will likely be limited to either a retest of the upper 90’s or a break above 116.
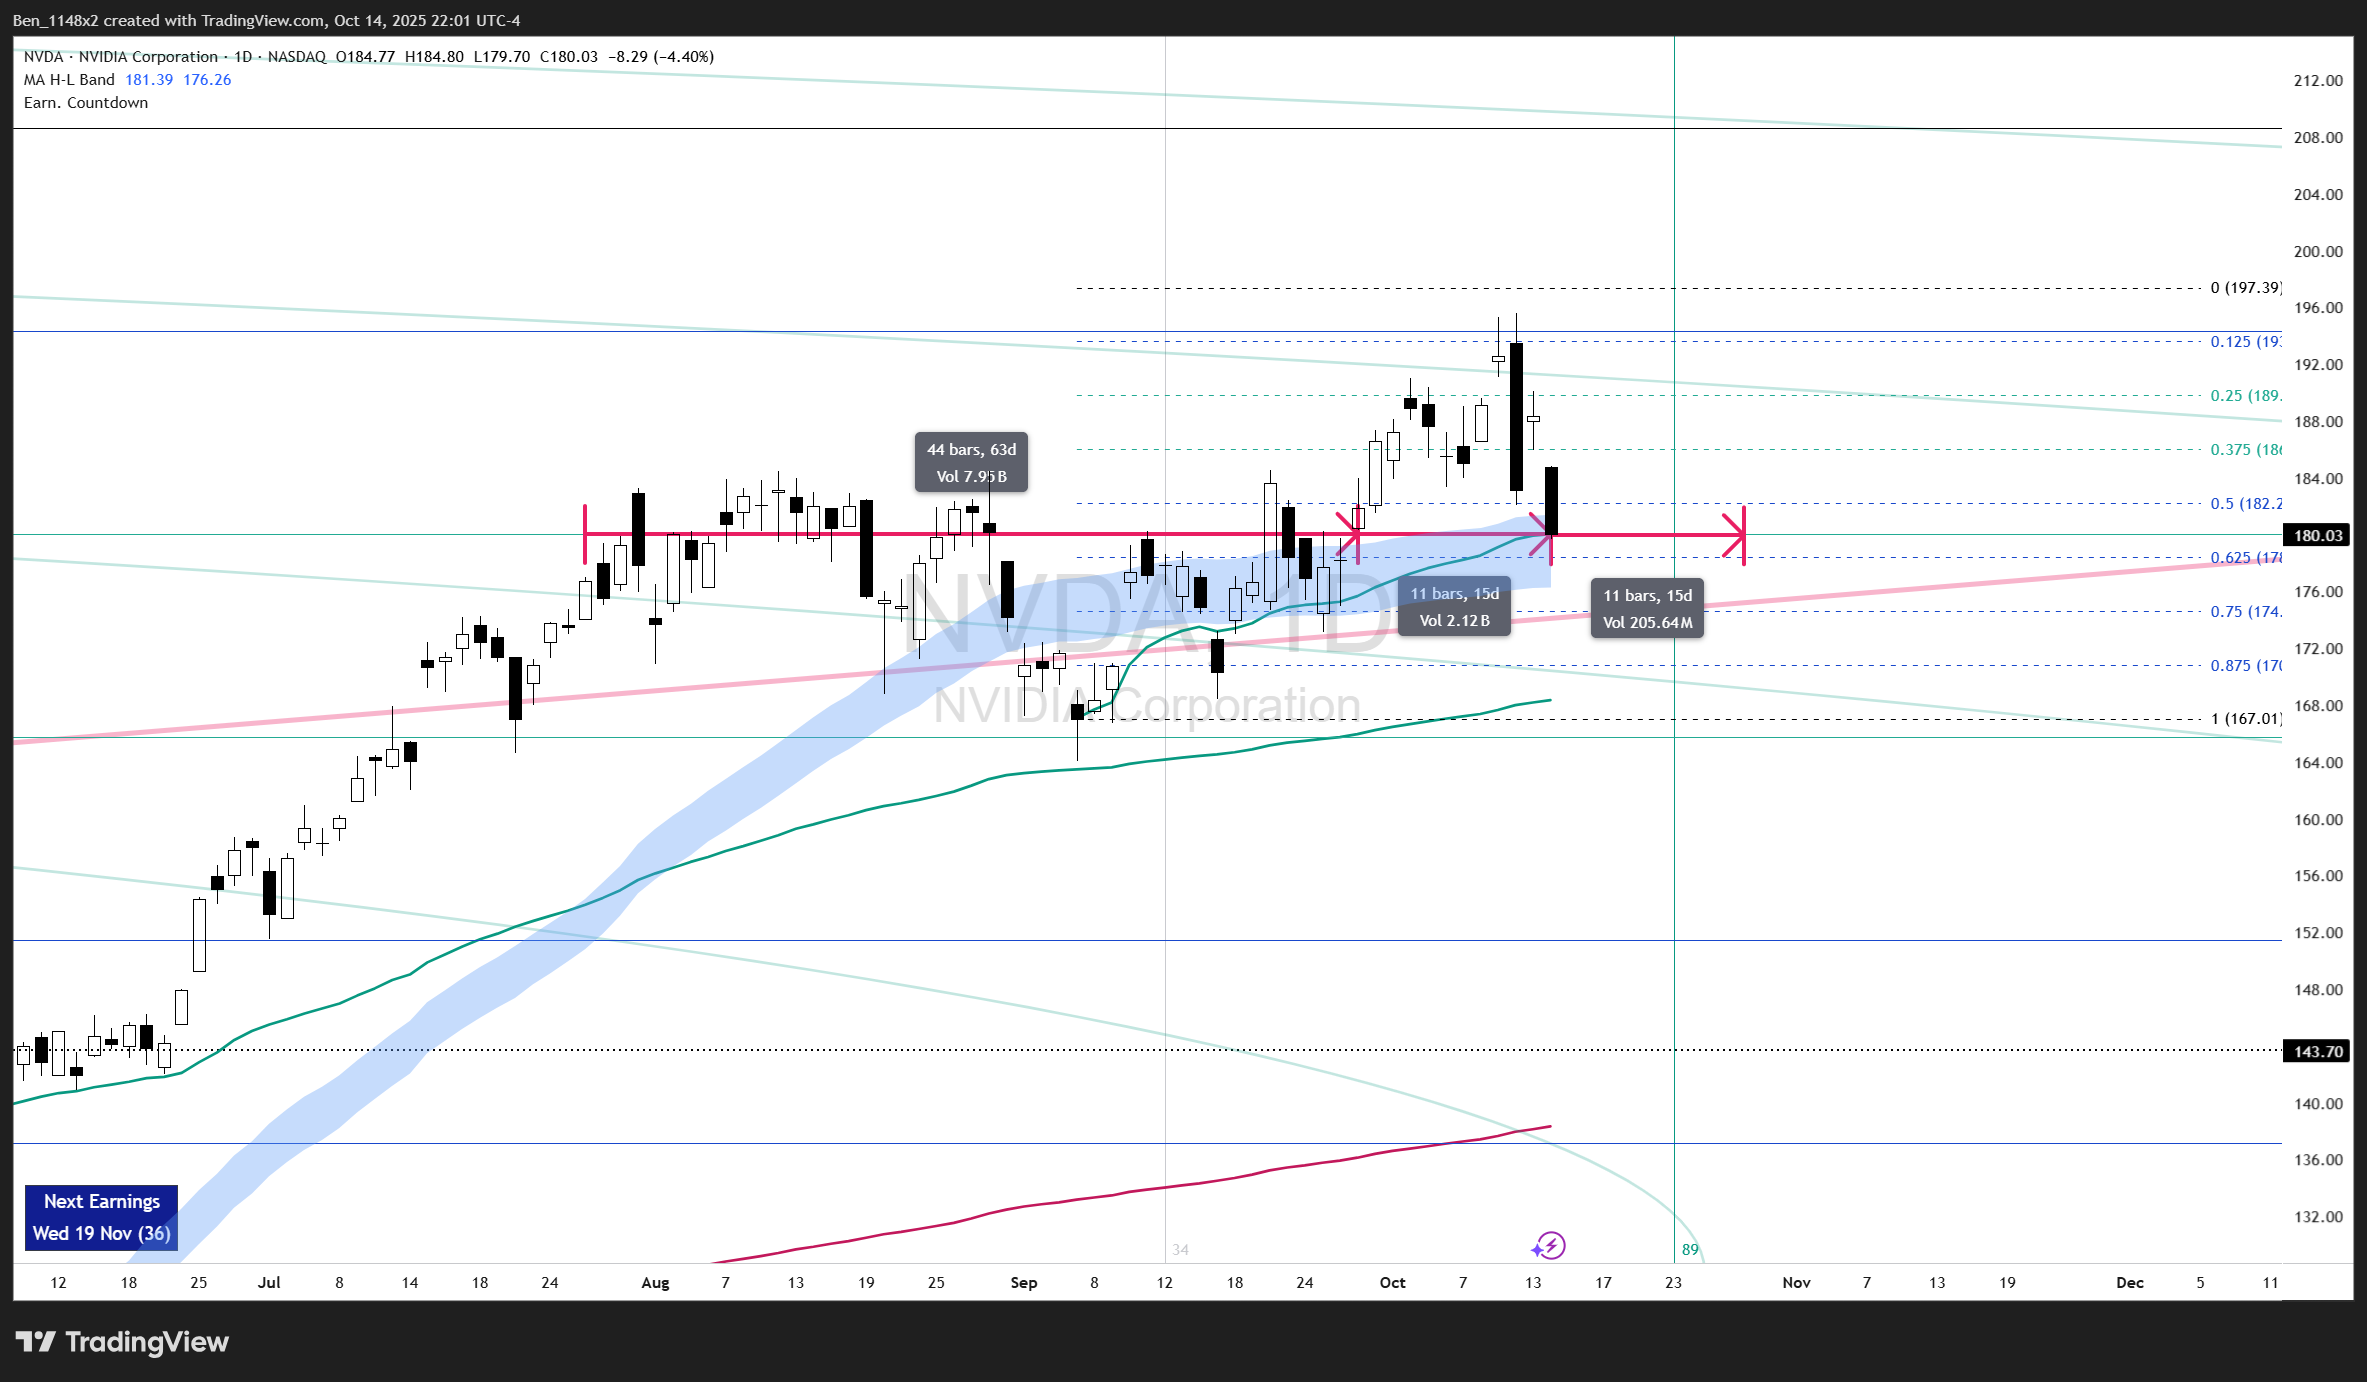
NVDA
I need to look at the NVDA chart more often. This is the largest company in the world and it’s weighting in indexes and ETF’s has potential for broad market impact. If funds rotate out of NVDA, we’ll need to understand whether they are moving to other sectors or asset classes.
My timing studies associated with the markets response to NVDA’s previous stock splits have accurately identified turning points. The next date of interest in that study is 10/23. After that we have a wide opening until 9/9/26.
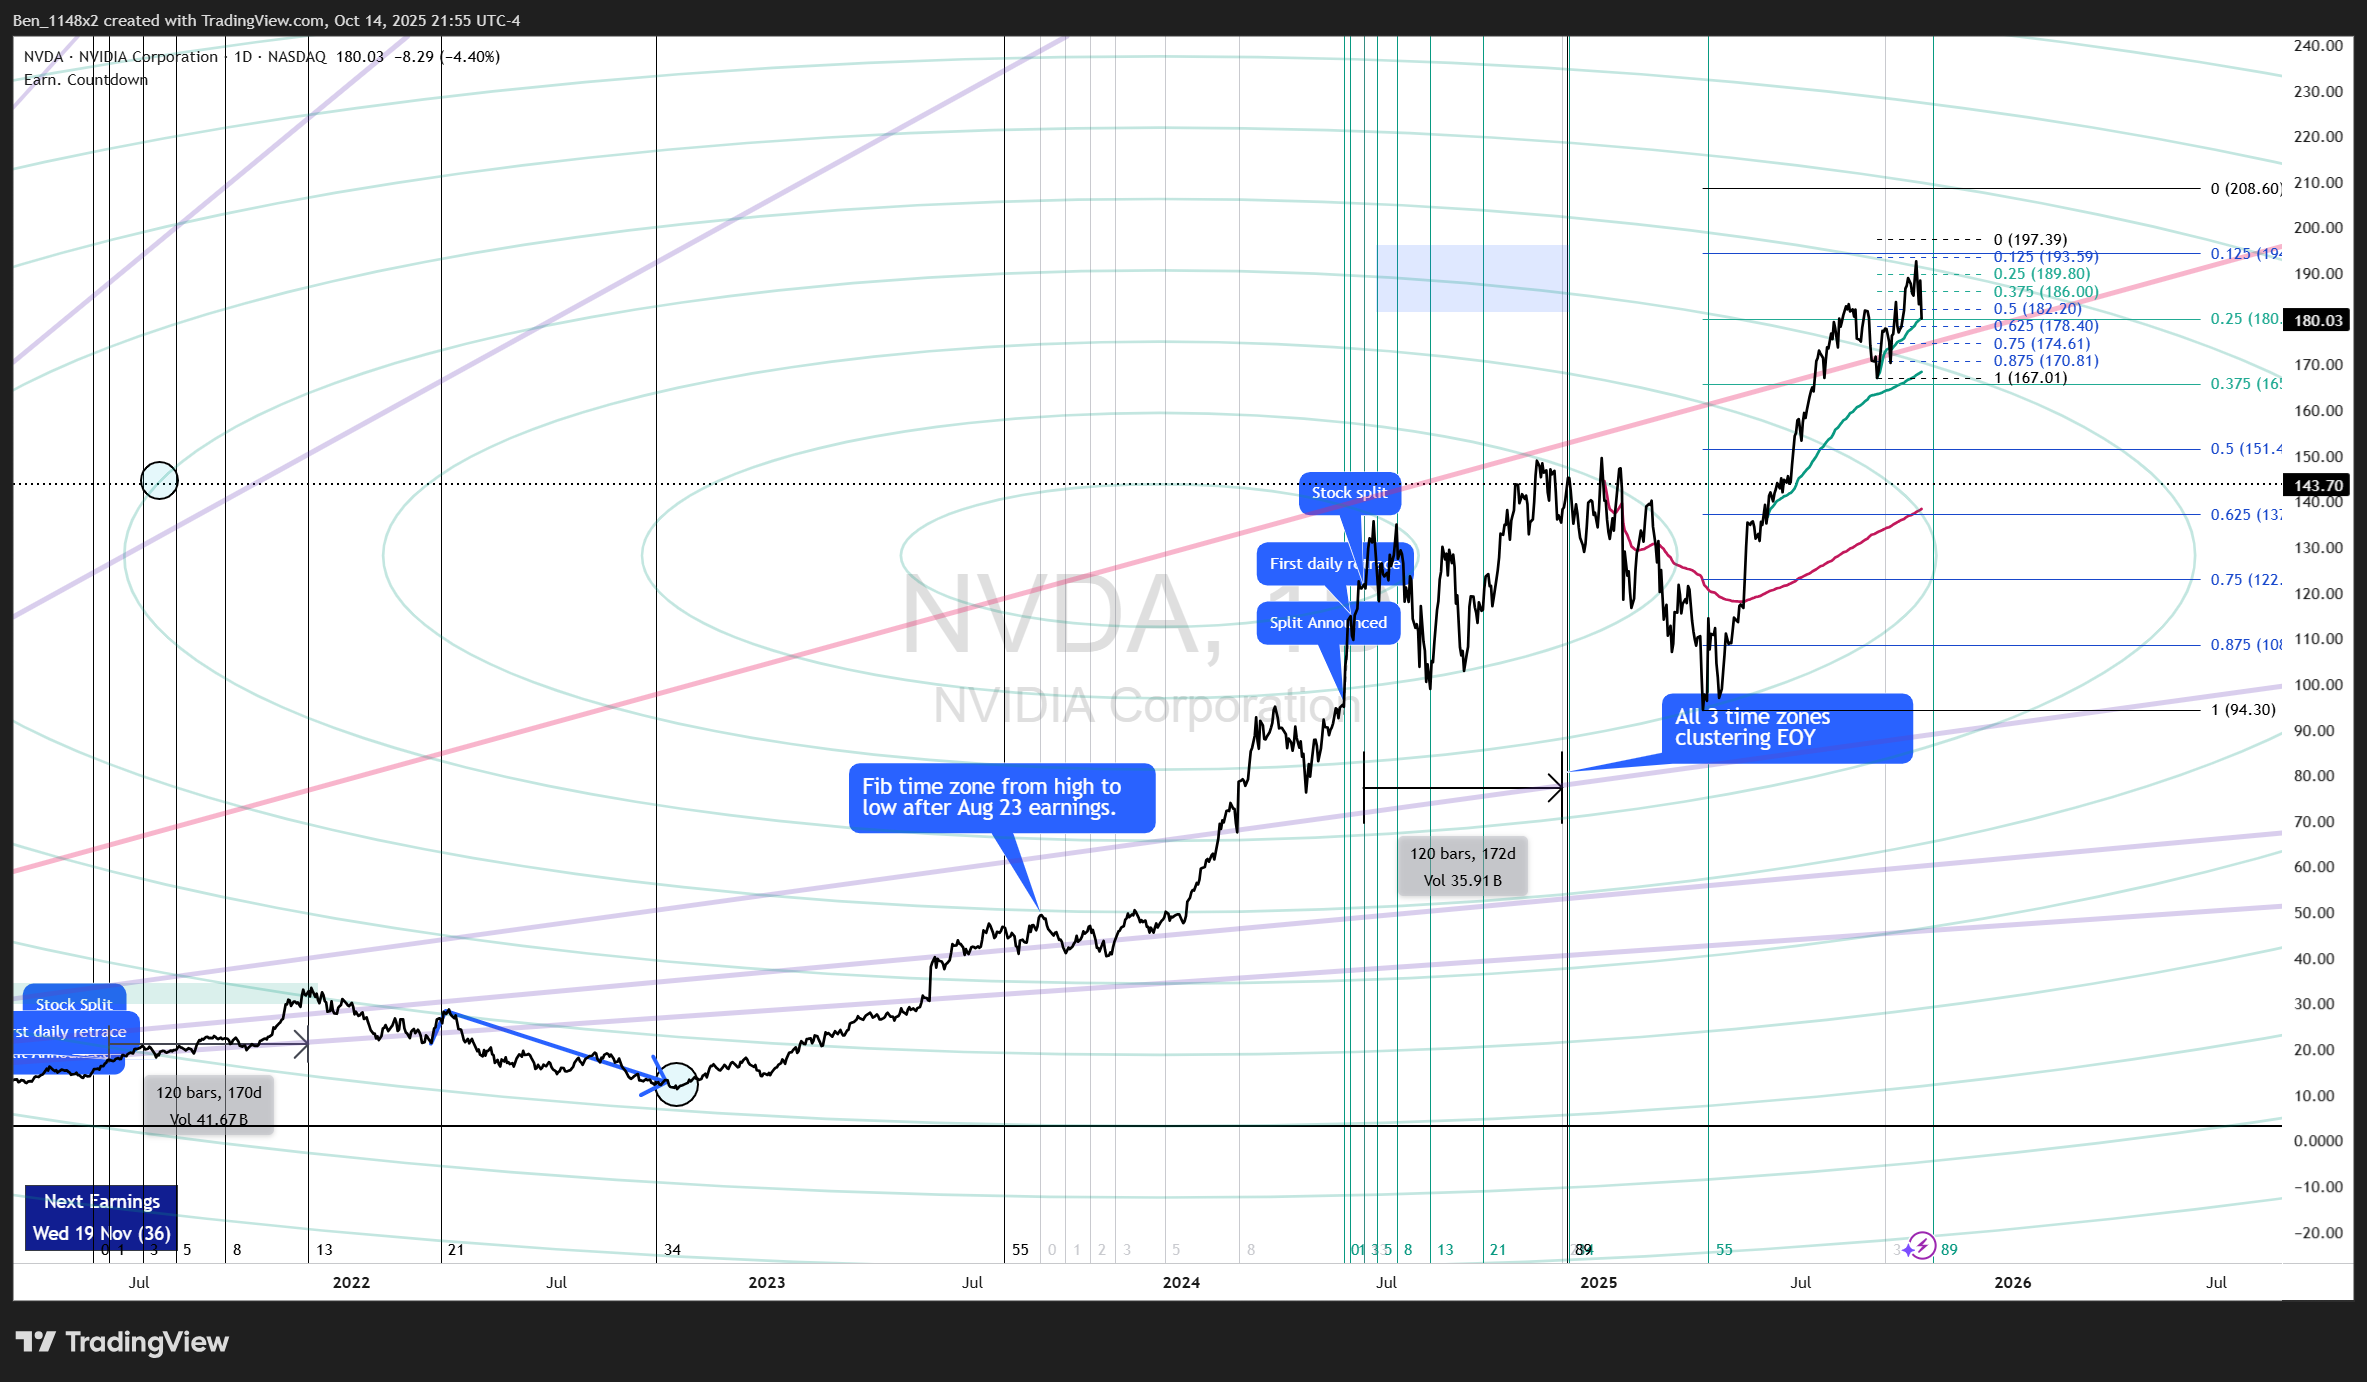
Price is testing the AVWAP from the 9/5 low.
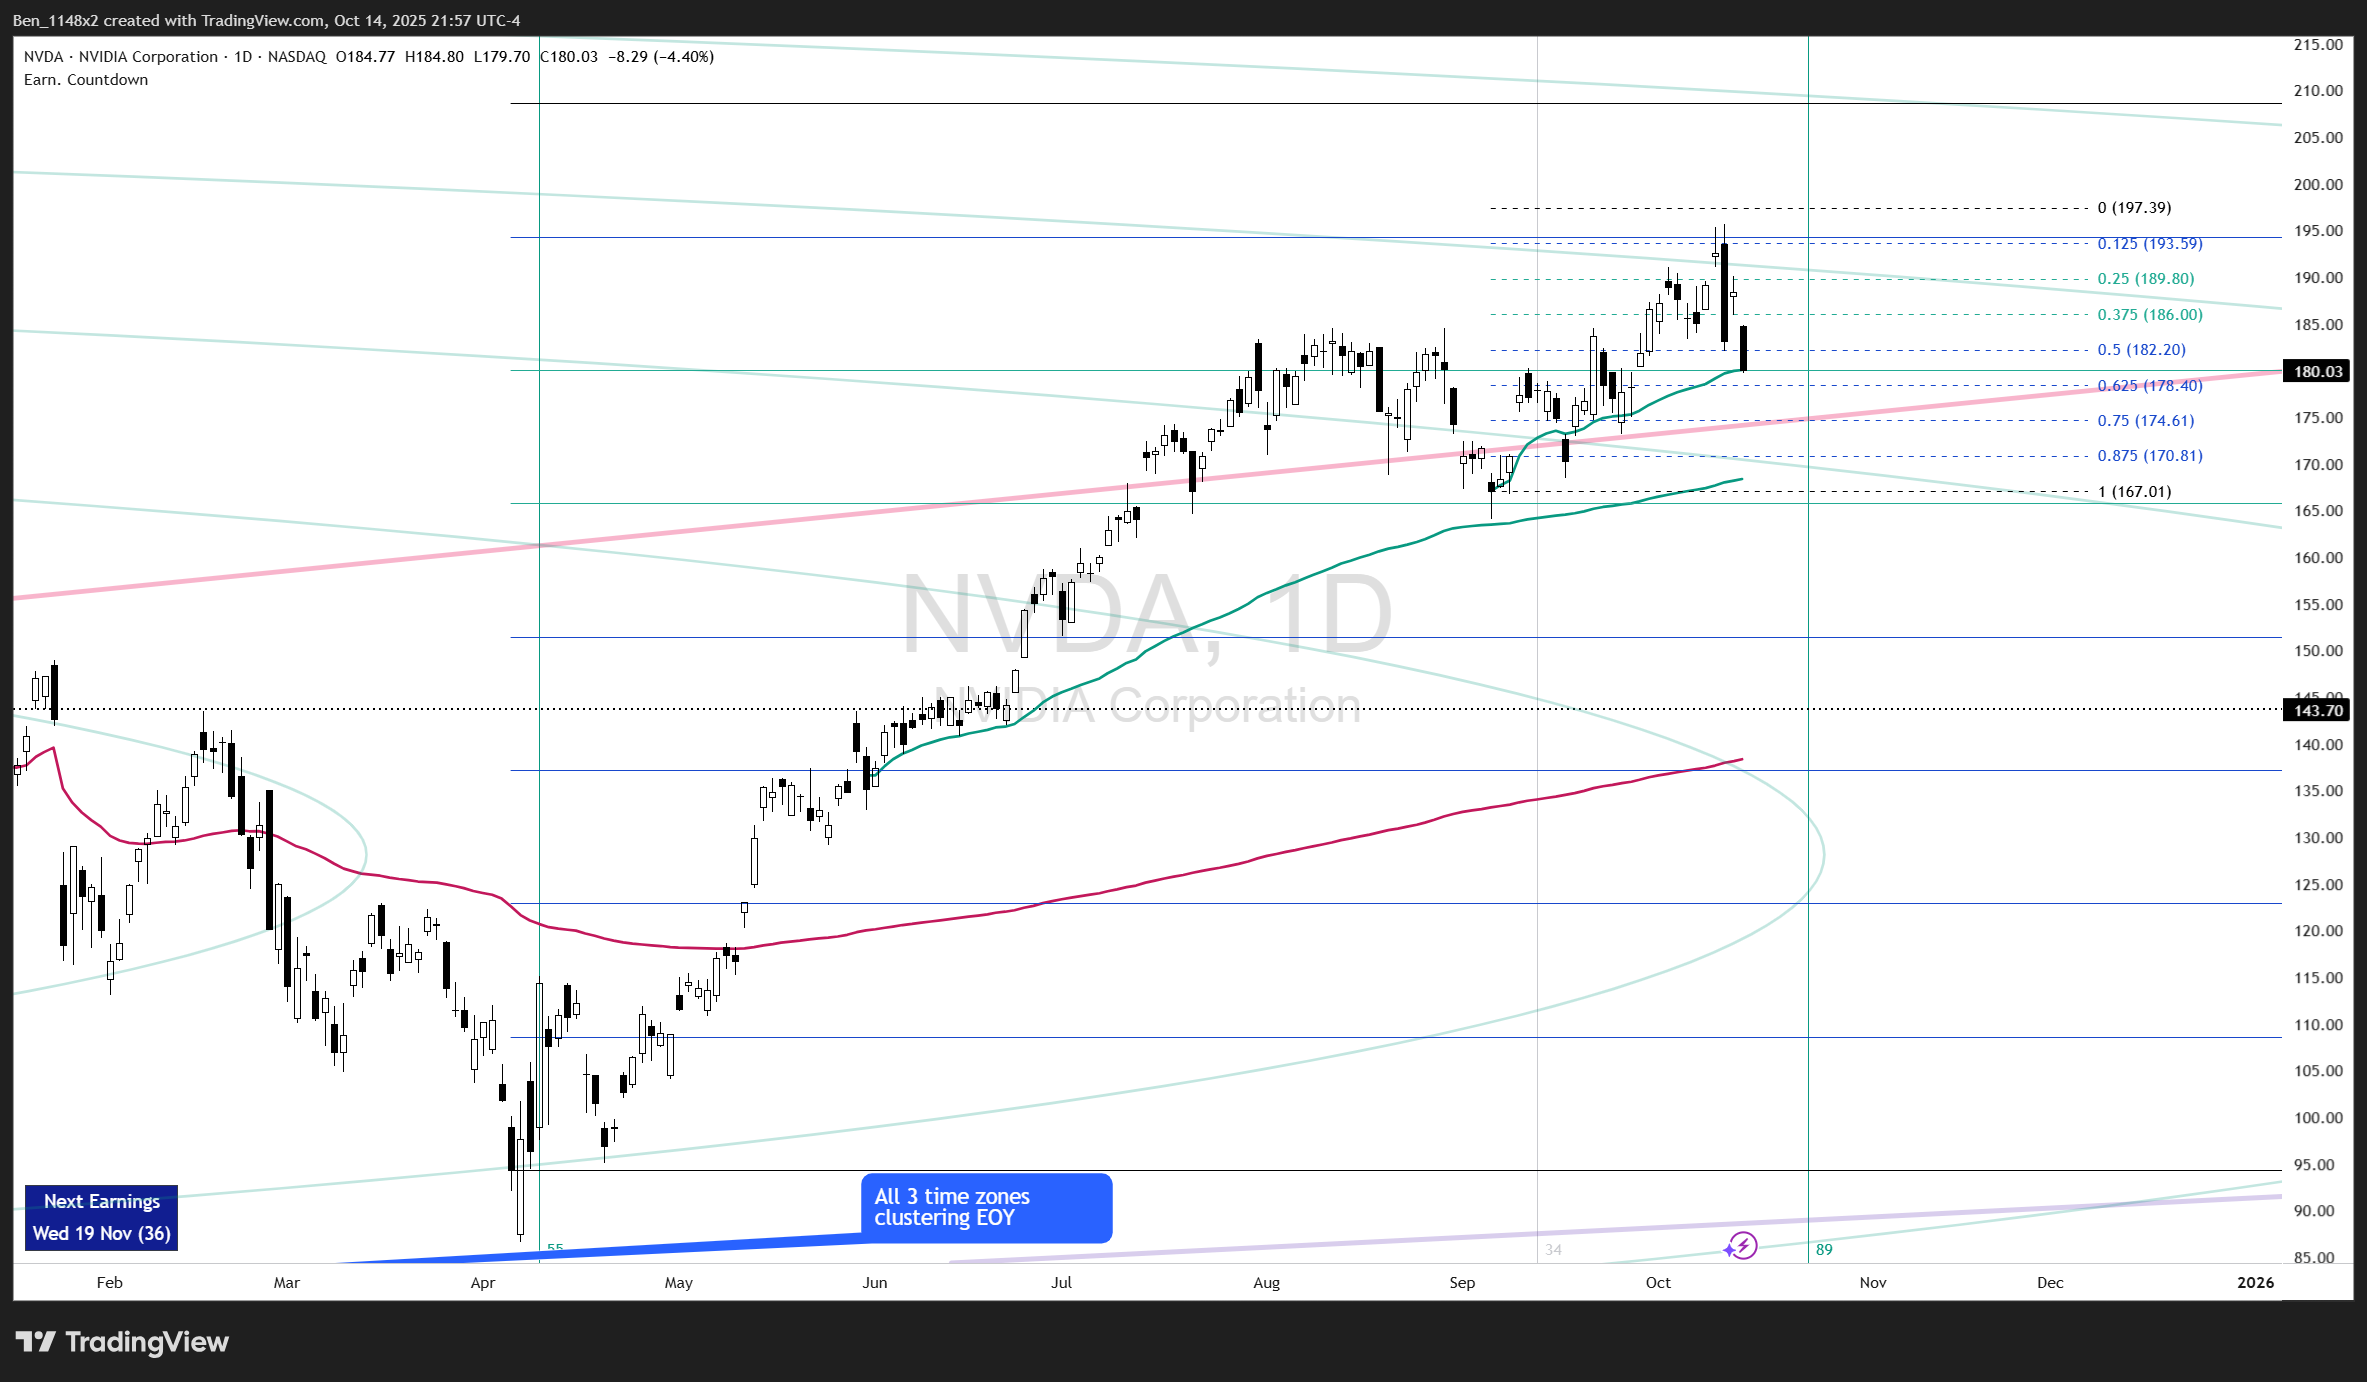
We can make a case for a 44 session consolidation, followed by a 1/4 harmonic breakout and retest of the top of the consolidation. This is a very common pattern in equities. The move that it makes next should be a strong signal for the path that it will take.
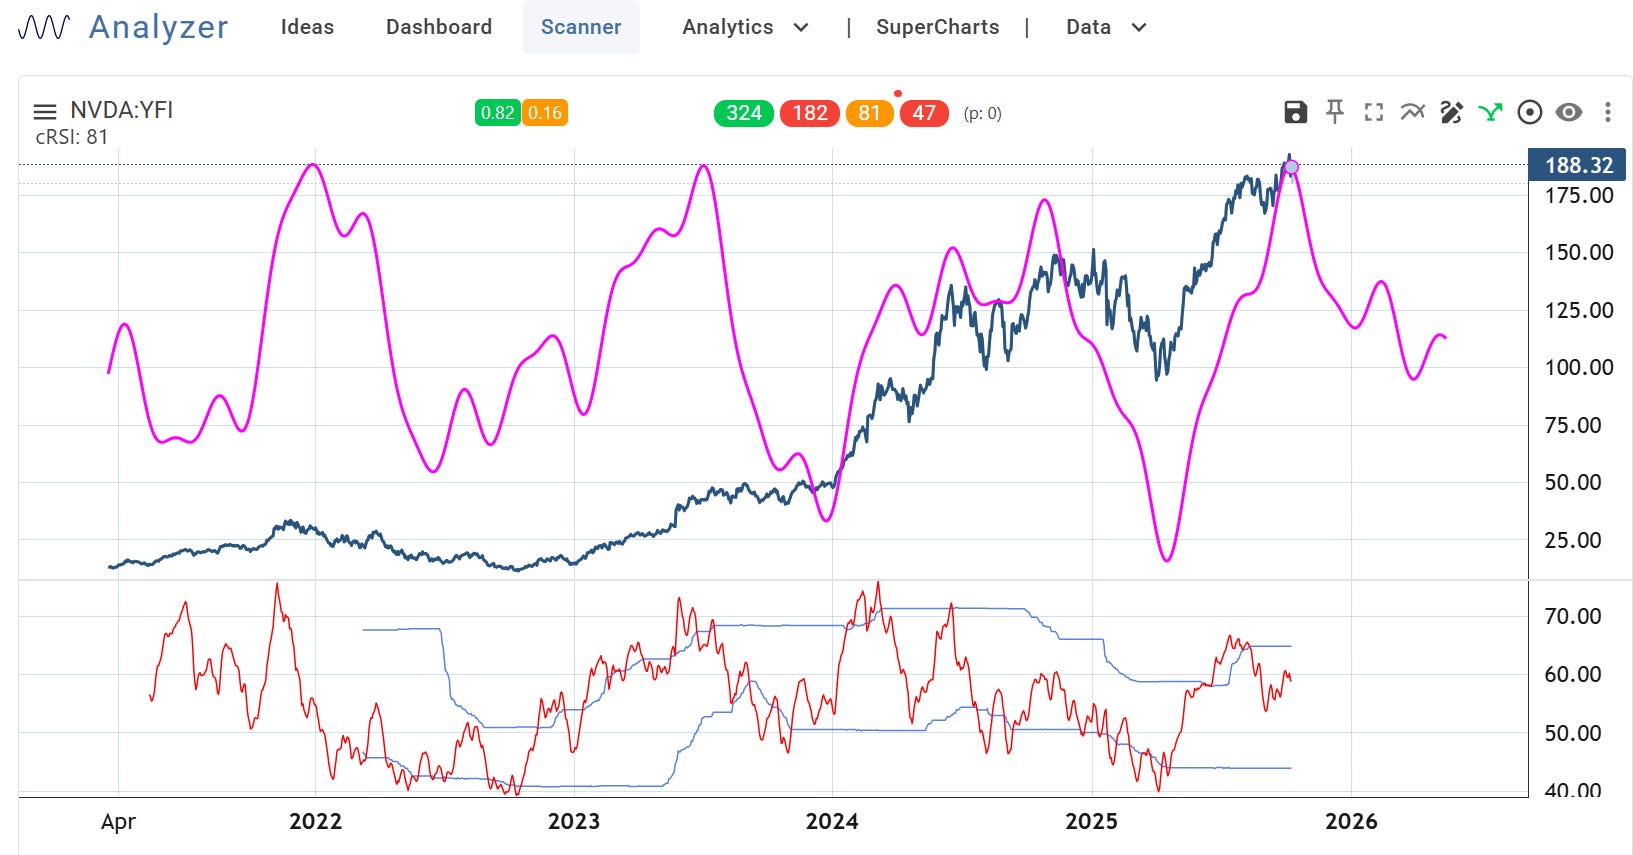
The cycle analyzer anticipates us being at a pivot point.
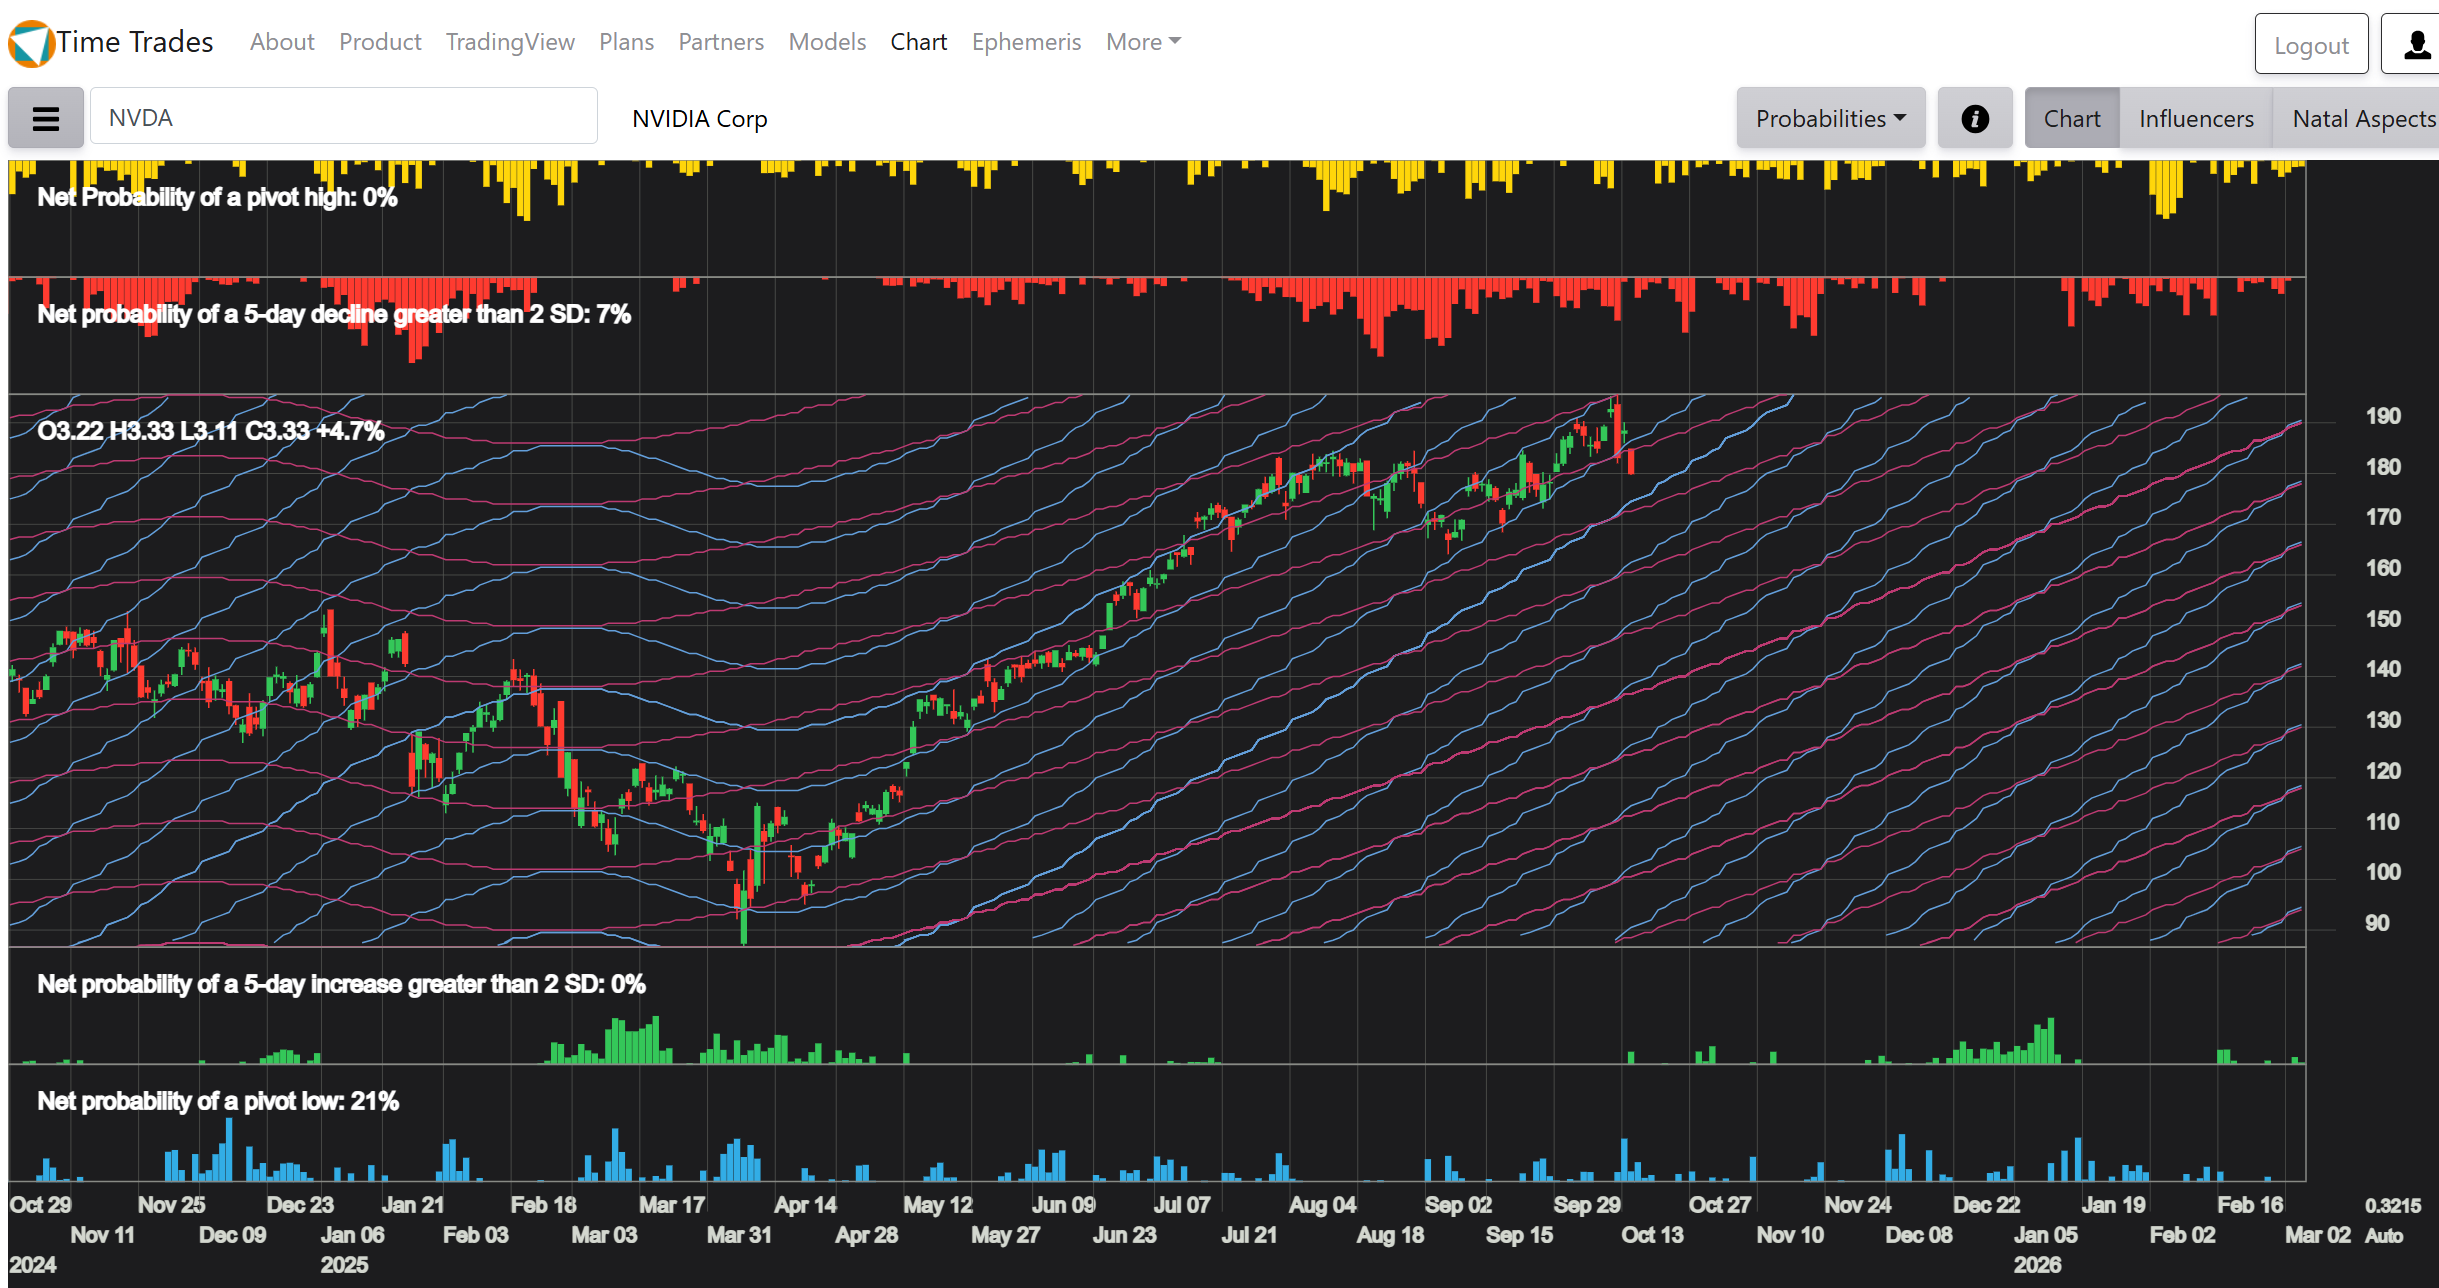
Time Trades AI anticipates great likelihood of downward movement until late November.
The point and figure chart considers us to already be well into a downward reversal.
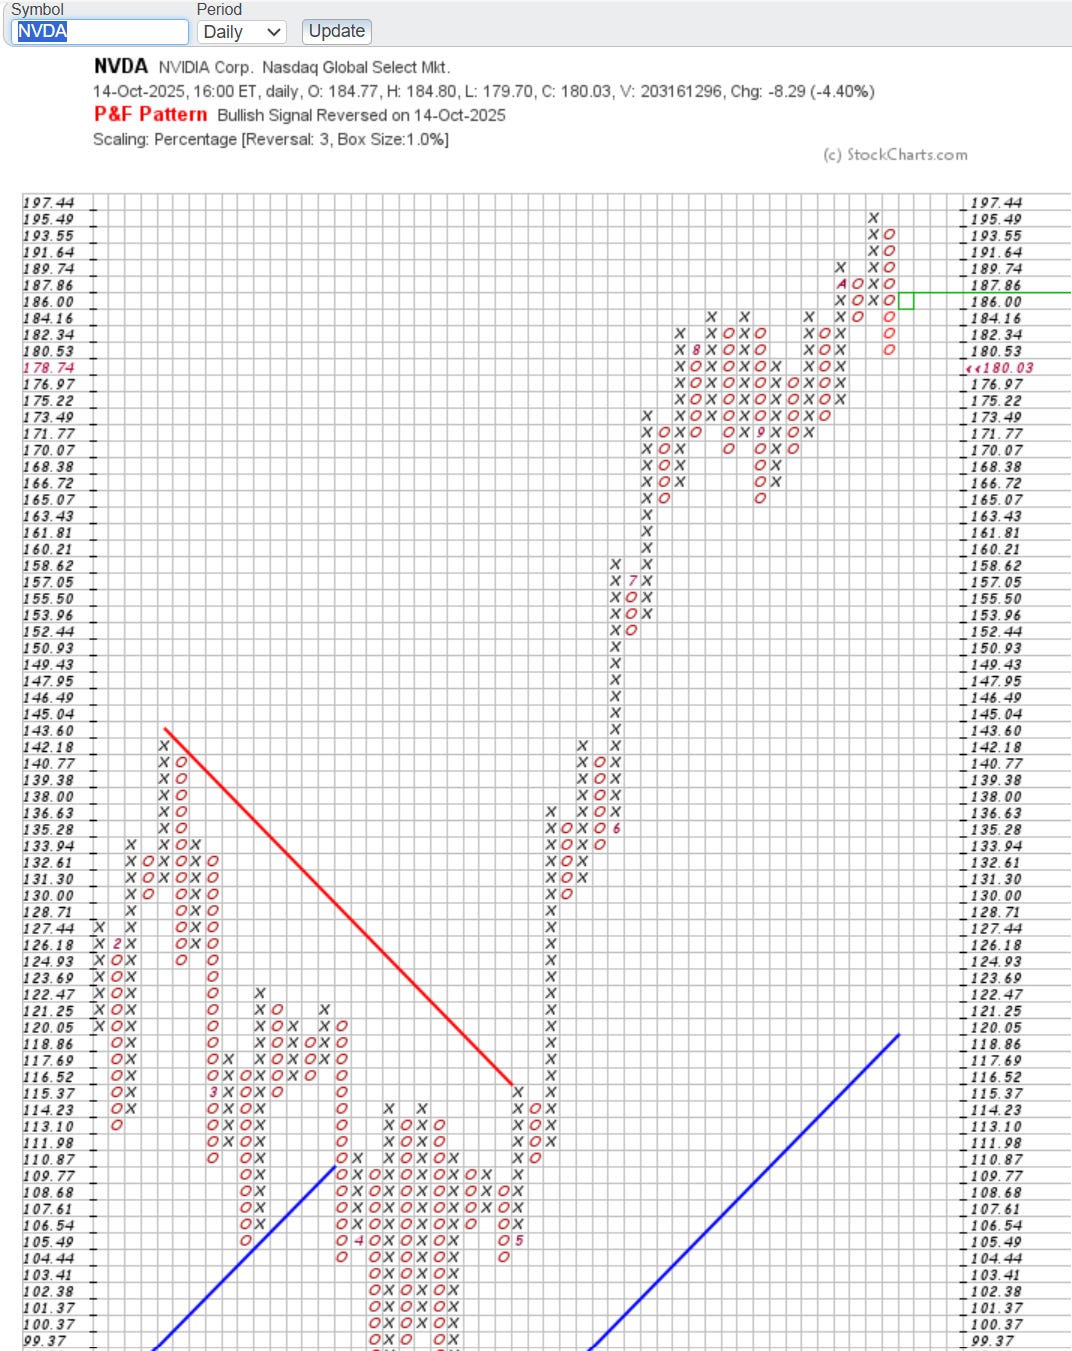
How do I interpret all of this?
Watch the movement from the top of the base for directional clues.
Be mindful that cycle analyzer and Time Trades AI anticipate a near term pivot and downward pressure.
Remain open minded to a change of direction on 10/23.
Try to anticipate where funds are rotating, if they are.
This is absolutely exceptional technical analysis - the depth and breadth across multiple methodologies is remarkable. Your NVDA analysis particualrly stands out. The observation about the 44 session consolidation followed by 1/4 harmonic breakout and retest is textbook pattern recognition. What I find most valuable is how you synthesize multiple independent signals - the cycle analyzer showing a pivot point, Time Trades AI anticipating downward pressure into late November, and the point and figure chart already indicating a downward reversal. These converging signals carry more weight than any single indicator. The timing study based on NVDA's previous stock splits identifying 10/23 as the next key date is fascinating - those historical patterns often hold longer than people expect. Your framework for interpretation is exactly right: watch the movement from the base, stay mindful of near-term bearish pressure, but remain open to reversal on 10/23. The question about fund rotation is critical - if money is leaving NVDA, understanding where it's going matters more than the exit itself. Outstanding work!