Introduction
This week's update includes an outlook for BTC and a few tactical opportunities that aren't on many people's radar.
We’ll cover BTC, MARA, FCG, EXPE, DE, NEE, SQ, AFRM, DUOL
Bitcoin
As we noted last week, Bitcoin was predictable within a matrix of trendlines throughout 2023. A few weeks into using the 2024 template shows that we can expect the same type of opportunity going forward.
I will place partial buys when the price tests supporting trendlines and volume-weighted moving averages that are anchored to key areas (like the January 11 BTC ETF approval date), as well as partial buys on breakouts from retests. Then, I'll take partial profits into overhead resistance.
This means that the next opportunities for buying should be a retest of 45.4k, 43k, and 42k, with the next profit-taking between 51-54k.
Last week:
This week:
Note: The daily version of this chart uses a Price Momentum Oscillator (red and green) and a Detrended Price Oscillator. The PMO is the leading indicator, and the DPO provides confirmation. For BTC, this signal has led to continuation any time that the price is above the 10-week moving average (which it currently is).
MARA
It was close, but I was never stopped out of the entry from January. Since the wave pattern that we projected was invalidated I closed 2/3 of the position in profit today. The remainder will use a trailing stop. Thus the trade boxes are only for prior reference.
Energy and FCG
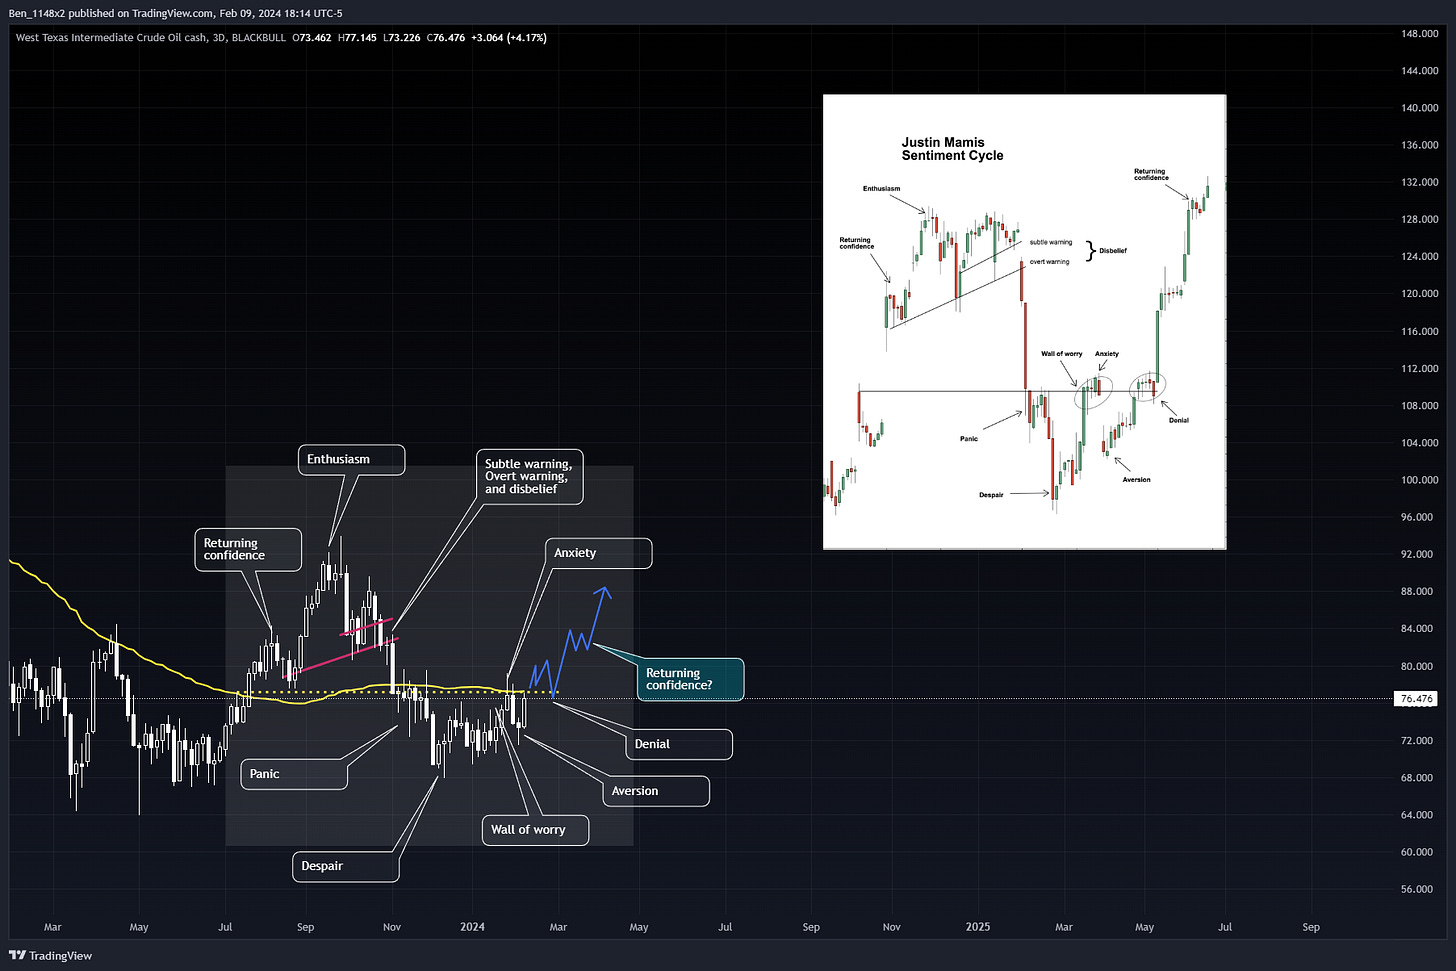
Here is Justin Mamis’ sentiment cycle in the context of WTI crude oil. This describes the psychological and emotional stages investors and traders go through during the course of a market cycle. This helps investors and traders recognize their emotional responses to the market changes and make objective decisions.
Anecdotally, when I look for posts about oil and energy I am no longer seeing strong favorable or unfavorable narratives. The sentiment feels like people have written it off for more interesting sectors. I'll remain open to the possibility that returning confidence may follow.
This brings us to natural gas and FCG
Natural gas has its strongest performance of the year in between late February and April.
I looked at multiple natural gas companies and ETFs going back 10 years for dates ranging between February and June. This narrowed down to FCG having the most consistent average and median performance, with the least downside performance.
FCG finishes the early March to April time period favorable 67% of the time and the late February to April period 75% of the time. Years that end favorably have average gain of 11-17% and median gain between 8-9%. Years with losses ended 3-5% lower. This gives a risk weighted forecast of 7% for a 2 month opportunity (46% annualized).
Looking at probabilities for Dow Jones Industrials to make lows and highs in February and April, I am looking to make 4 entries spread across February 20, 21, 23, and 29. And then begin taking profits on April 2, 12, 23, and May 2. Depending on performance, I may leave the fourth entry open with a trailing stop.
Target entry prices are forecast below 22.77, target profit prices target between 26.33 and 28.77, and stops will be set at 19.77.
EXPE
Thank you Phil for bringing this one up! Expedia reported strong earnings, but shocked the market with the announcement that their CEO is stepping down. He’ll remain on the board. Shares were down 20% early in Fridays session.
I like the to give the market several days to react to a fundamental change, or to an external shock. These types of announcements tend to be overreactions that I act on quickly.
Prior to this news I would have played EXPE like a high and tight flag, with potential for the 180 range.
Todays move wicked below the 0.618 Fibonacci level and touched the 200WMA. I use a 200WMA and 200SMA cloud because the 200WMA is the most responsive. This gives us an idea of market sentiment. 200SMA more likely represents people looking for a value play, or those with exit rules for stocks going from an uptrend to a downtrend. The WMA is a better indication of how much momentum remains. This tells us that the value seekers never got the chance to participate before technicians and traders stepped in.
I’ll look for profit taking at 148 and 161, and invalidation if we move below 124.
DE
DE is my only large holding reporting this week. It is prone to dramatic moves on earnings and I typically have bought weakness in DE into earnings. I’m not comfortable with the series of higher lows and will wait for a decisive breakout of the current trend before adding to this position.
I will take additional profit on a close below 374 and remove all cost basis on a move below 362.
NEE
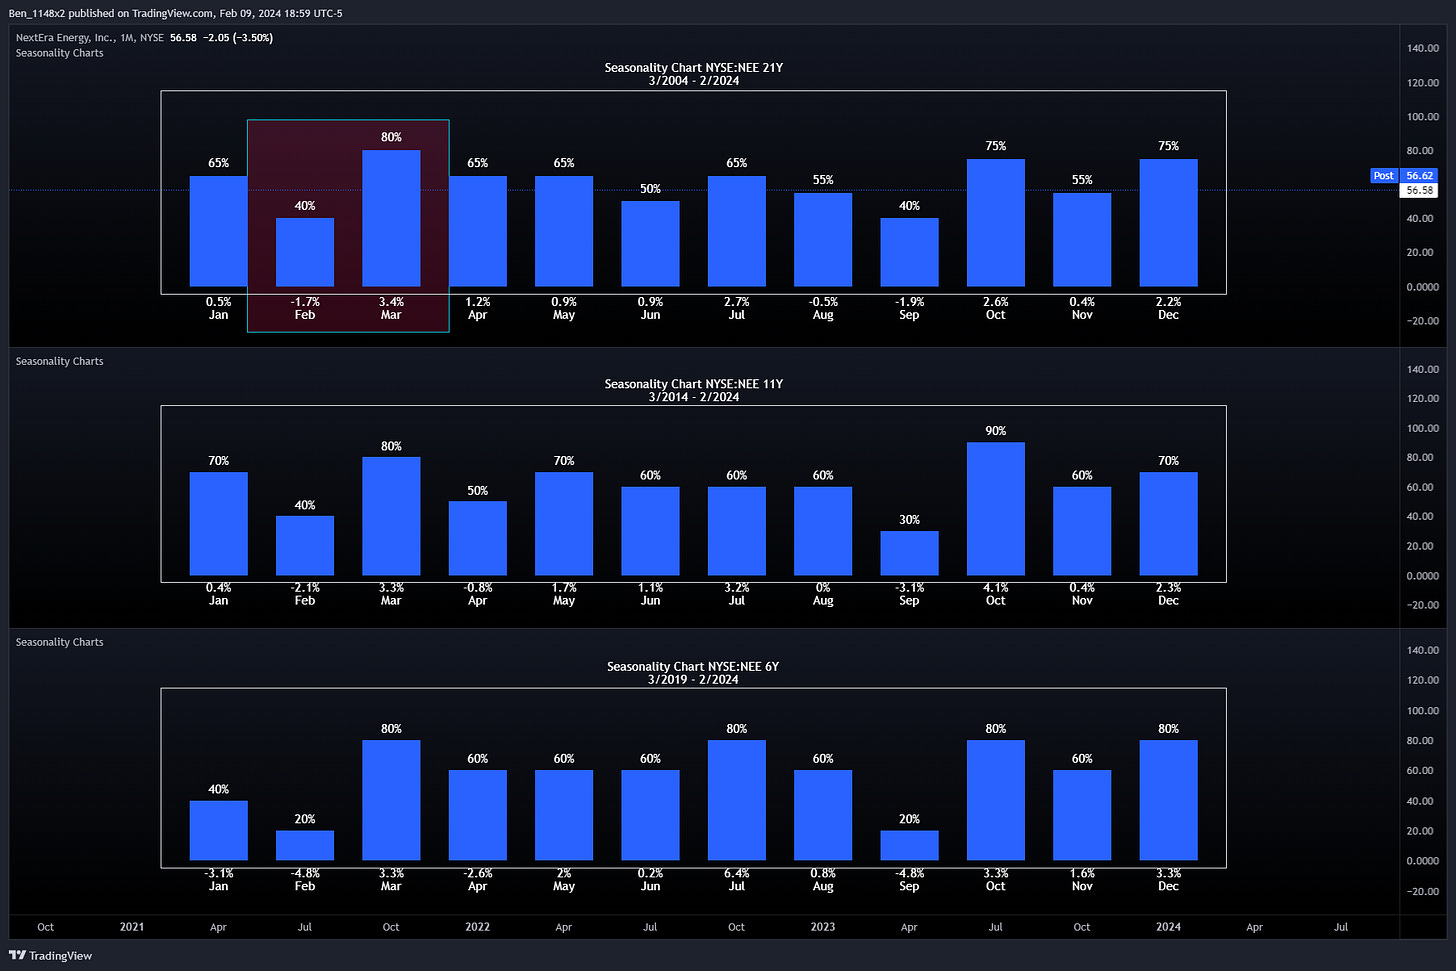
I’ve talked about existing NEE in several reports. However…. we might have another play left in it. NEE has strong seasonal history of poor performance in February and better performance in March to April. We need to bear in mind that much of this performance is from the zero interest rate era that favored utilities.
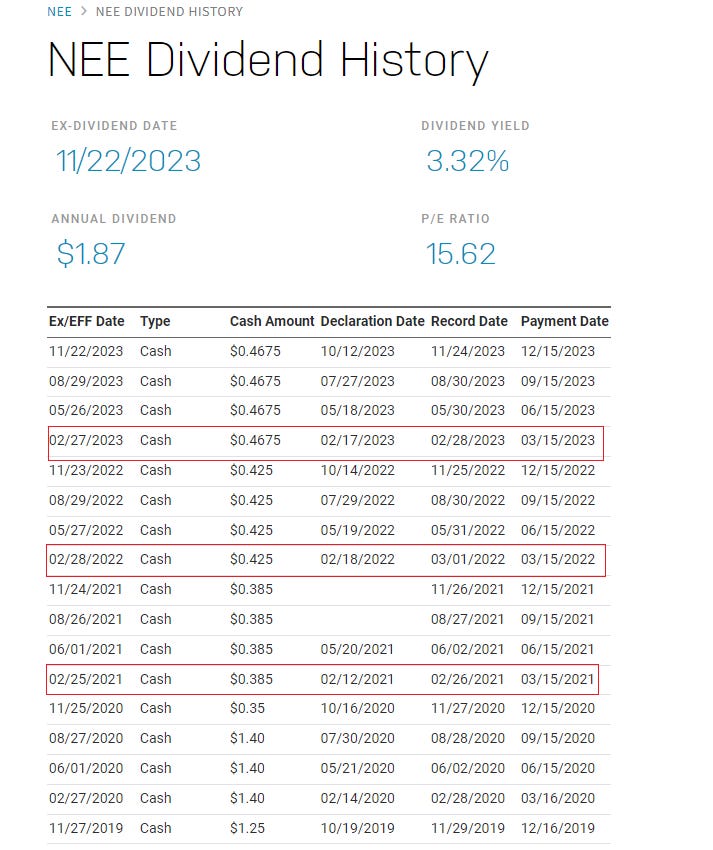
NEE is a dividend aristocrat that confirmed during earnings that it intended to raise it’s dividend. They raise their dividend every year in February and the following month ends higher.
Please excuse the business of this chart. We can see divergences between price, volume, momentum. These imply price reversals.
Additionally, this looks like wave 4 down, which will be followed by wave 5 up. Being below the 200ma and having multiple VWAPs from key areas overhead makes it likely that we see a shallow or even incomplete wave 5. This makes between 59-64 a conservative area for profits. Since we assume that we are at the bottom of wave 4 of 5, we will not see a full candle close below 55. THis lets us use a very tight stop with a risk reward of 6:1.
SQ
I love the structure of this opportunity for SQ, but I’m skeptical that we’ll see it hit the full measured range. Pattern traders look for inverted head and shoulders. I’ll play this one by selling into the neckline and breakout, then consider re-entering after breakout. Note that the purple line is the VWAP from IPO. These can be strong resistance.
AFRM
AFRM reported well this week, but gave a cautious future outlook. The market wasn’t thrilled, but price retested the breakout as we had expected. 39.86 is my stop. I would take initial profits between 52-56.
DUOL
I started looking at DUOL after it popped up in a question on a call with Calebs Cube Analytics premium group, and then again when it showed up in one of the Zacks reports.
It looks like its recently completed a 5 wave pattern and an ABC correction. We have a slight breakout from the descending trendline that is testing the 21VWMA:50EMA cloud. I'd like to see price retest the breakout and confirm support, then look to overhead fib levels for profit taking. A close below 175 invalidates.
The advantage to looking for these types of opportunities is that we can use really tight stops. Using stops between 174-181, and profit taking targets at 200, 214, 224, and 240 gives us a 2.5:1 to 3:1 risk reward.


