
The Setup Into NVDA and Thanksgiving
SPX BTC Gold NVDA AKAM UGA UNG OIH DBE IXC NVGS EXE LLY VXTX KIE

Introduction
Markets are juggling thin economic data, shifting rate cut odds, and an important earnings week that will matter more than the macro noise.
NVDA’s print sits at the center of the week. At the same time, AI driven capex remains the engine of the current cycle, and the ongoing skepticism of an AI bubble continues to work in our favor. Add in potential for government reopening to gradually improve liquidity, and we’re entering a stretch where the setup can change quickly.
Macroeconomic Updates
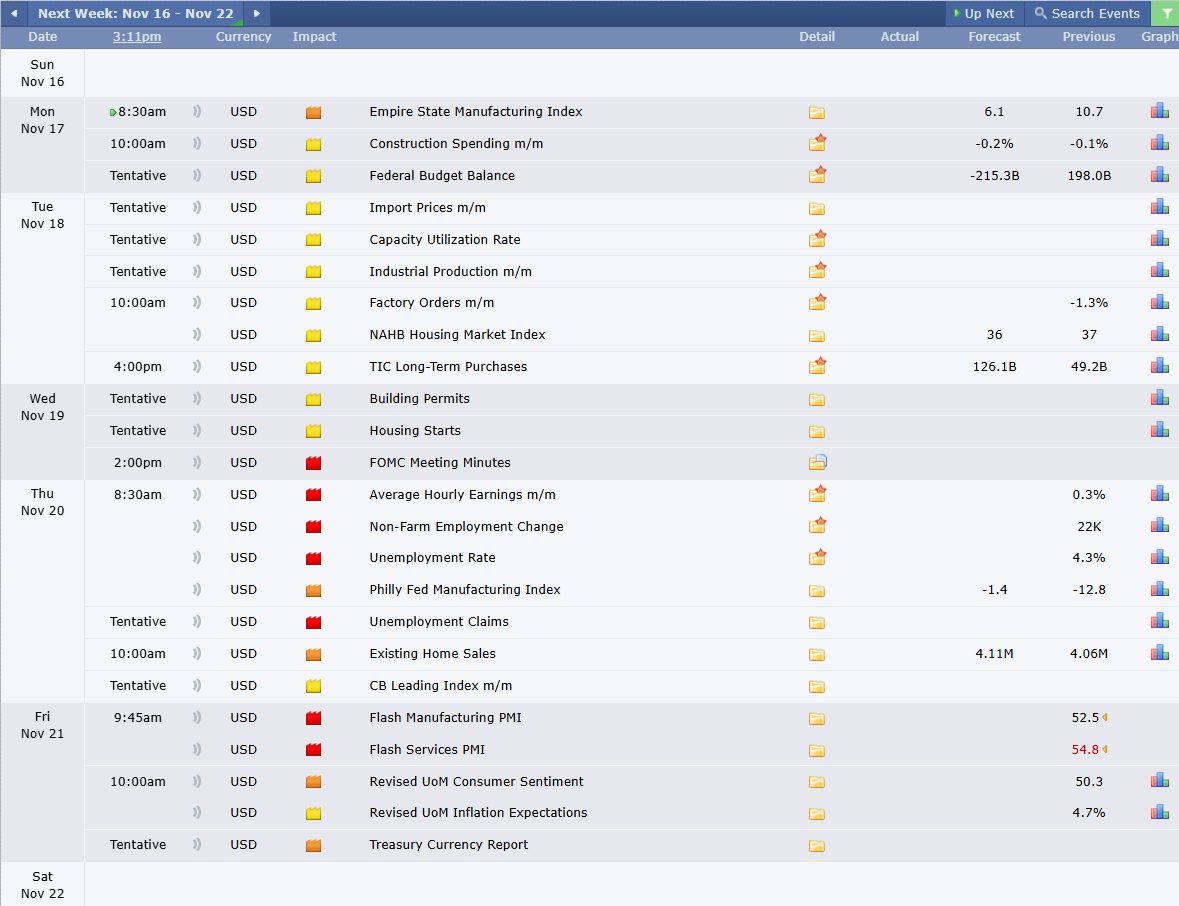
Economic data remained limited this week, but should start to become available. We might see market reaction as historical data is produced.
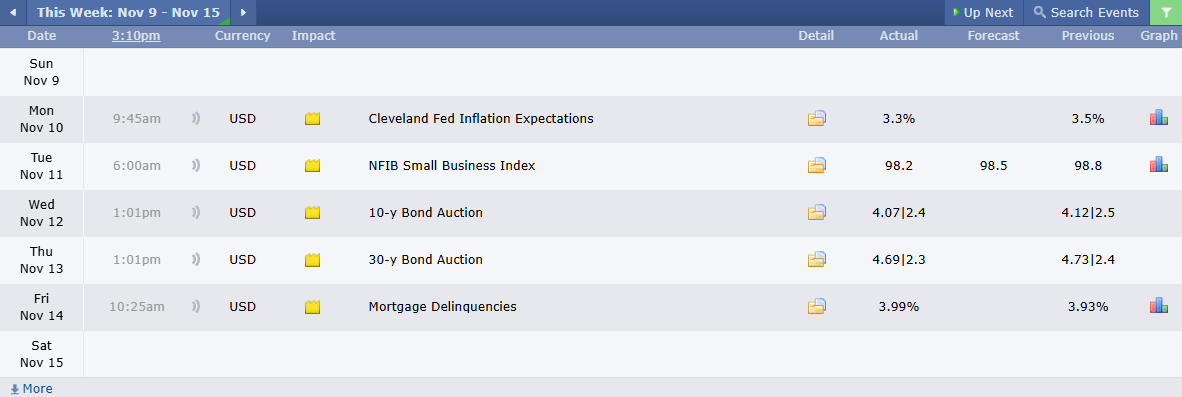
This week we have updates for employment, housing, and PMI. The FOMC minutes likely get a little attention as the market looks for more insight on the likelihood of a December rate cut.
Earnings
I’m moving the Earnings Whispers earnings calendar up to this section so that the calendars are closer together. Last week we saw a number of the high beta and short squeezed companies report, with many of them retracing.
This week we have a number of consumer discretionary and staples companies reporting. NVDA reports on Wednesday. Their results are likely to be a market mover.

AI Infrastructure and Capex
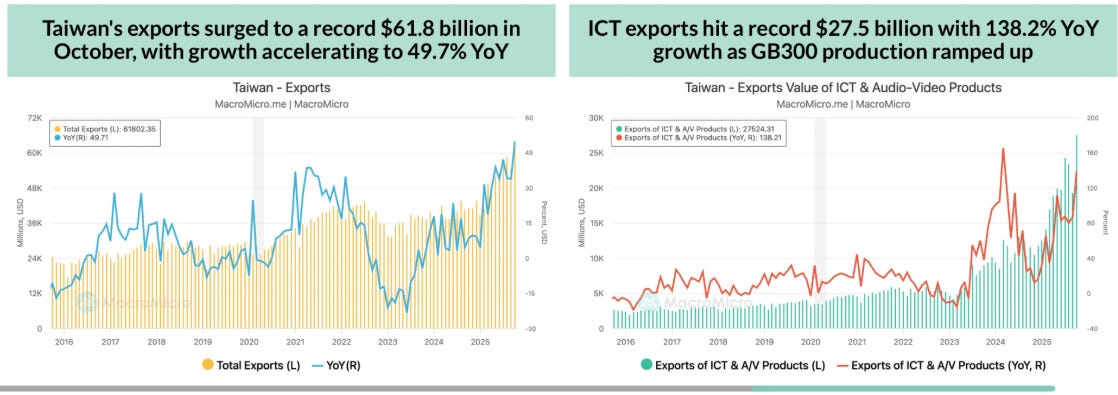
We continue to hear about the AI bubble. As long as Taiwan exports and AI infrastructure spend continue to grow, the skepticism will be an advantage to us.
Other Catalysts
Additional catalysts to keep on our radar:
Tariff and trade tensions seem to have normalized and moved to the backburner.
Clearing the backlog of economic data could reveal surprises.
Government re-opening initially felt like a sell the news event. However, this should start to improve liquidity conditions.
Market Analysis
Trend Health
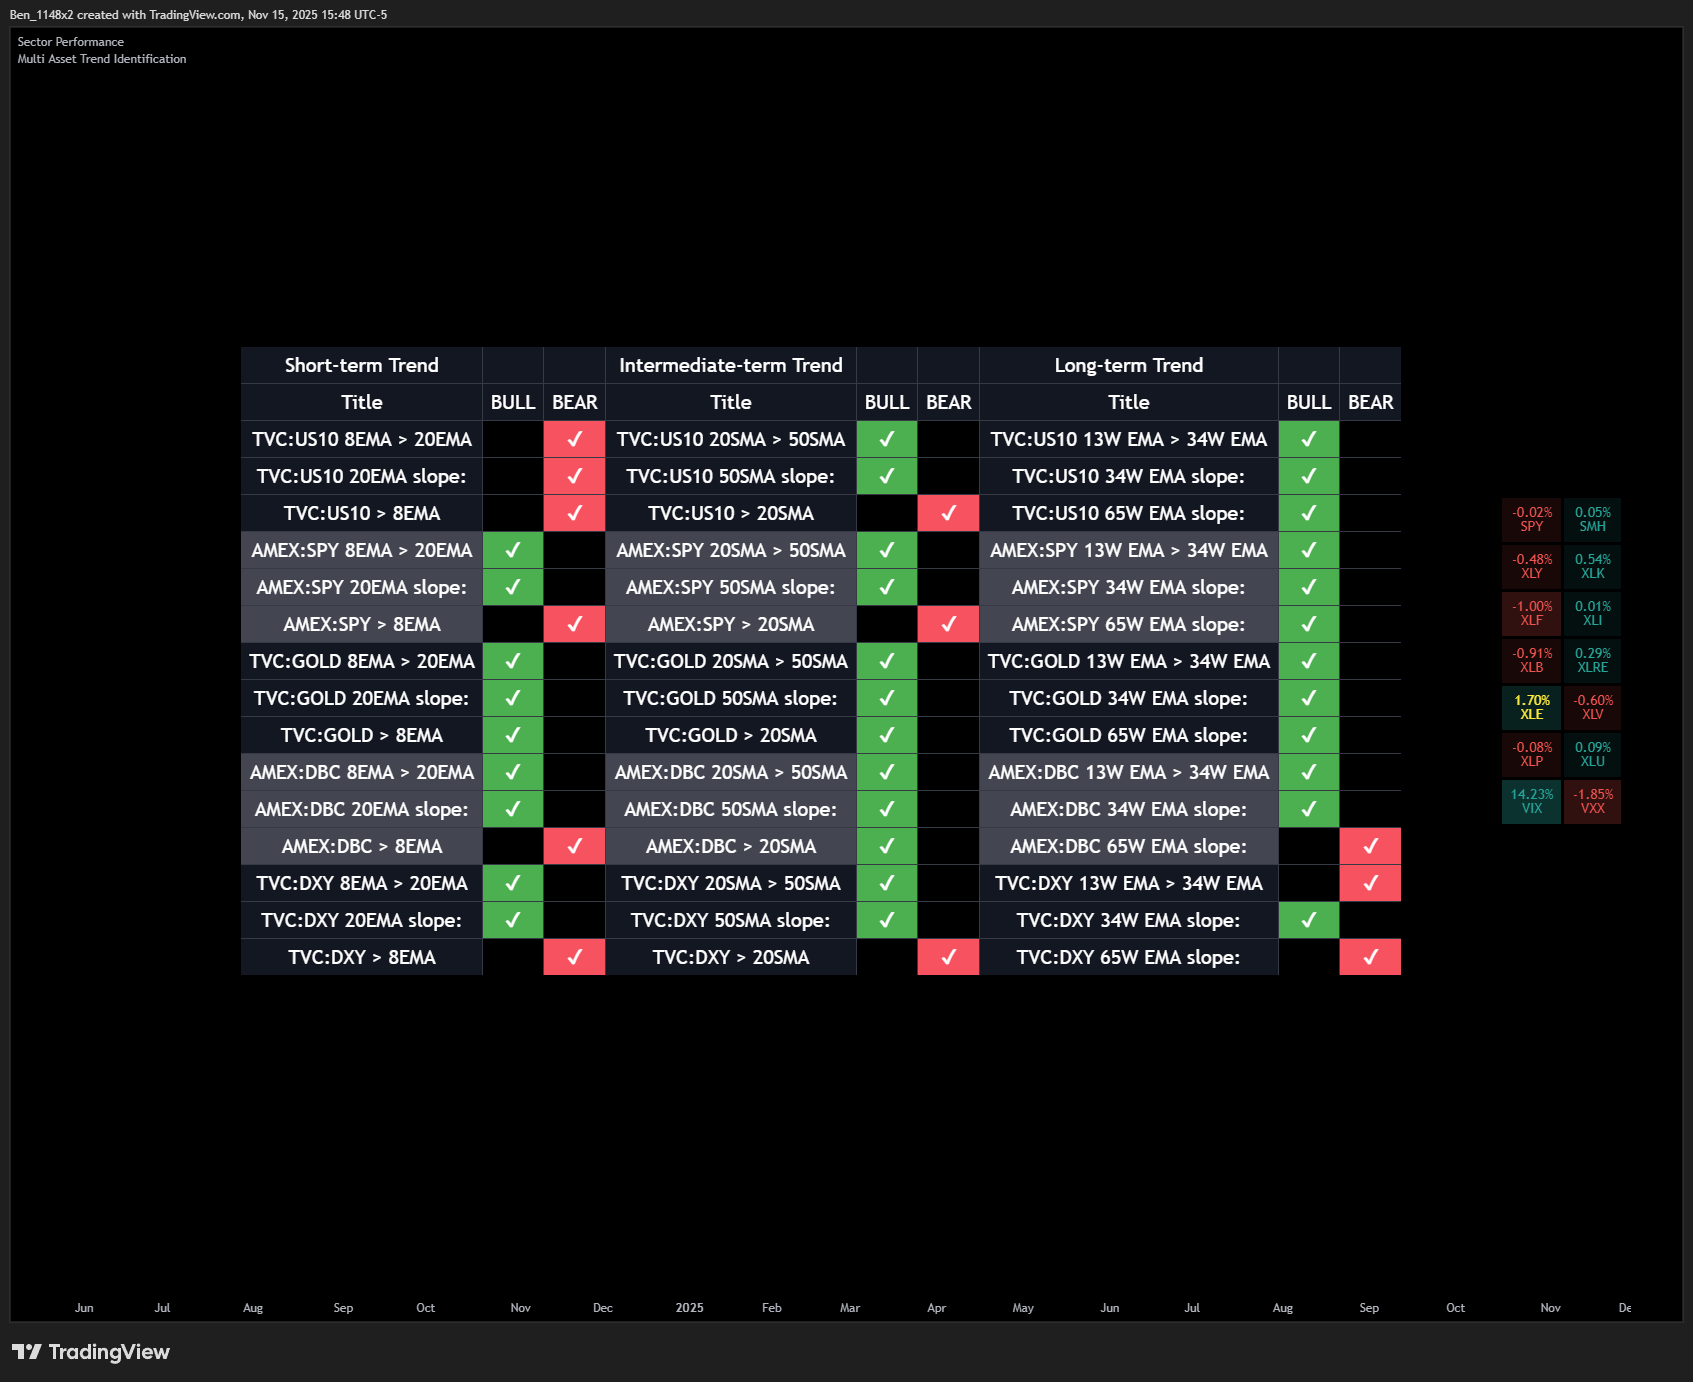
The current trend heatmap continues to show the topping sequence that I’ve previously discussed: markets topping in the order of treasuries > equities > commodities > DXY.
Treasuries are weakest in the short term, equities showing similar strength to commodities, gold strongest in all time frames, and DXY weakest in the long-term.
Market Timing Signals
Despite a volatile week, the market timing signals remain overwhelmingly bullish and have improved from the beginning of the month.
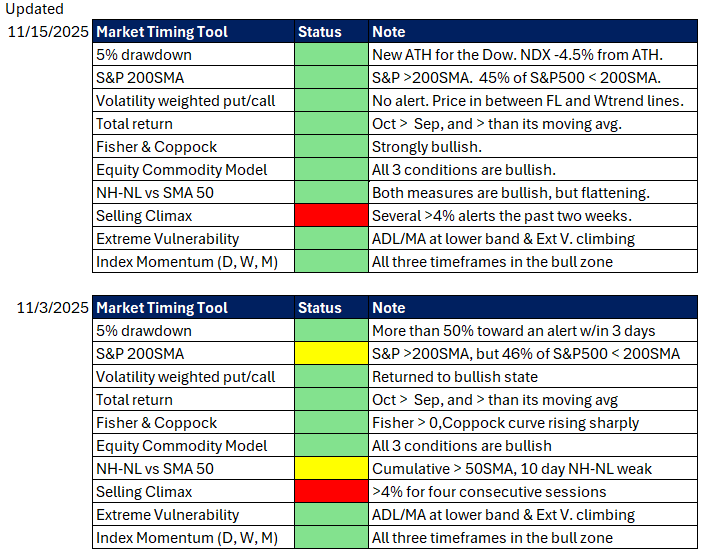
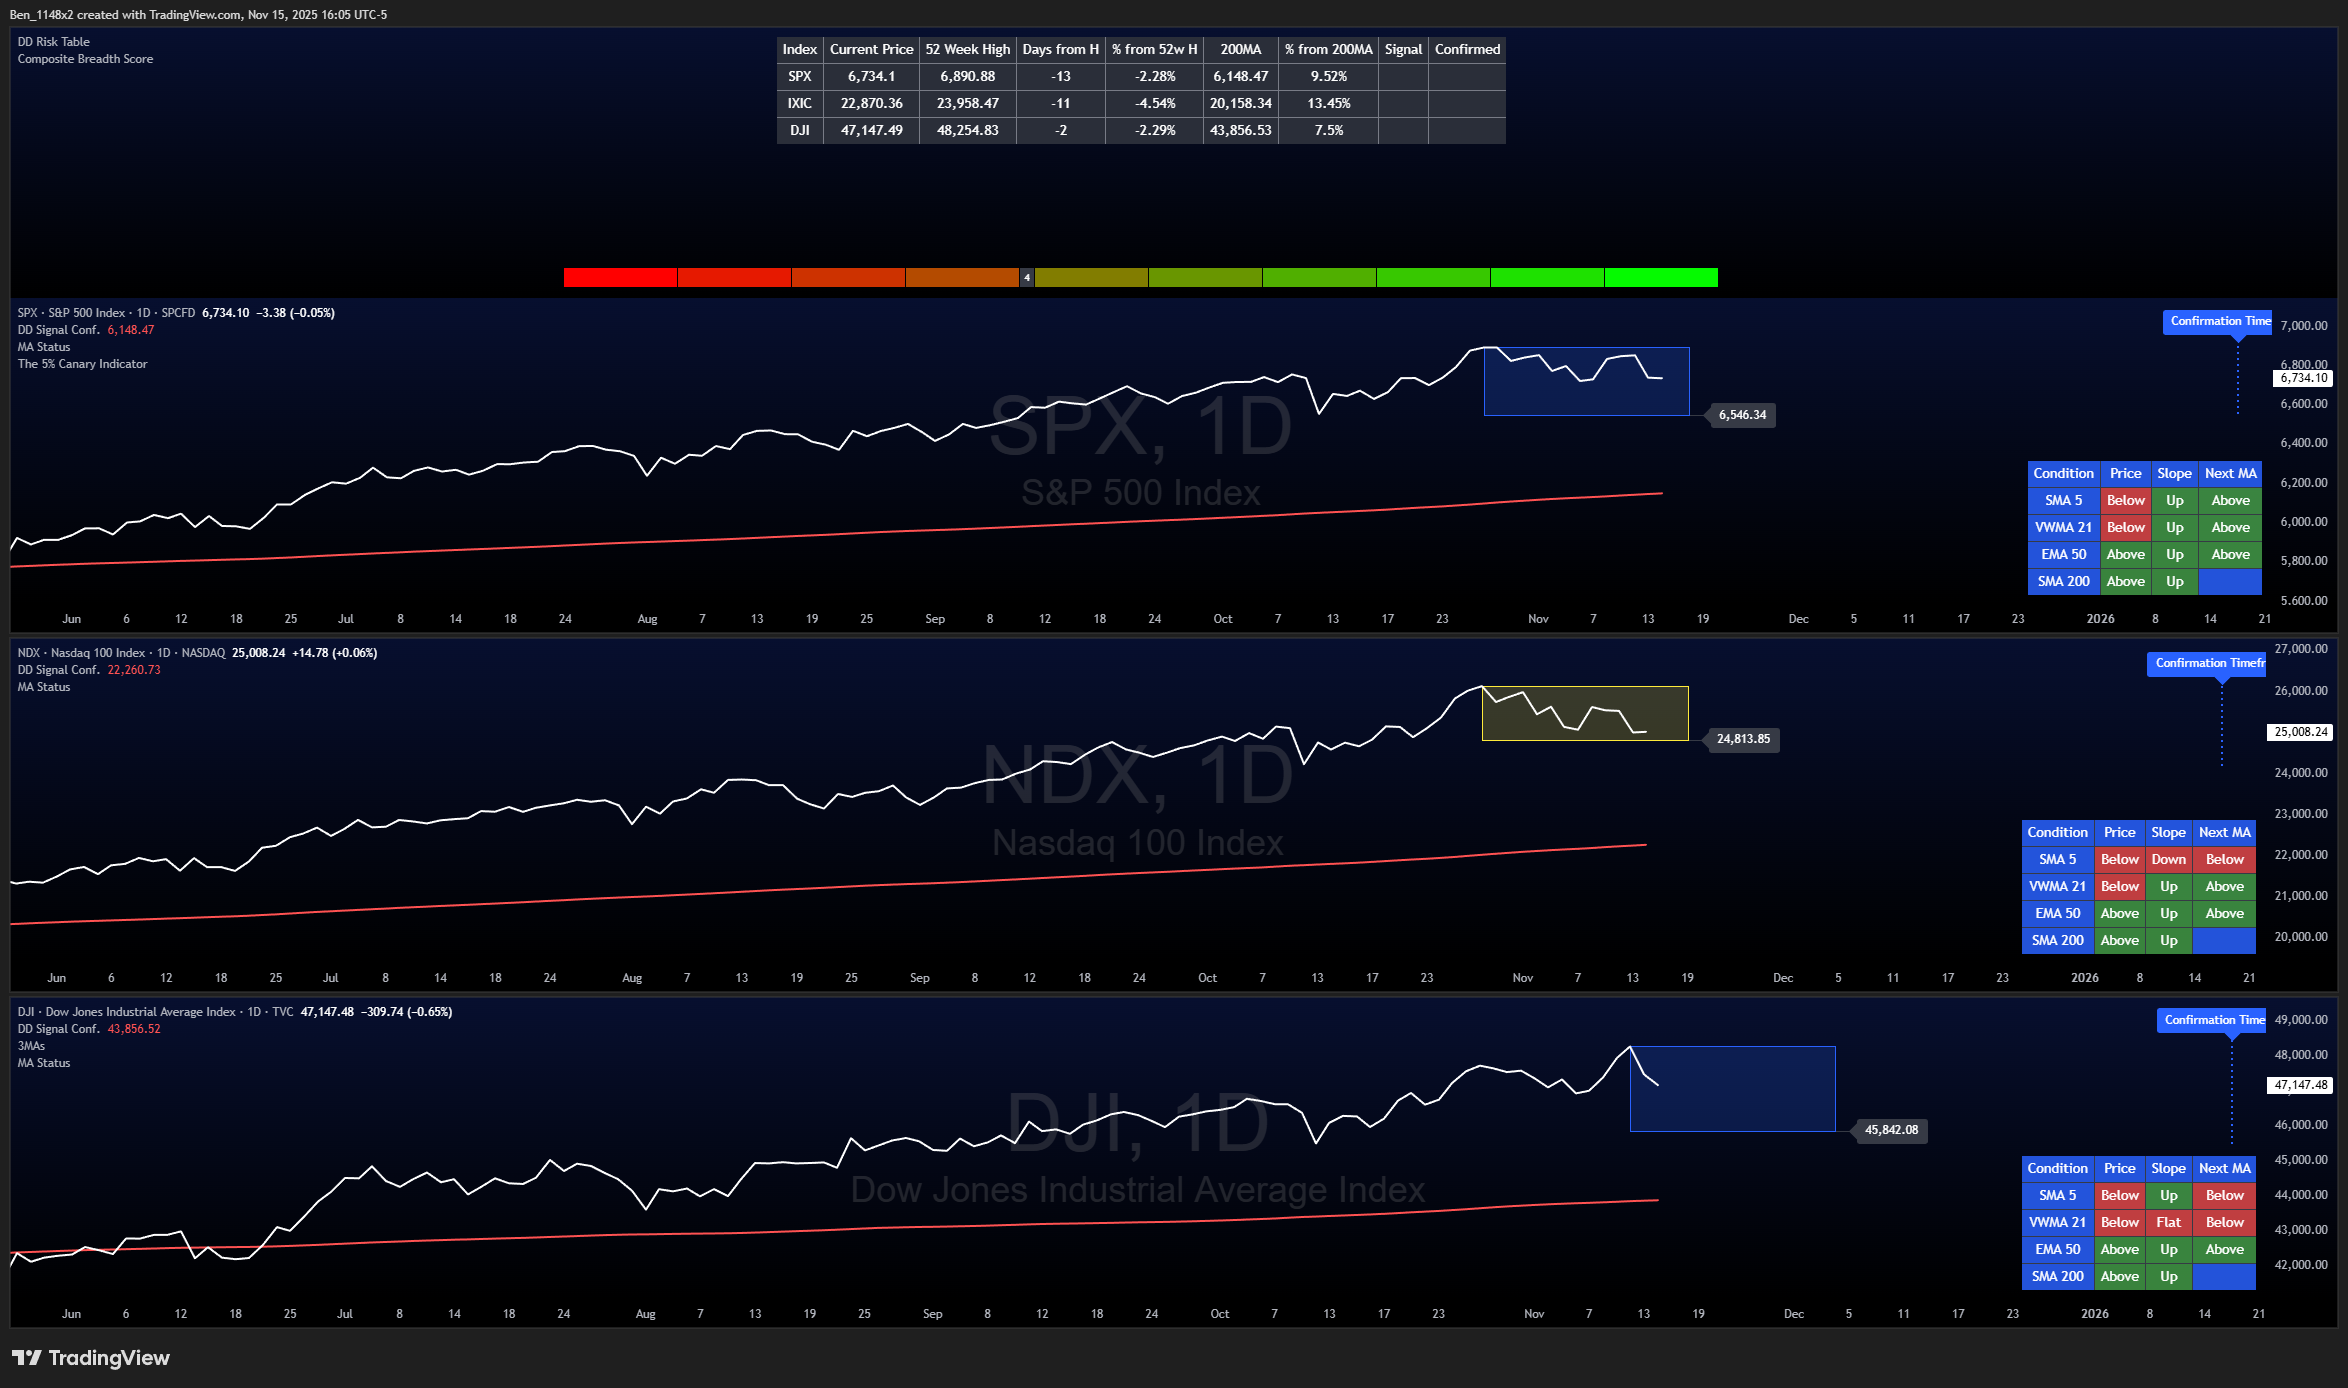
5% Drawdown Alert
The Dow made a new all time high on 11/12 and retraced 2.3%. The Nasdaq (down 4.5% from all time high) is closest to triggering a 5% drawdown alert. The S&P is now 13 sessions from its all time high and down 2.3%. Alerts will be triggered if:
S&P is below 6546 before Tuesday 11/18.
Nasdaq is below 24,814 before Wednesday 11/19 (day that NVDA reports earnings).
Dow is below 45,842 by 12/4.
Recall that alerts are then confirmed if we see two consecutive closes below the 200SMA within 42 sessions from the alert. If we clear the above dates without an alert I will consider it safe to buy retraces to key support levels.
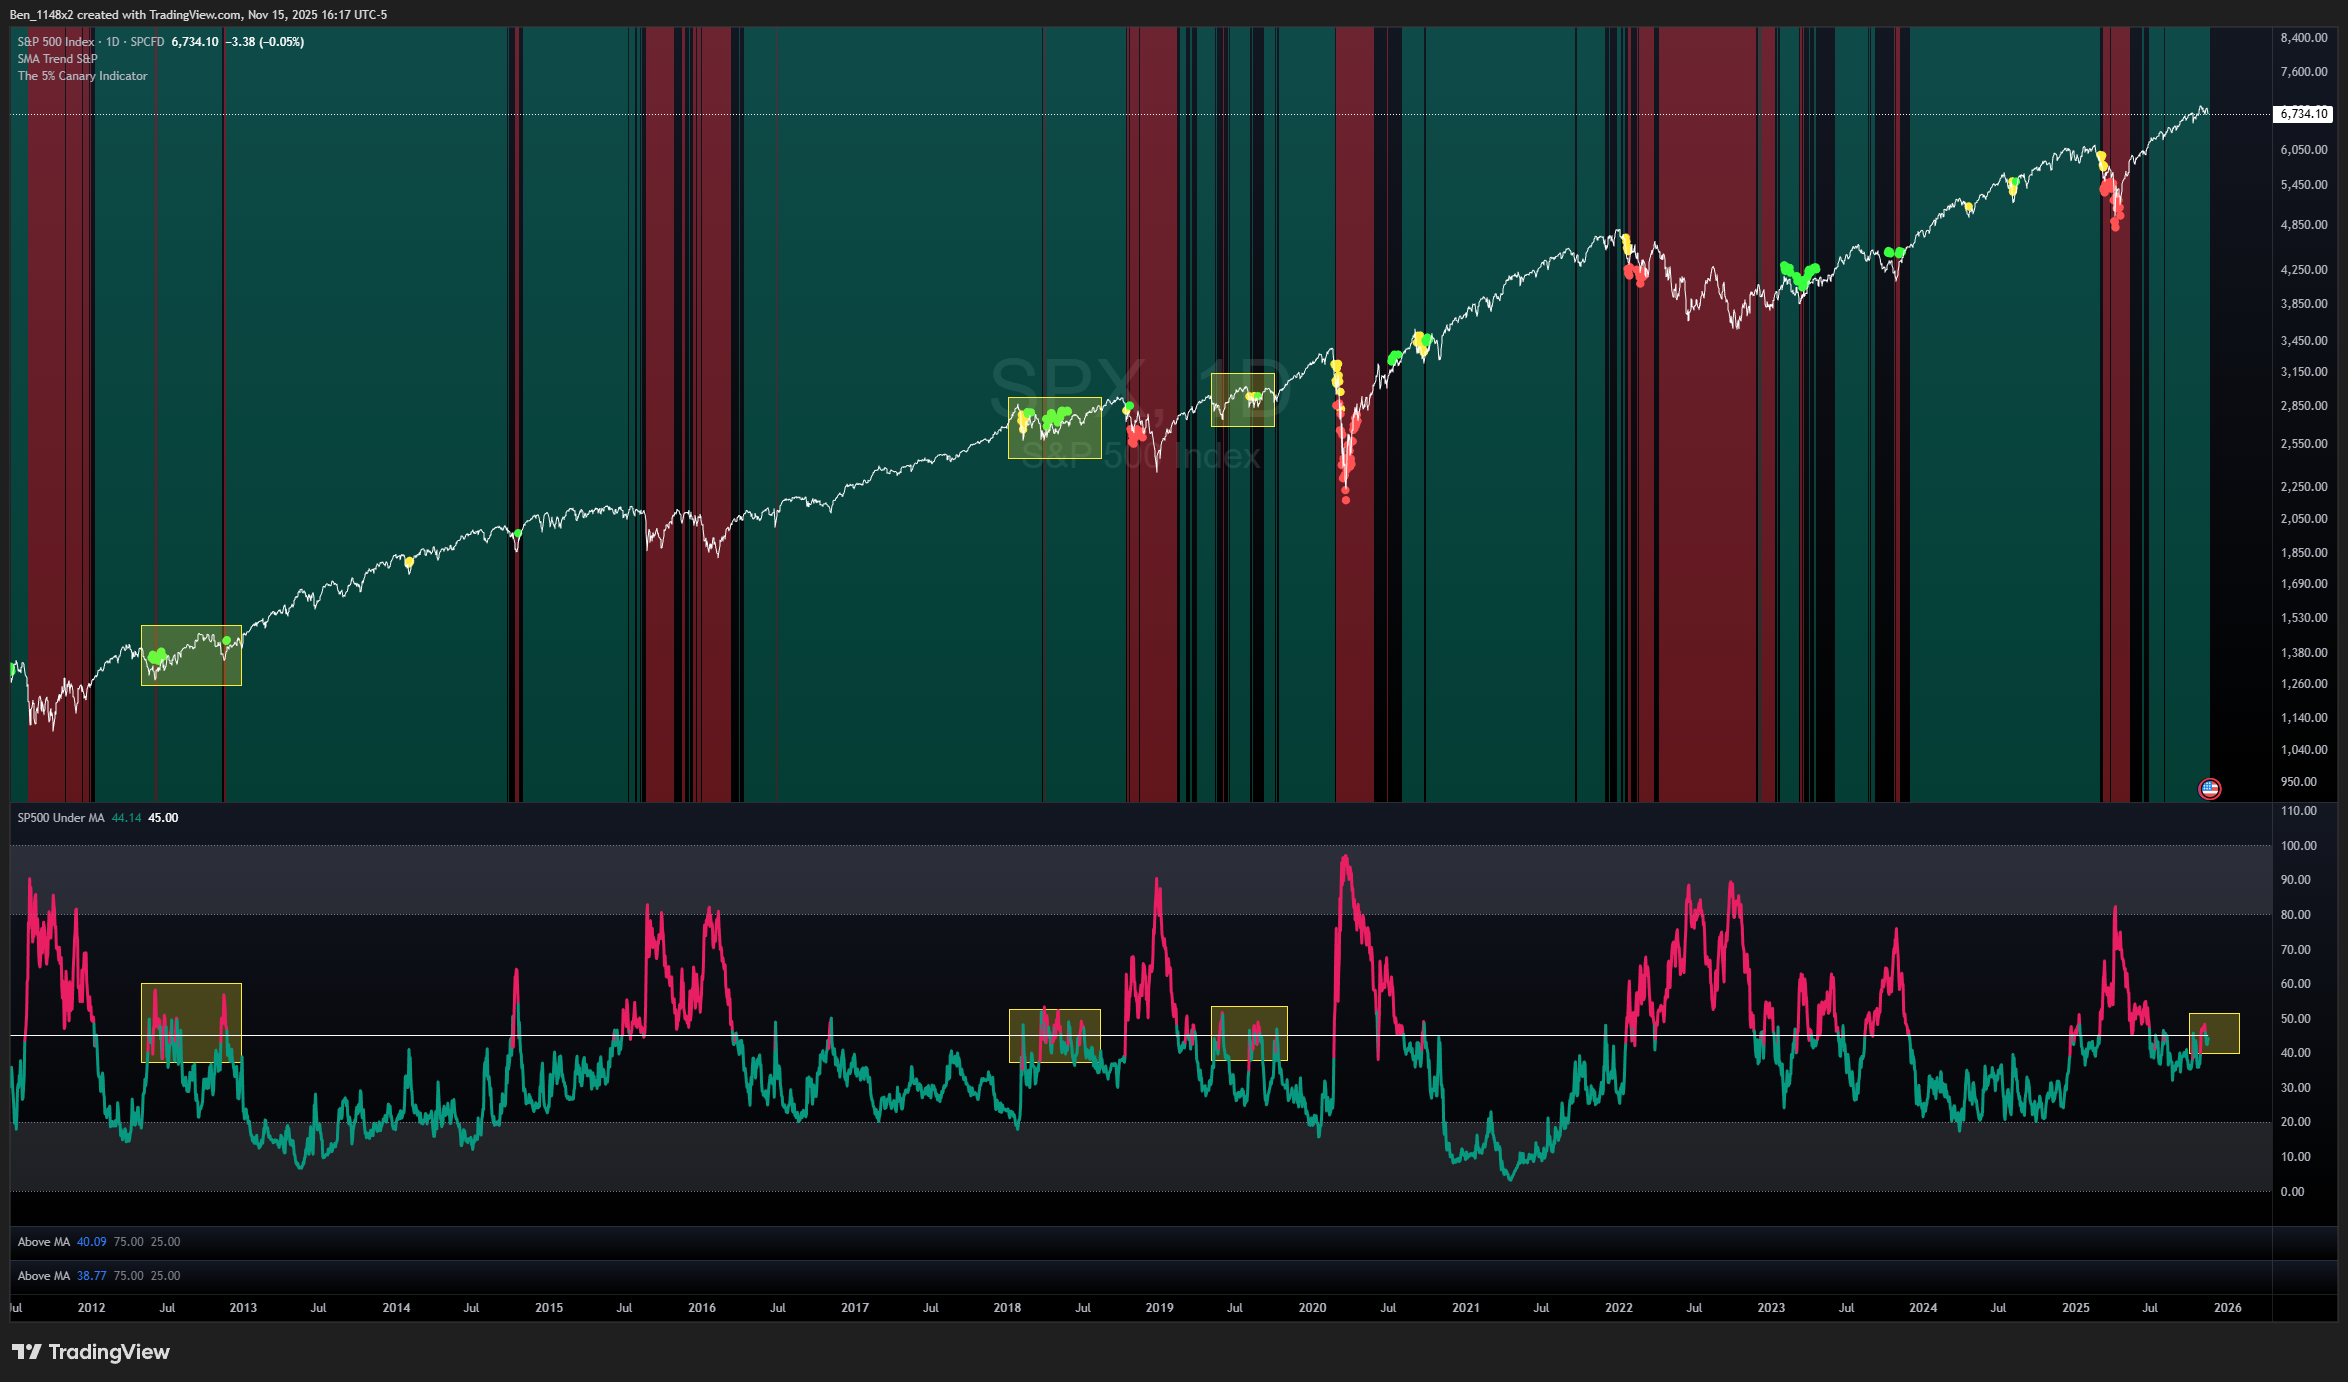
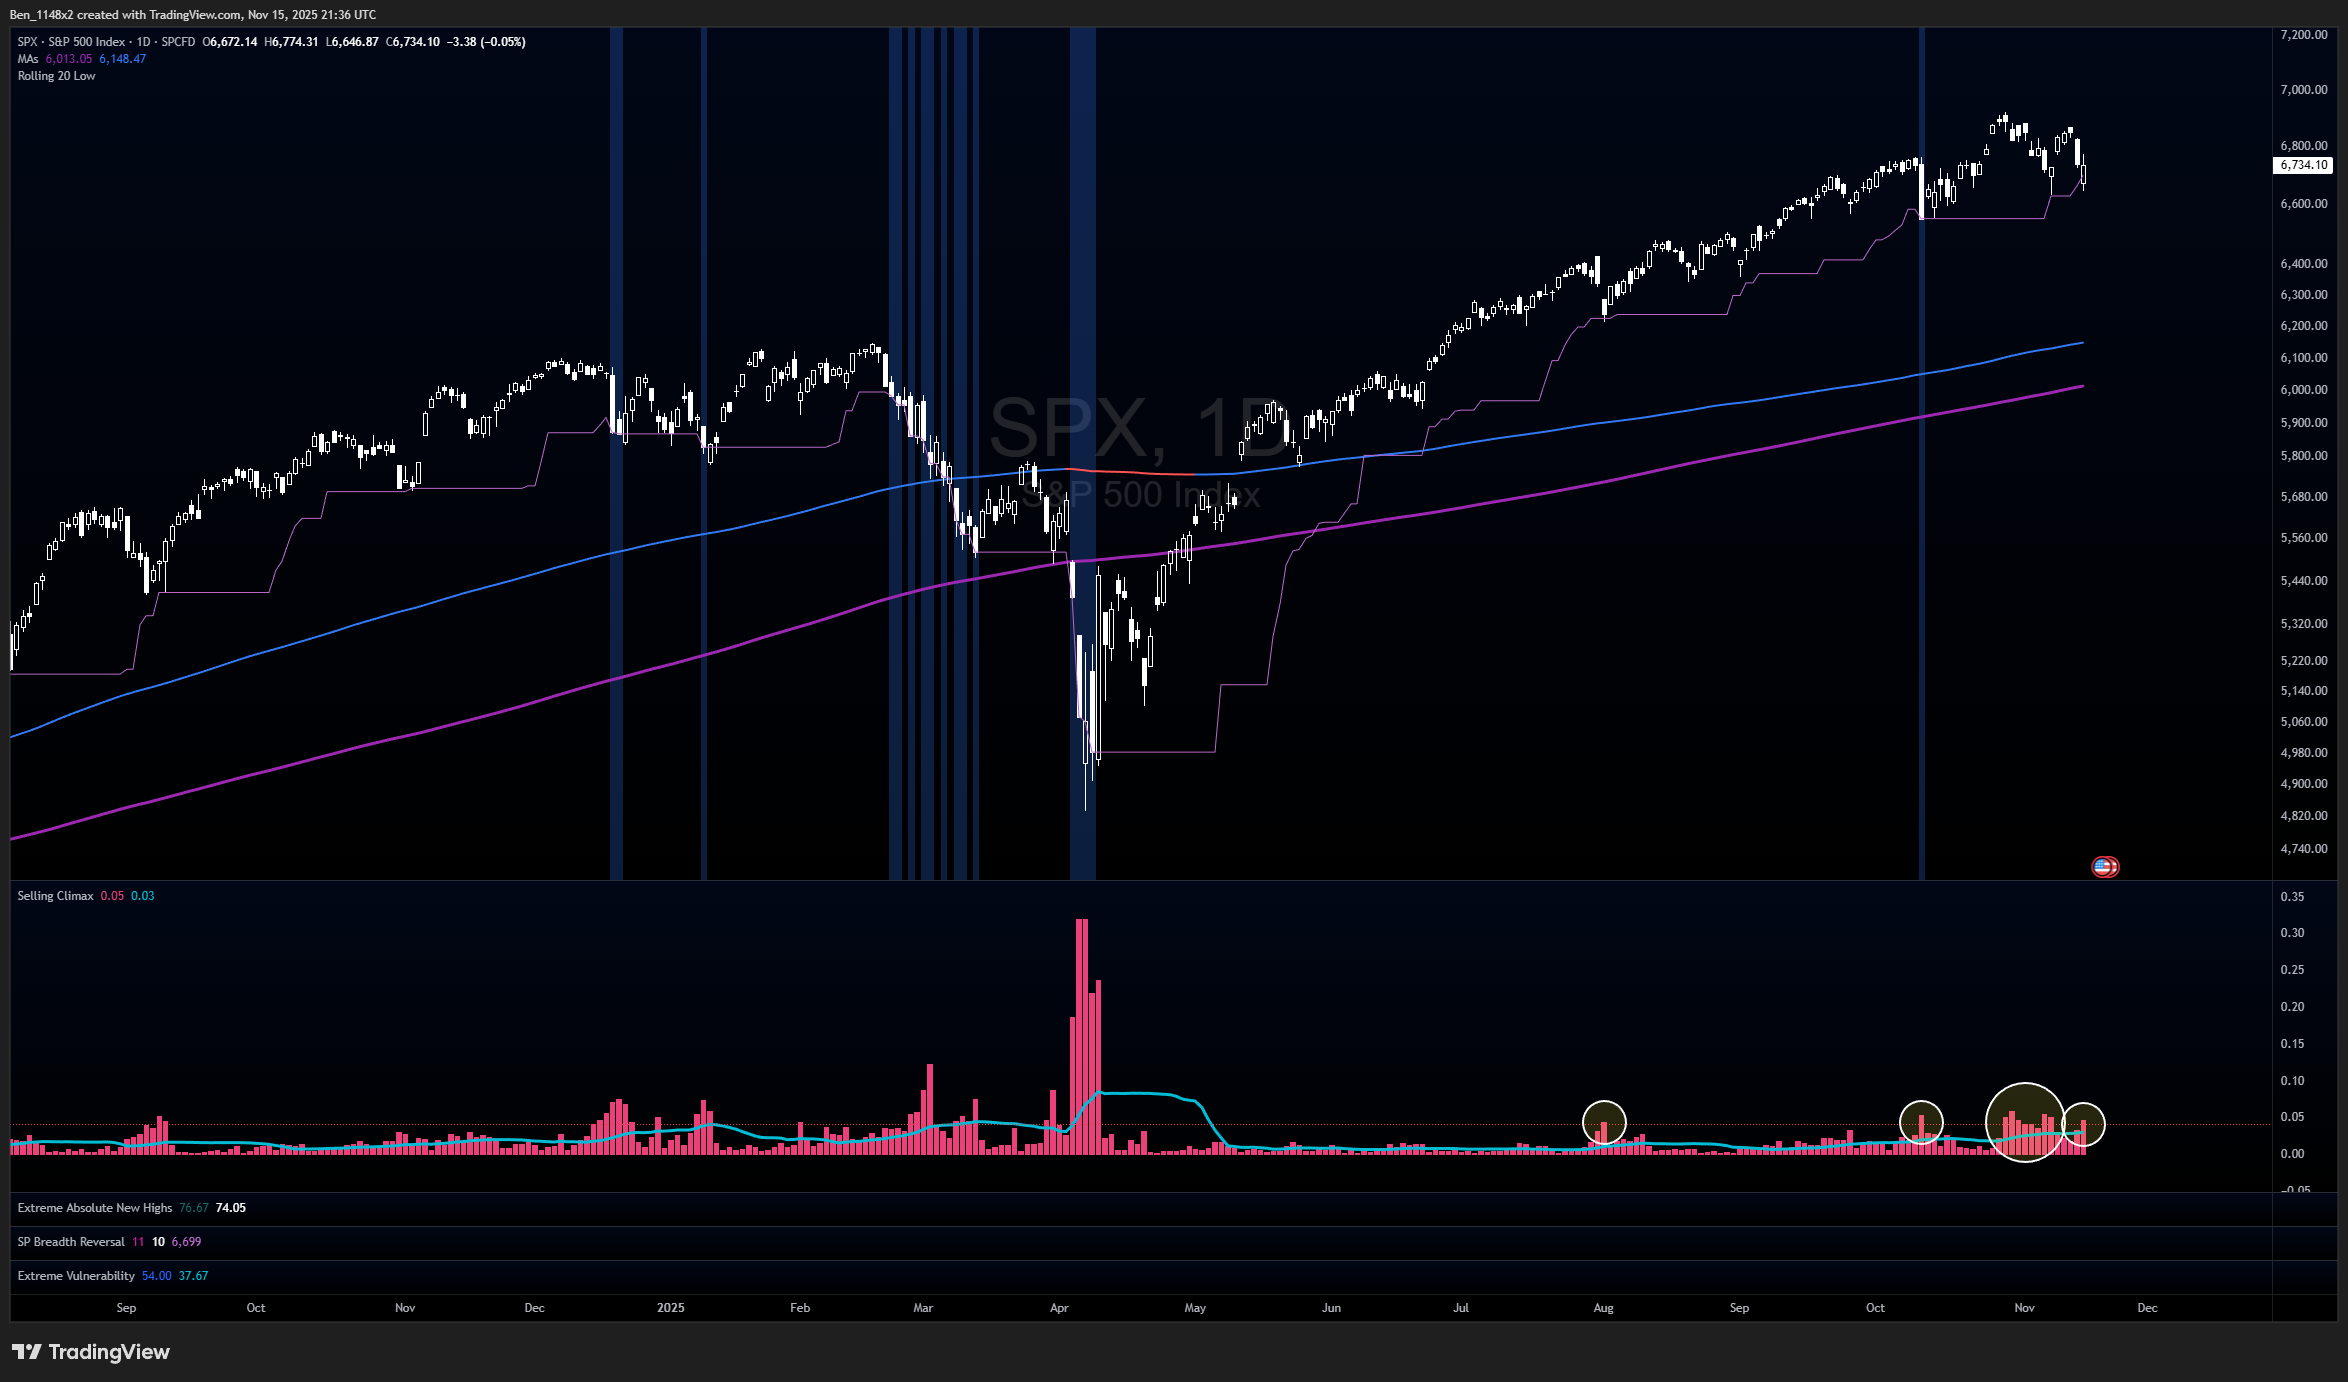
S&P vs 200SMA
Note that the alert flipped from yellow to green without much improvement. The S&P remains above the 200SMA, but the number of S&P companies under the 200SMA is hovering around the 45% threshold. We would like a decisive move. The three prior times that we saw this type of breadth were choppy sideways consolidations in 2012, 2018, and 2019.
The volatility weighted put call ratio indicator is not giving an alert. This method uses the follow line and my variation of Larry Williams Will Trend as confirmation. The S&P is between those lines right now
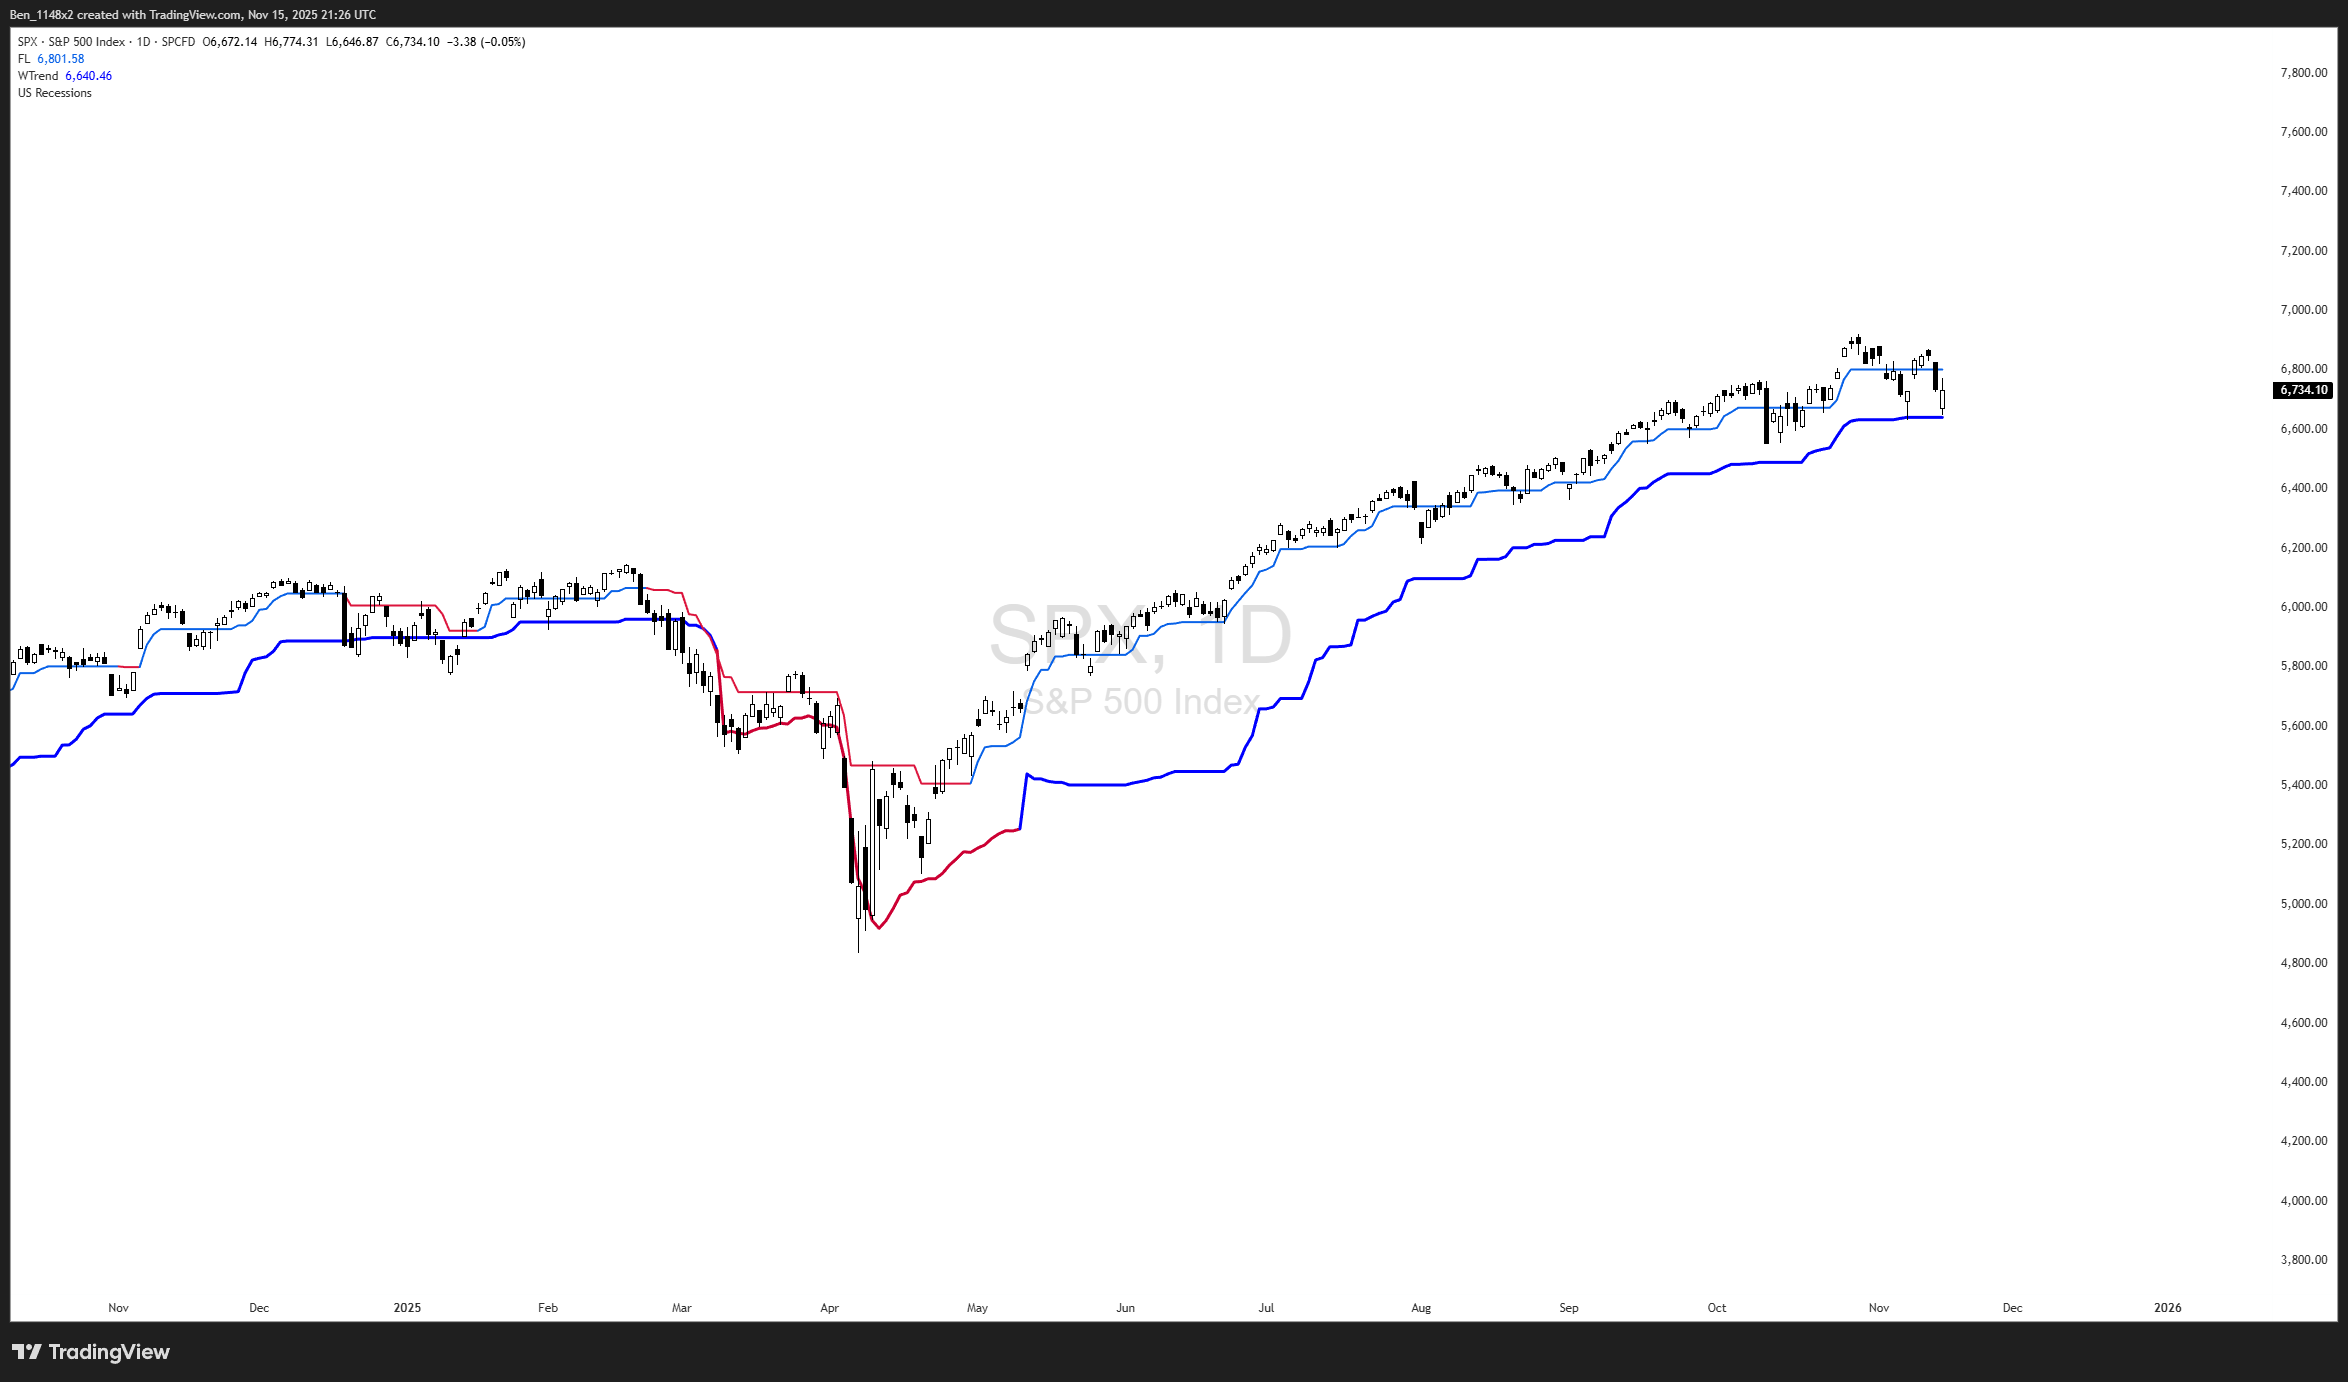
Volatility is expanding, which presents elevated risk.
Extreme Vulnerability and the “Bloodbath” Alert
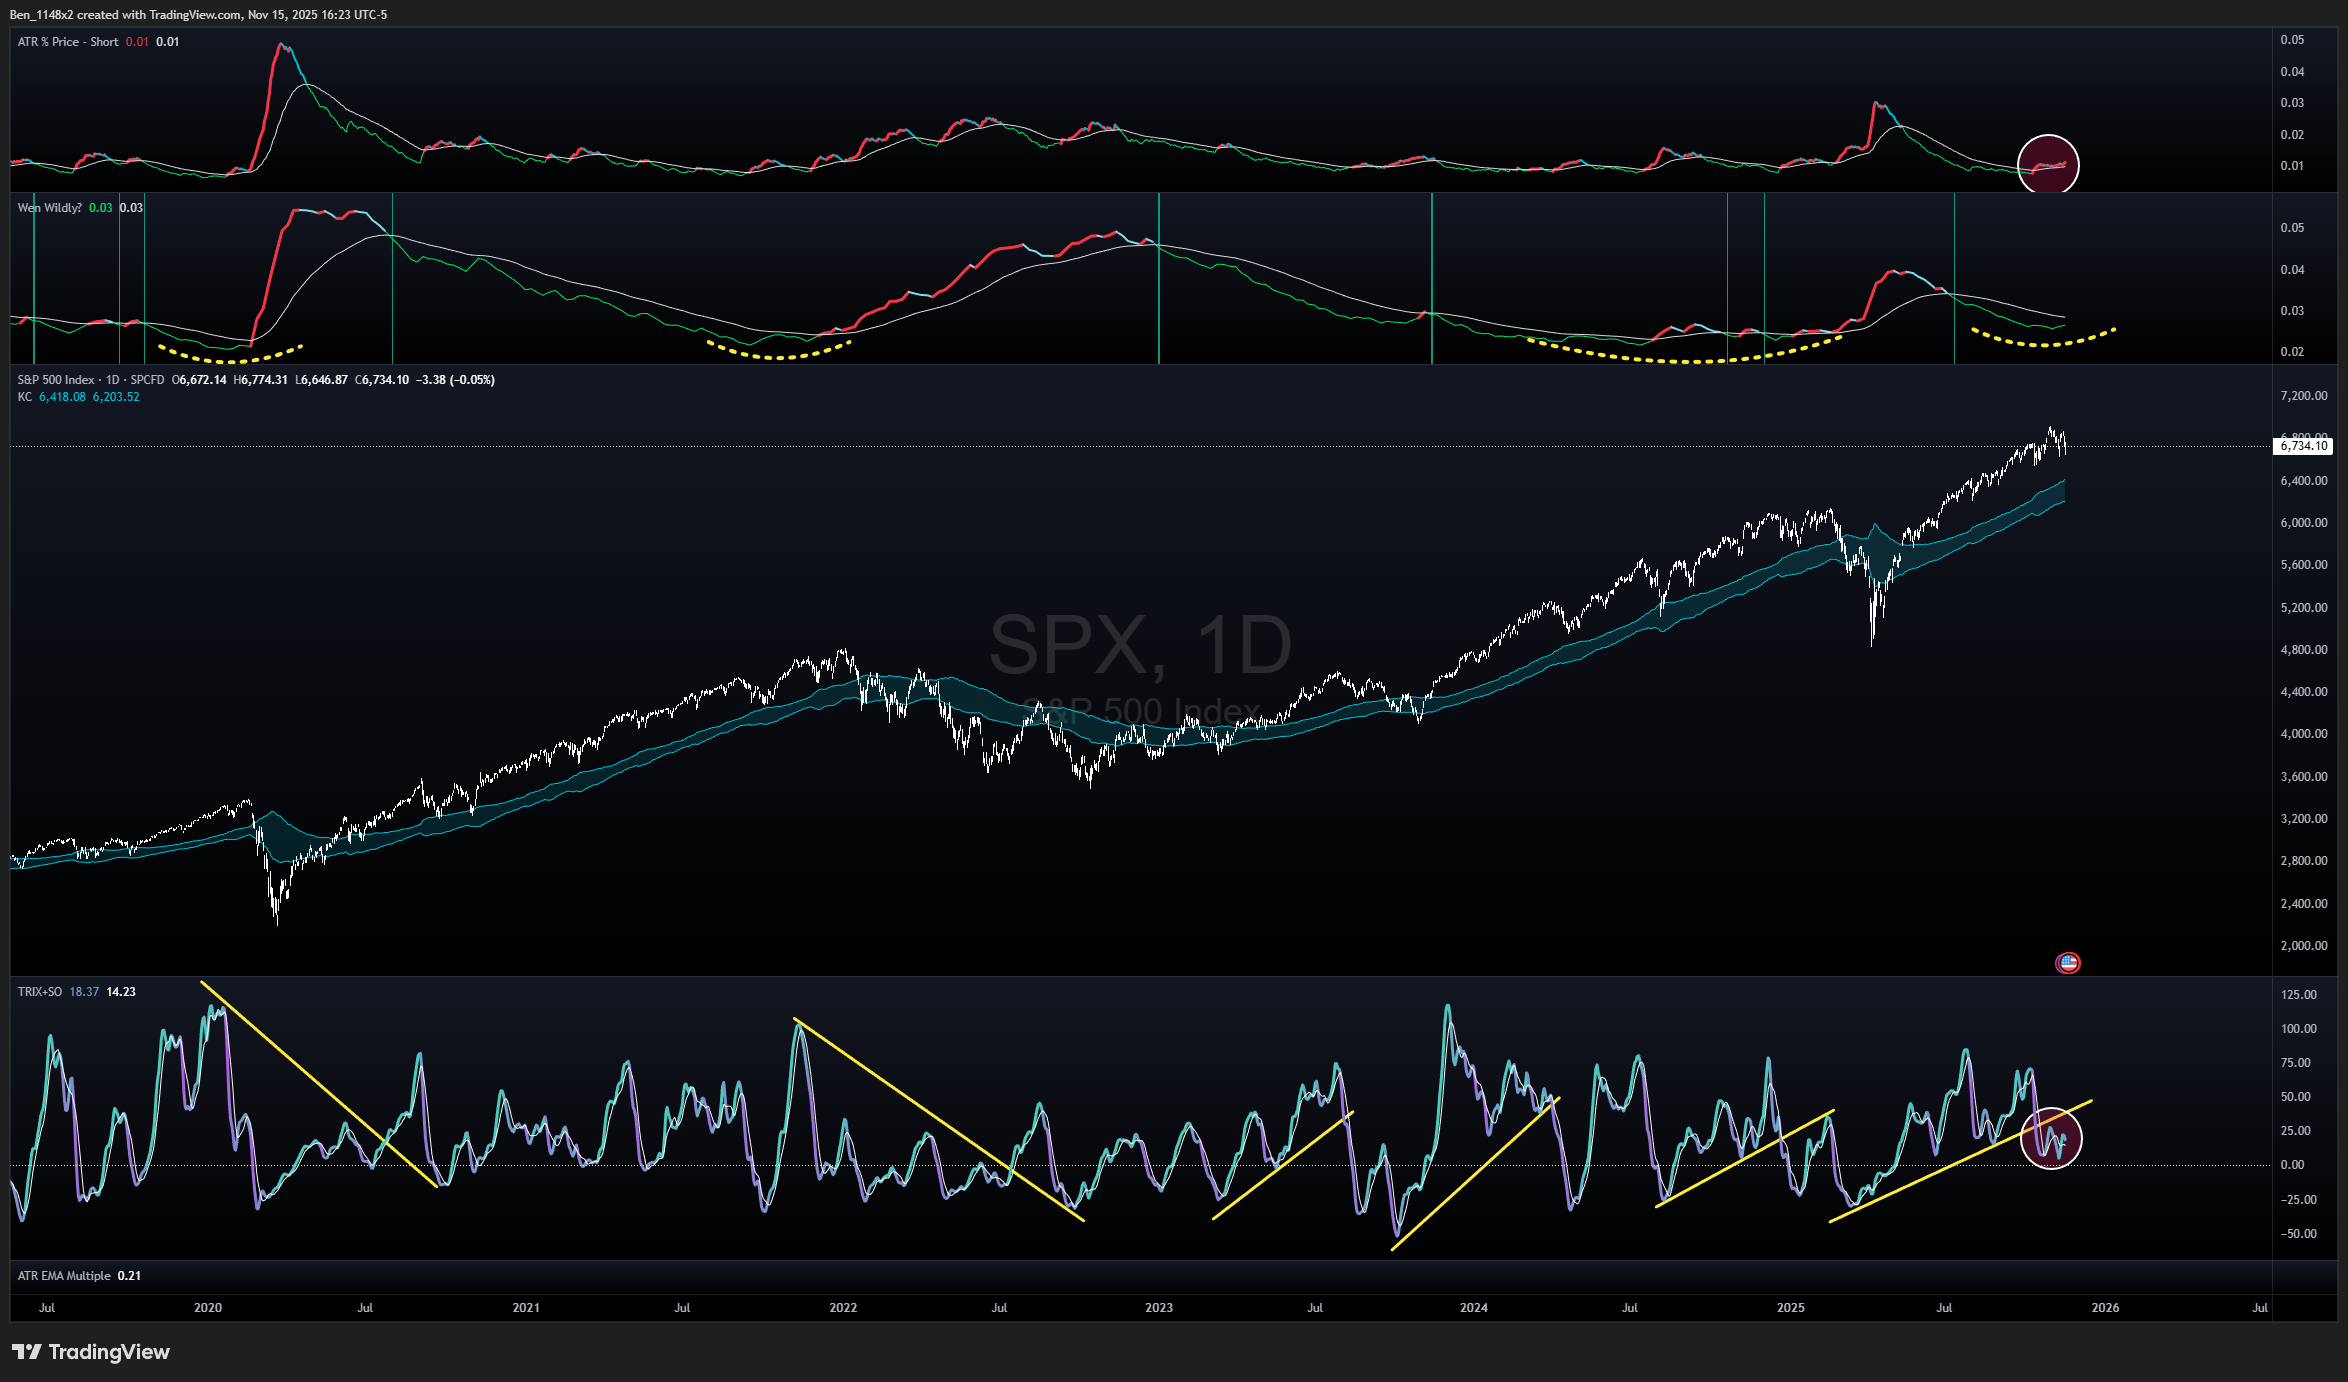
The Extreme Vulnerability indicator counts consecutive days that new lows have not experienced an extreme low of 0.325%. When we reach 65 consecutive sessions we are at greater risk of a drawdown. It is currently at 54, which is the second longest streak since 2022.
The advance decline line divided by its 32 week SMA is trending lower.
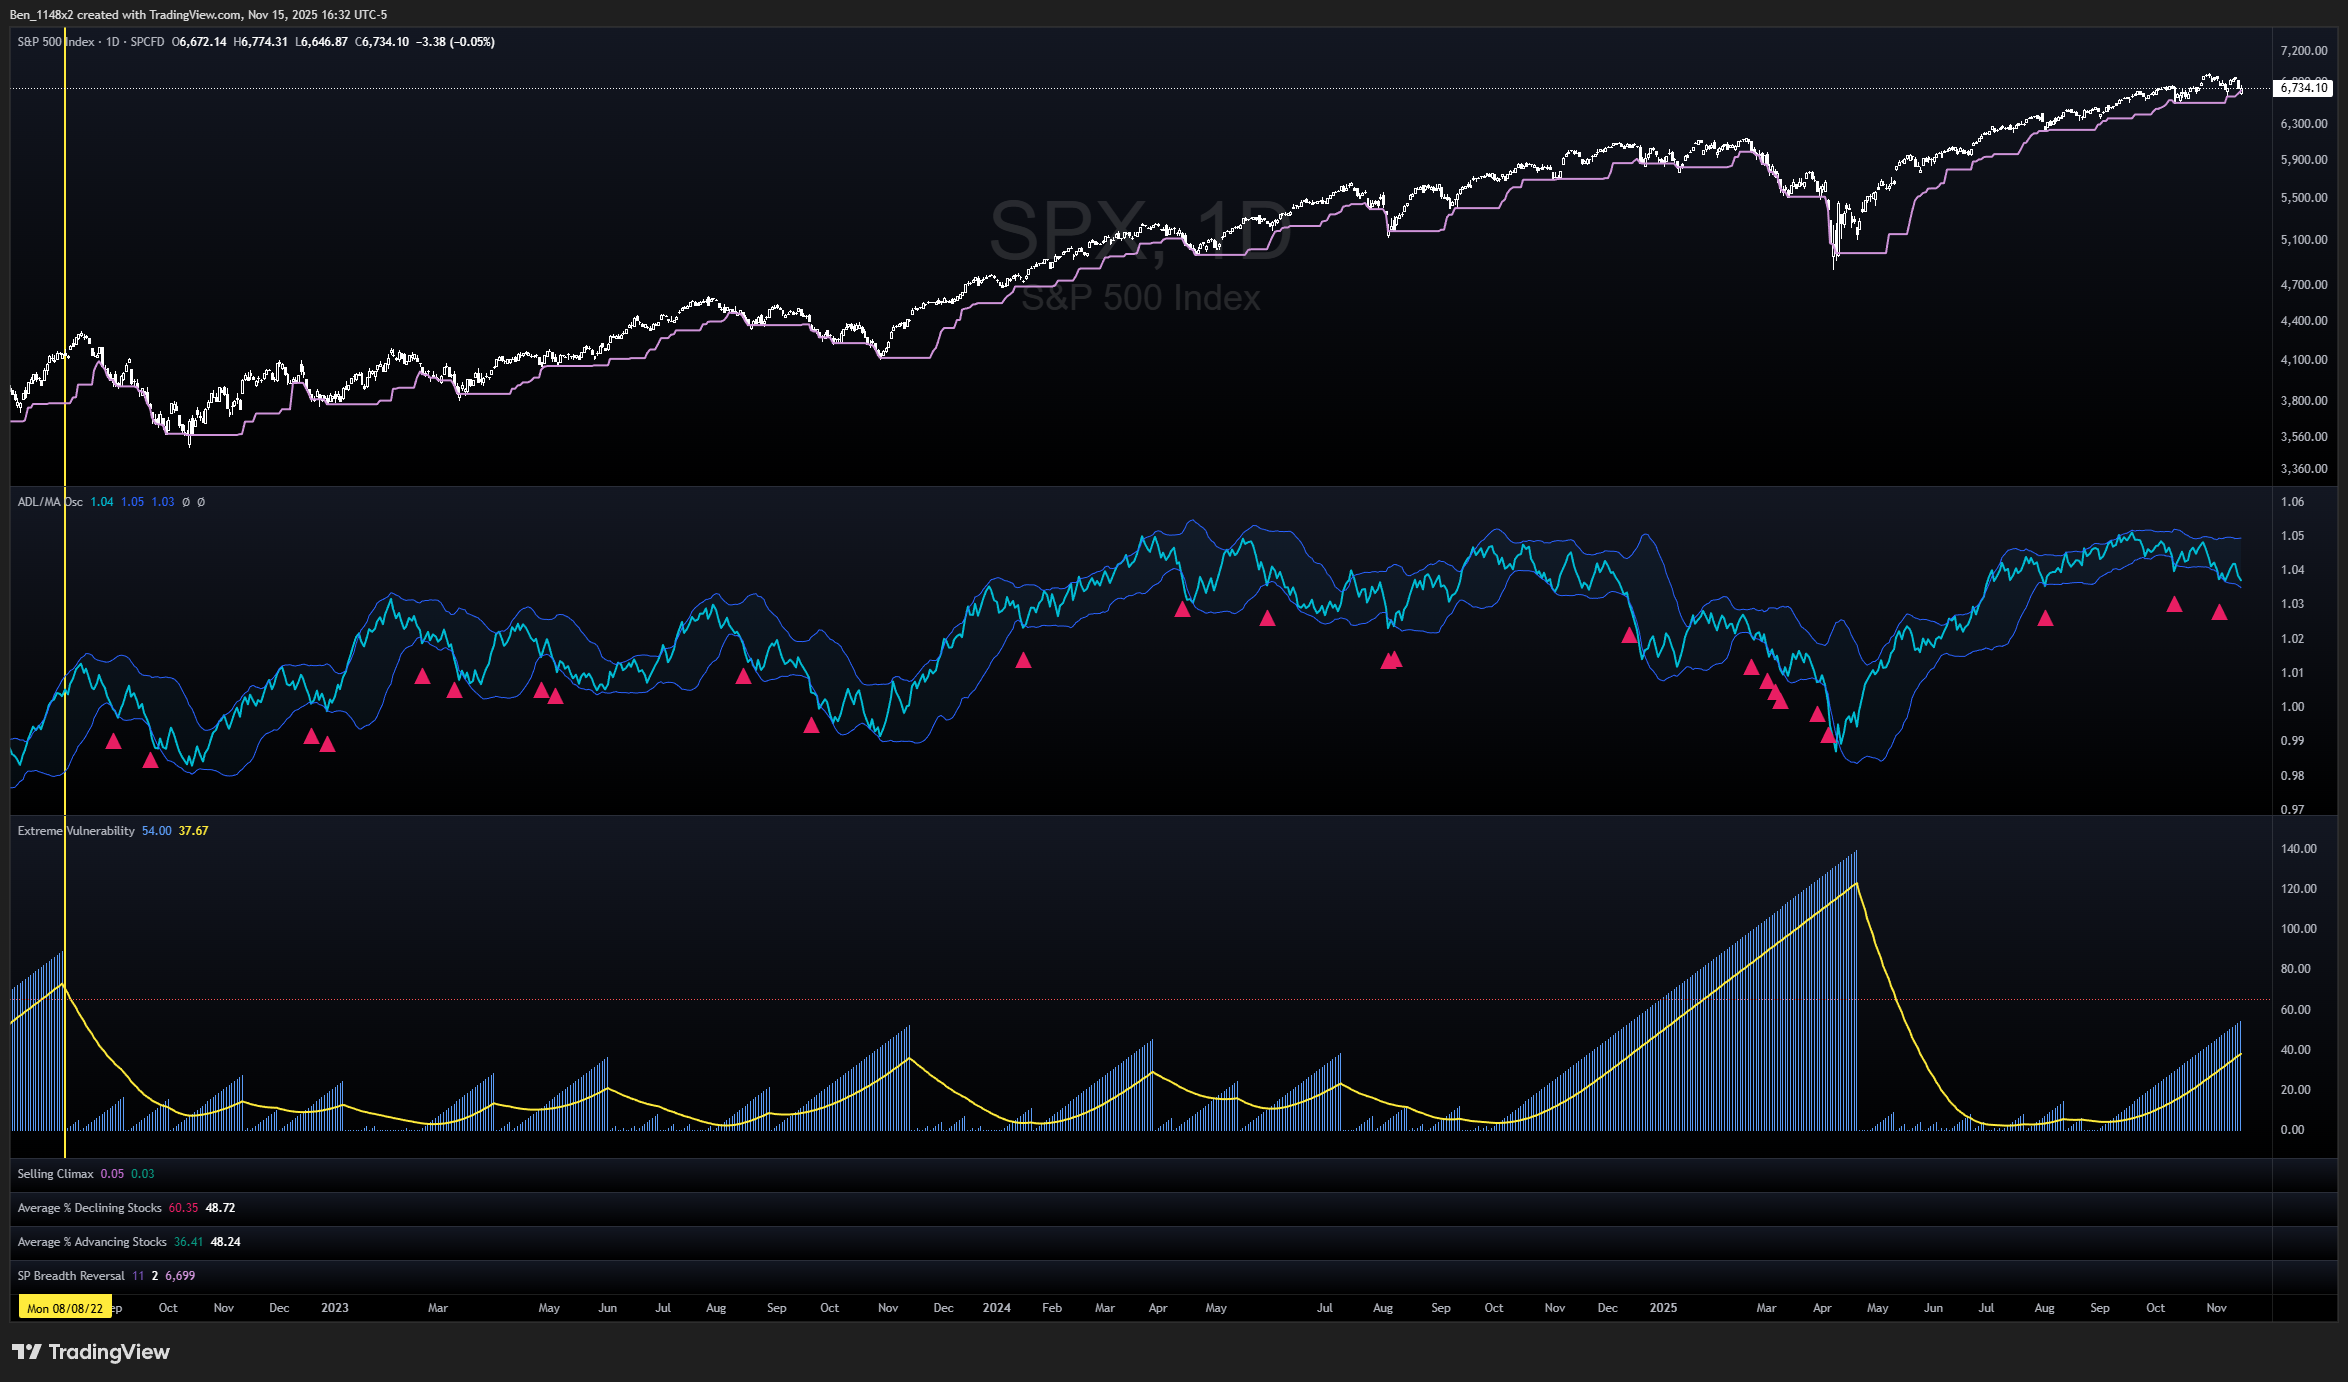
The “bloodbath” indicator gives an alert when net new lows are 4% or greater. This is the only timing indicator in the red right now. We’ve had a cluster of alerts recently.
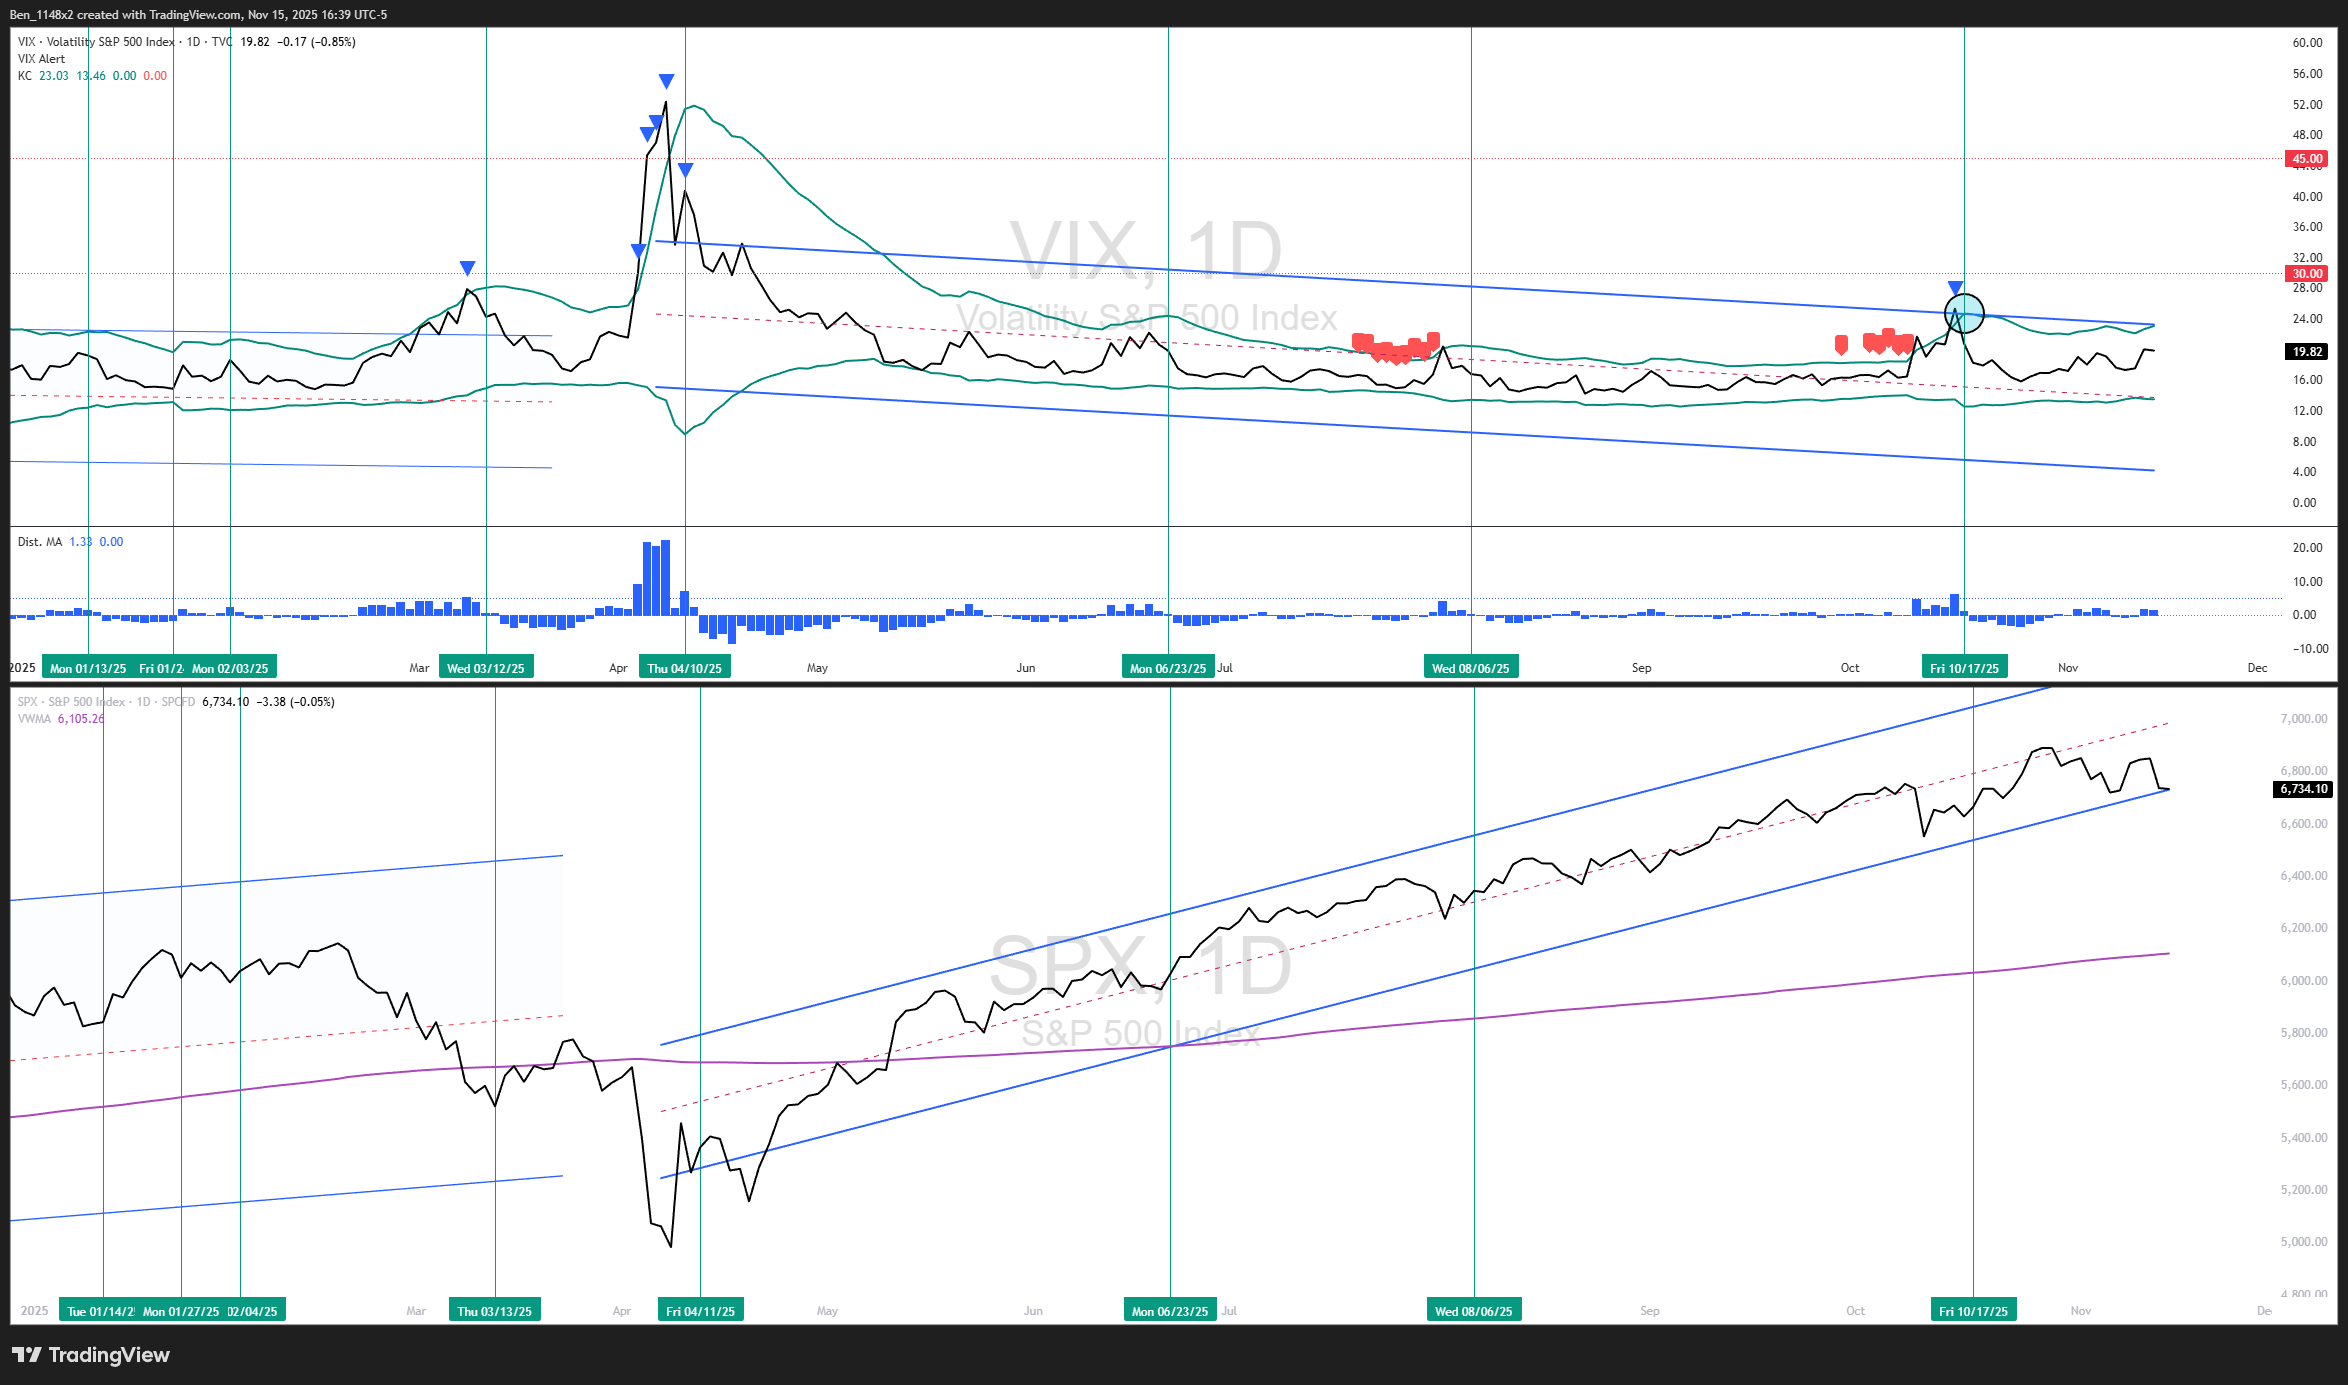
VIX
The VIX is elevated but not spiking.
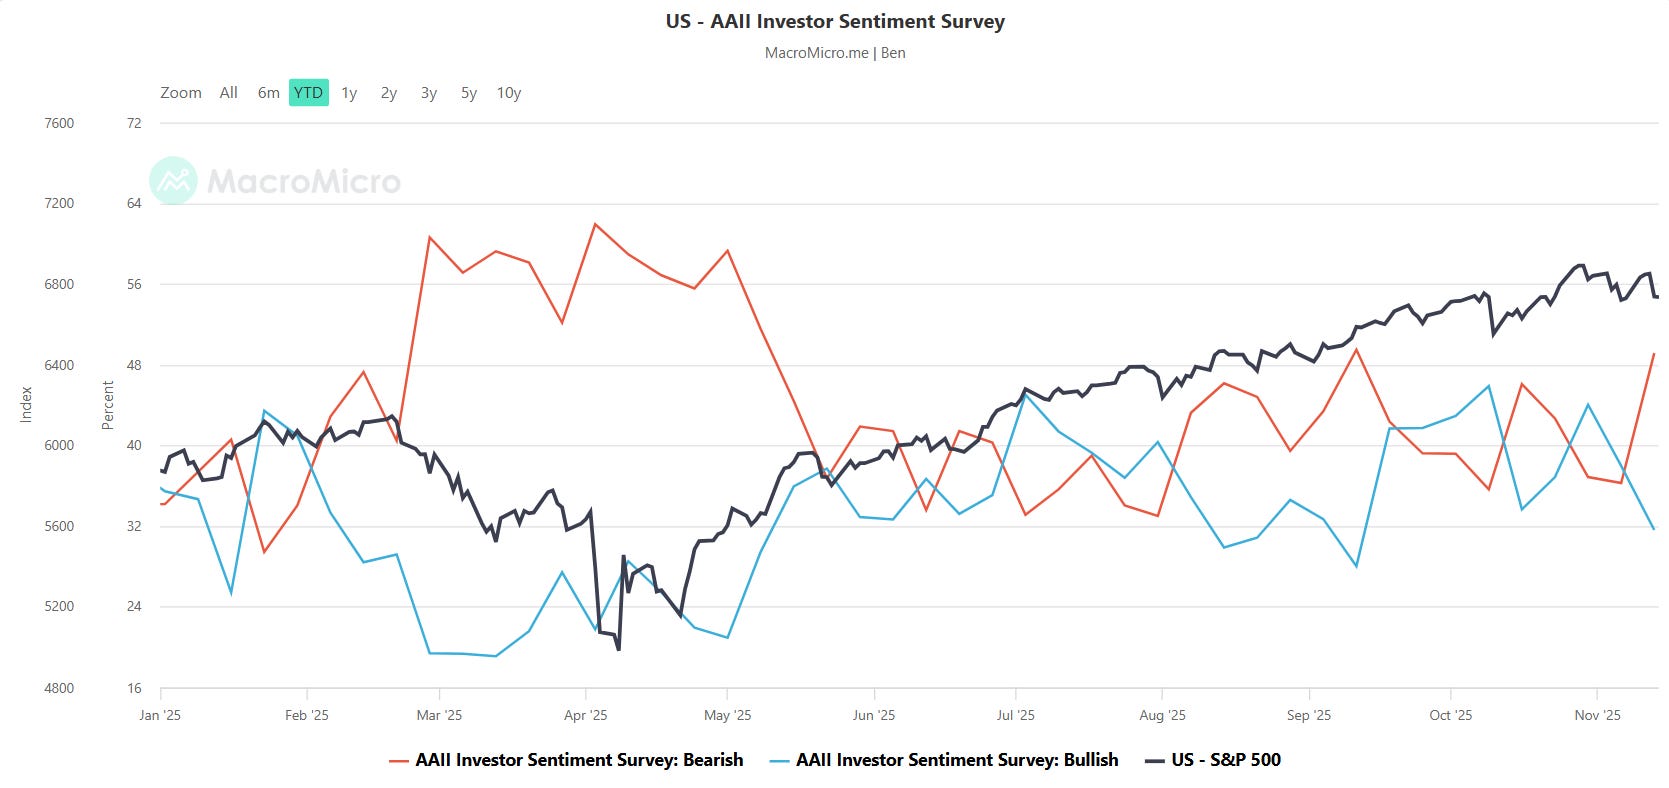
Investor Sentiment
The AAII sentiment survey showed an increase in the number of advisors with bearish sentiment. The reading is still in a normal range and not at the type of extreme that we could use as a contrarian buy signal.
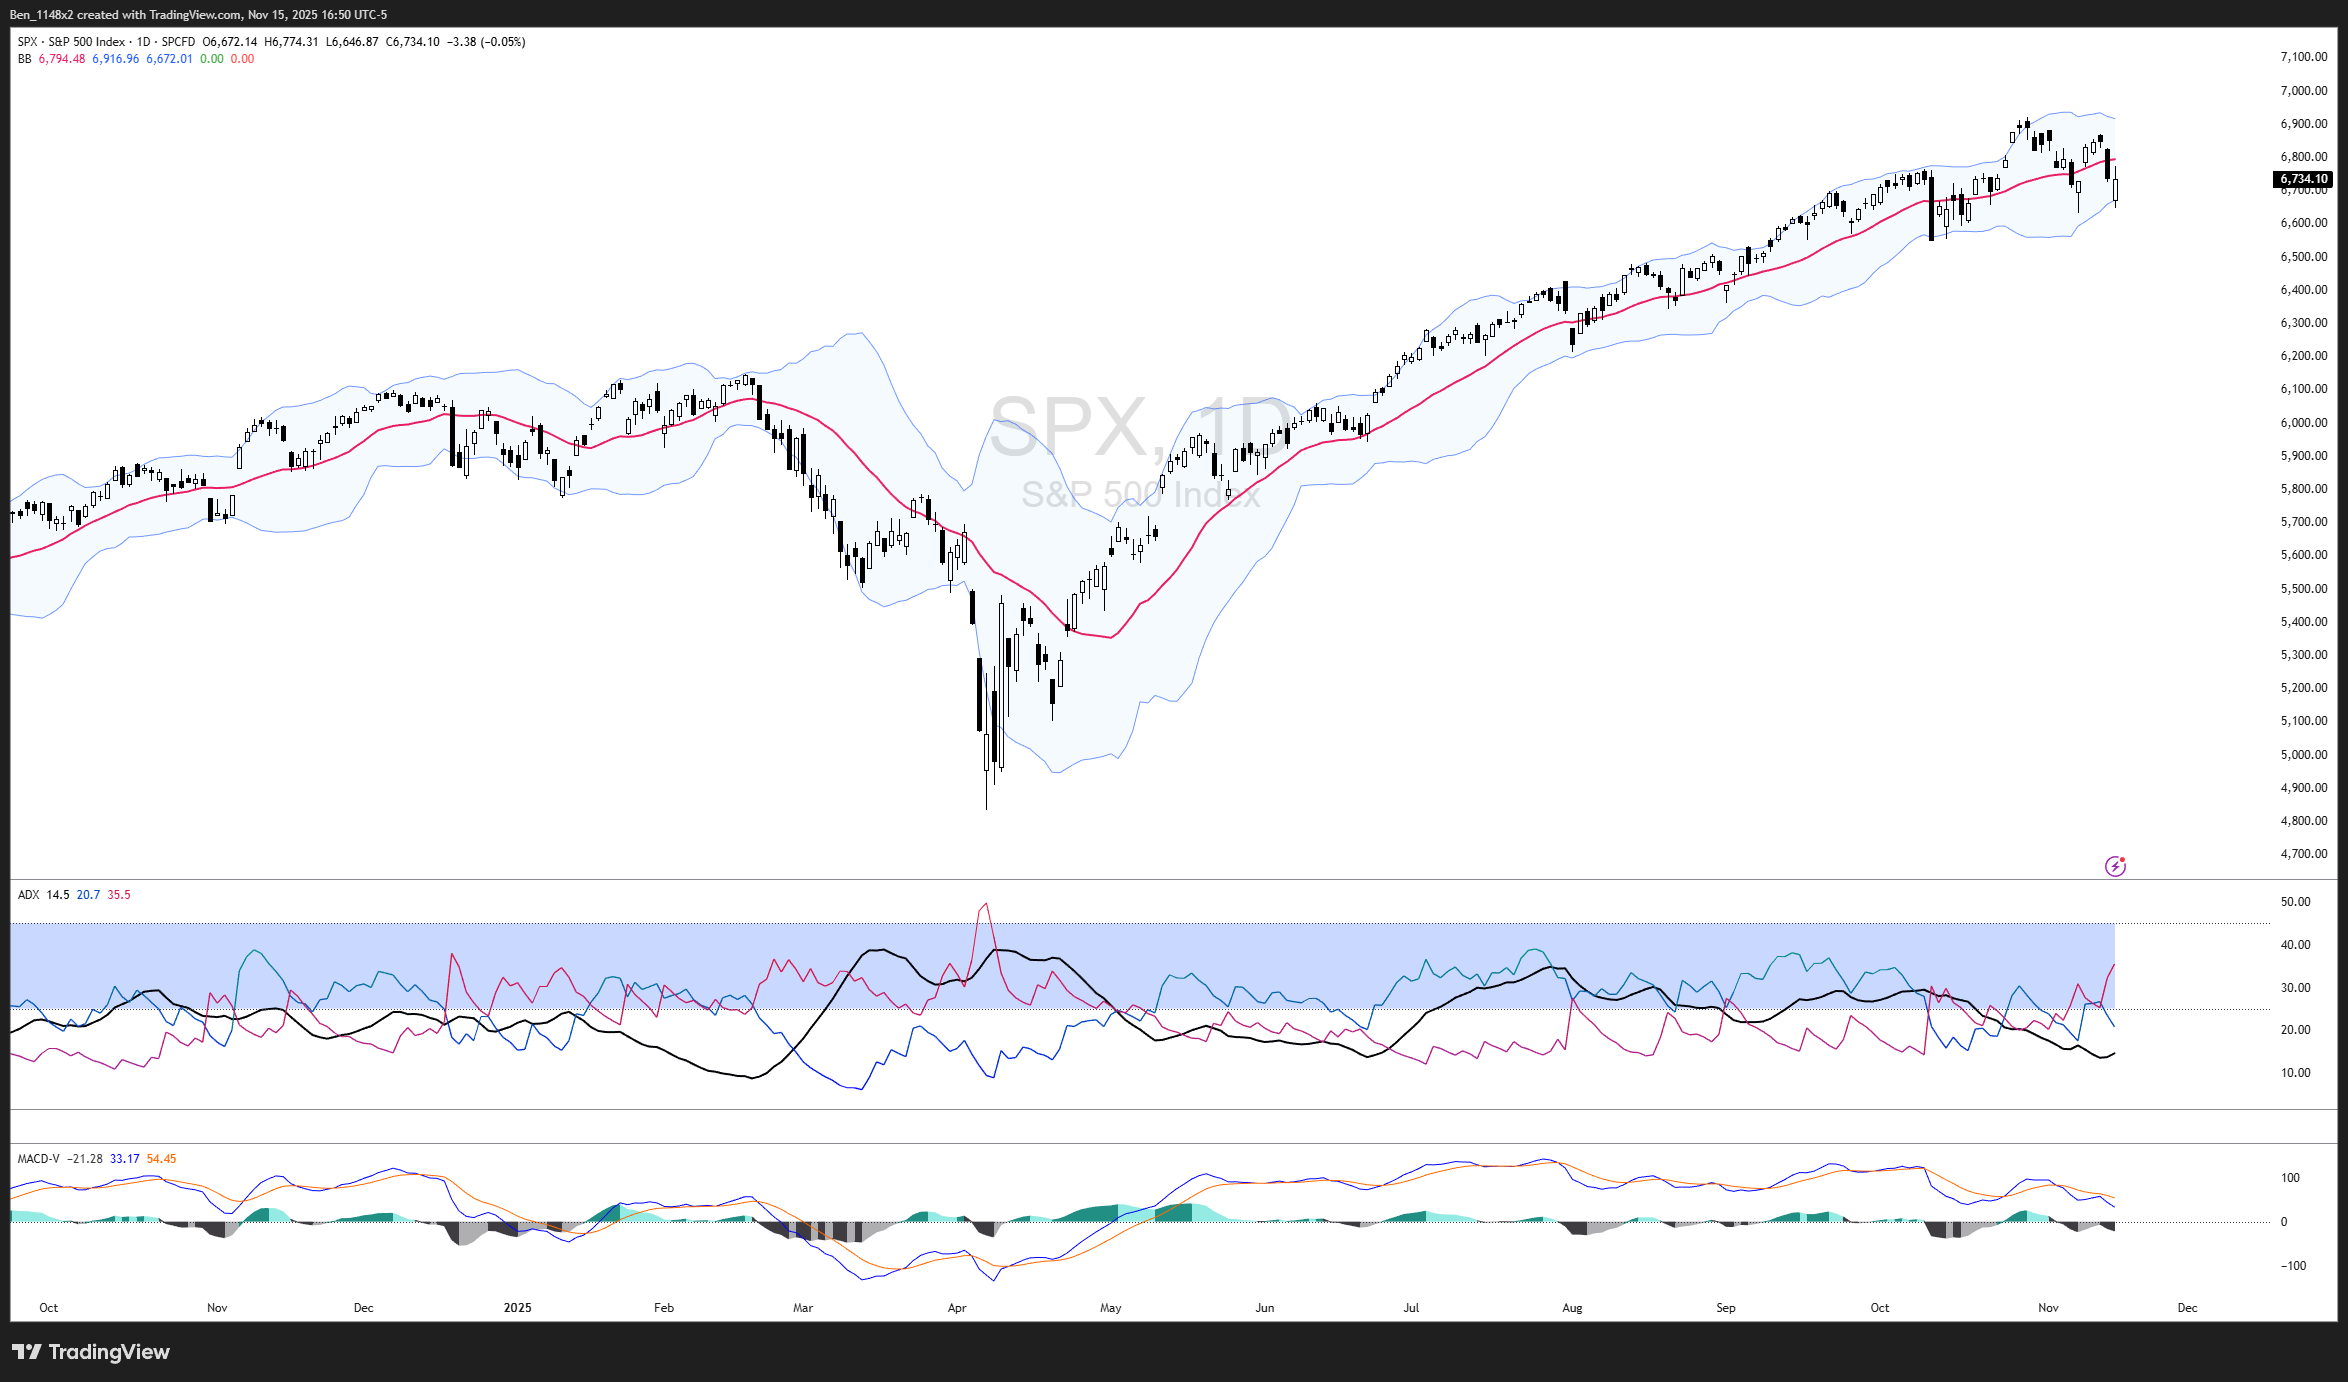
S&P
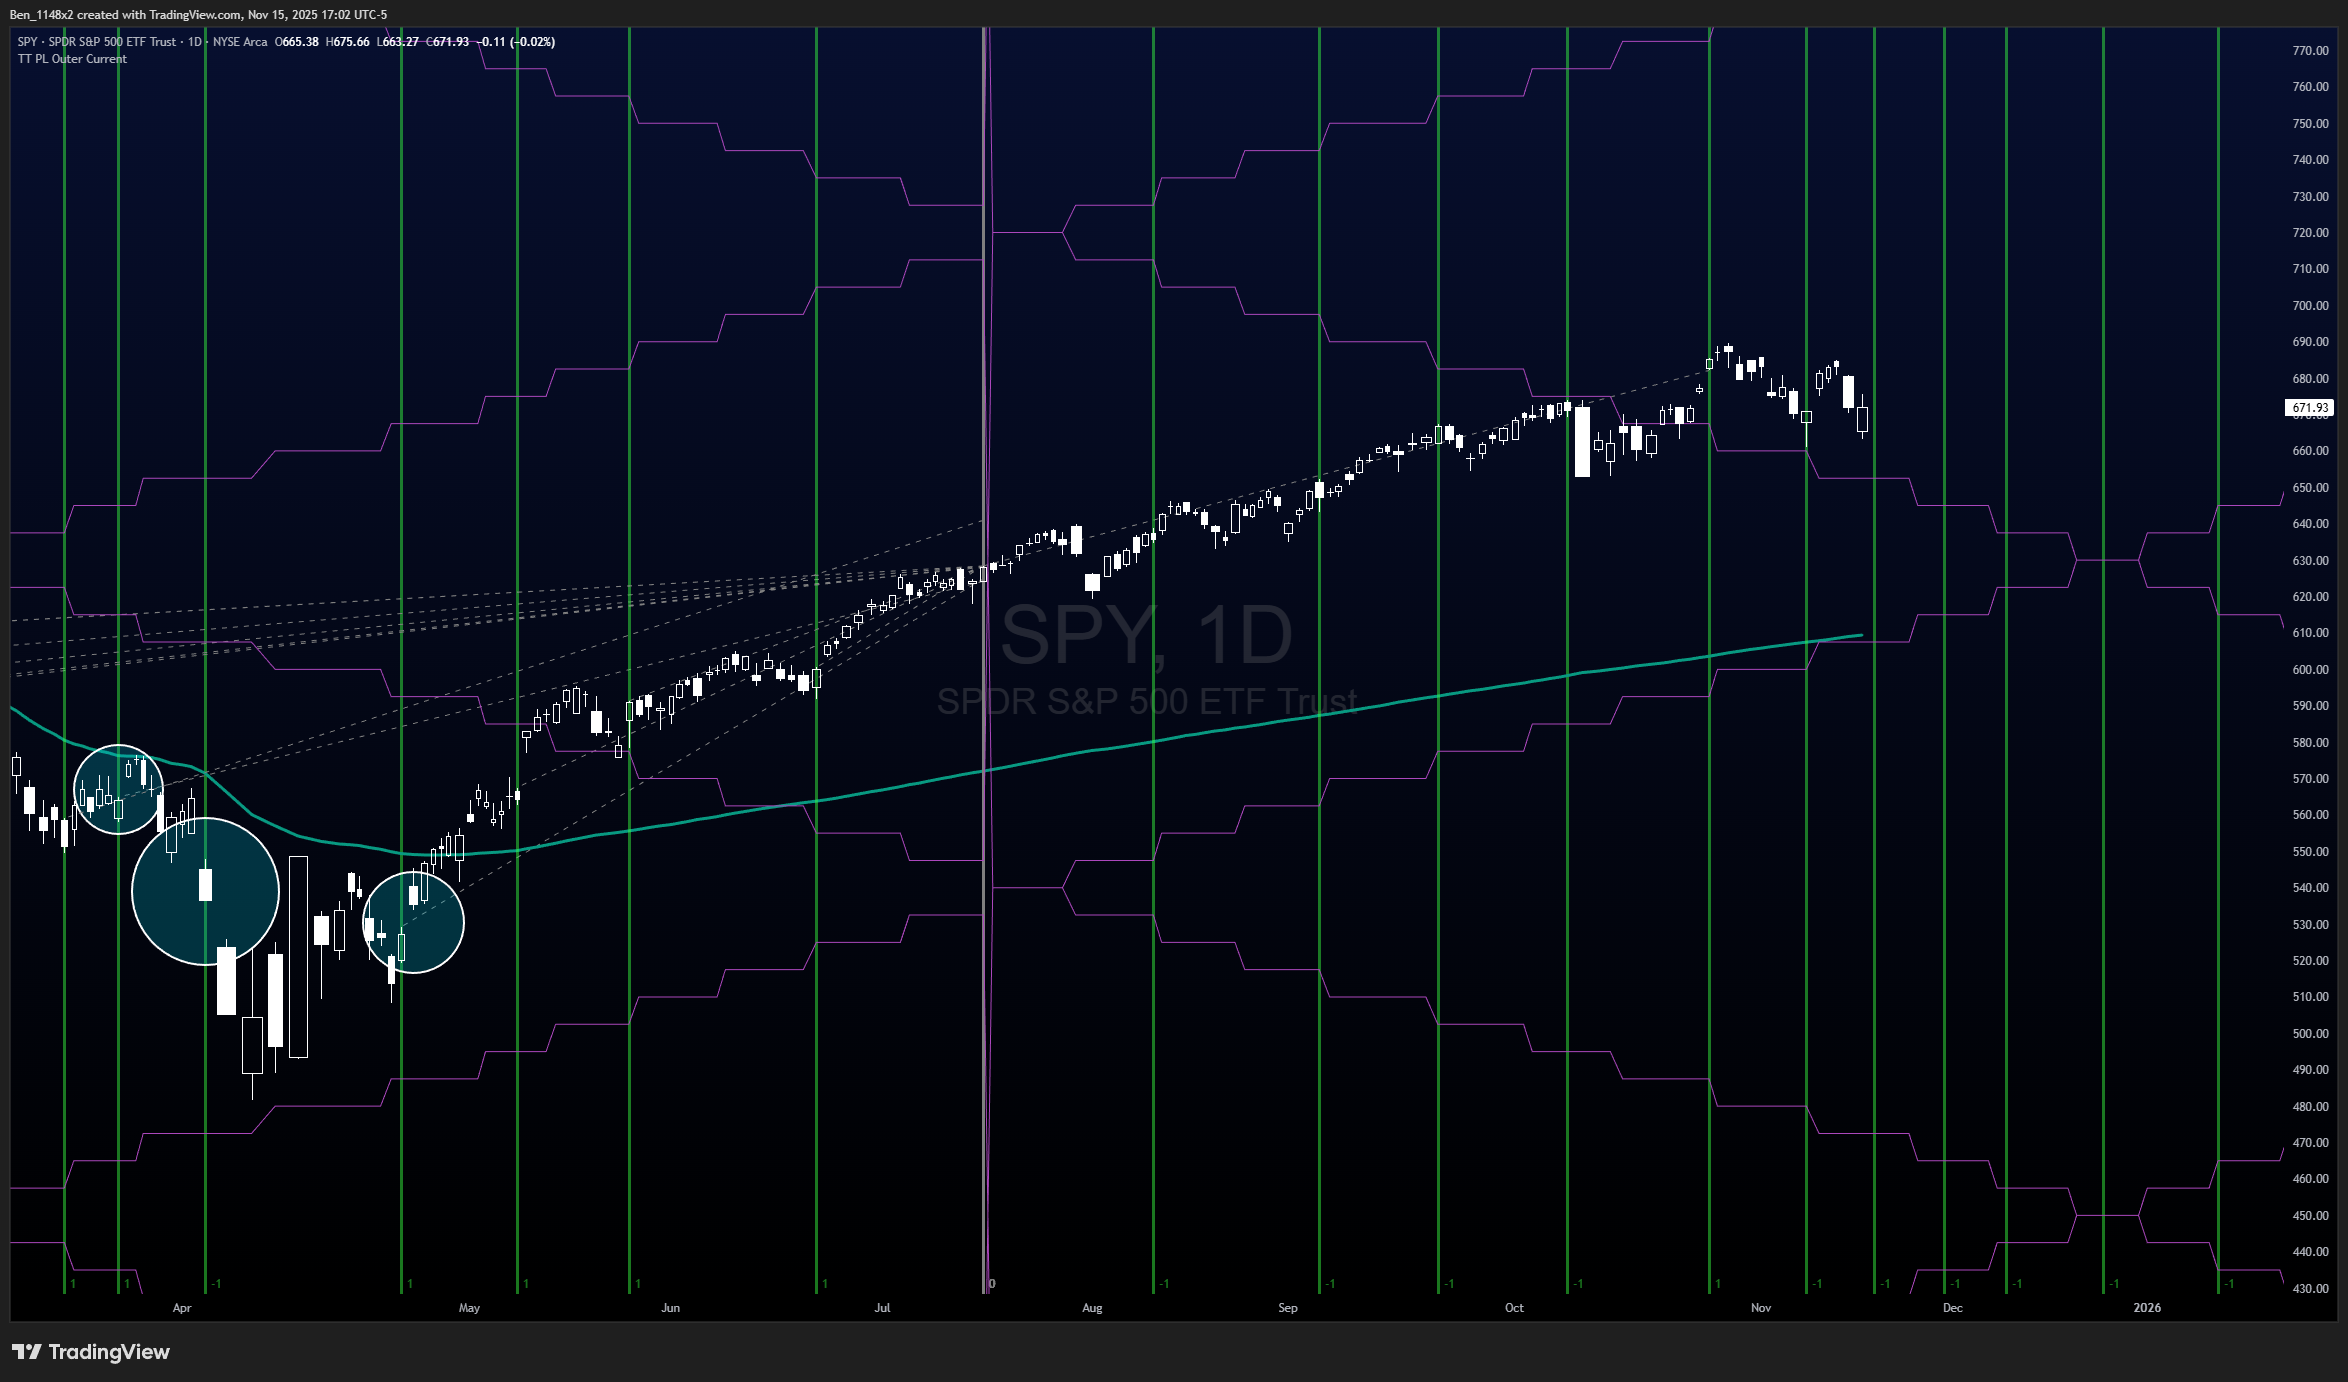
The daily chart shows a recent open below the lower Bollinger Band.
The middle indicator is the ADX. Negative directional index is rising, but the average directional index is at 15, suggesting that the short term downtrend is weak. Contrast this with the move down that we saw in April where ADX confirmed that the downtrend had strength.
The volatility normalized MACD is currently bearish.
The financial astrology tools from Time Trades anchored to the eclipse had previously identified 11/13 as a date of interest. I either misread it or it shifted with an update, but the date pushed to 11/14. The next date of interest is 11/24, the Monday before the Thanksgiving holiday.
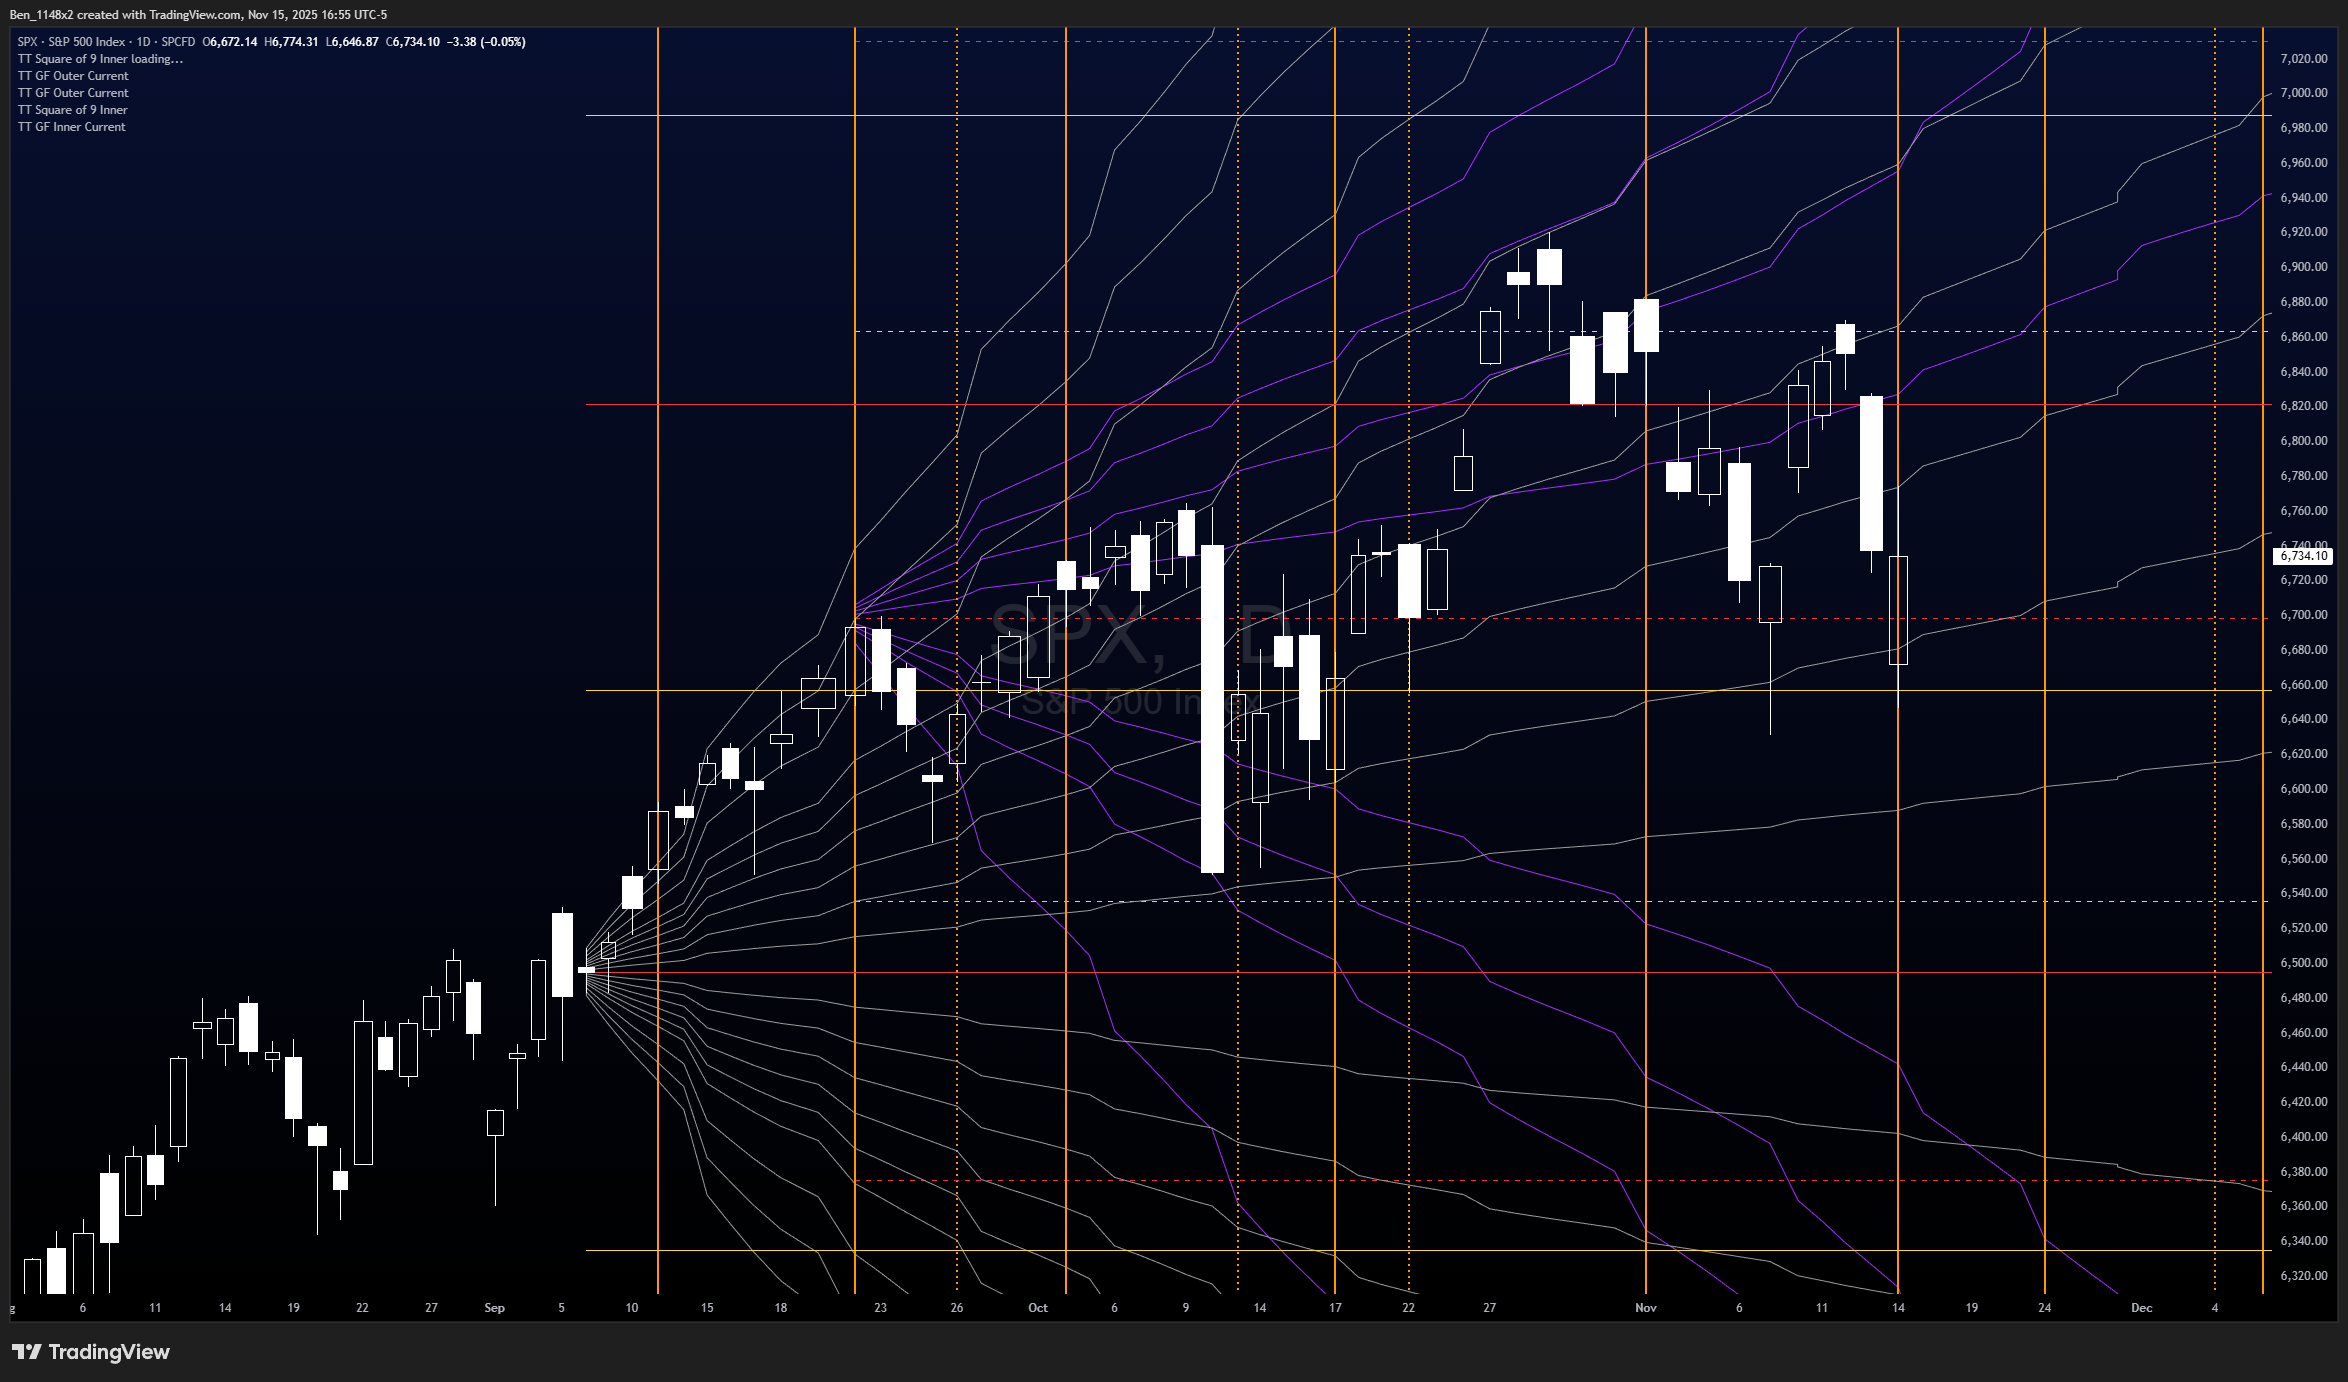
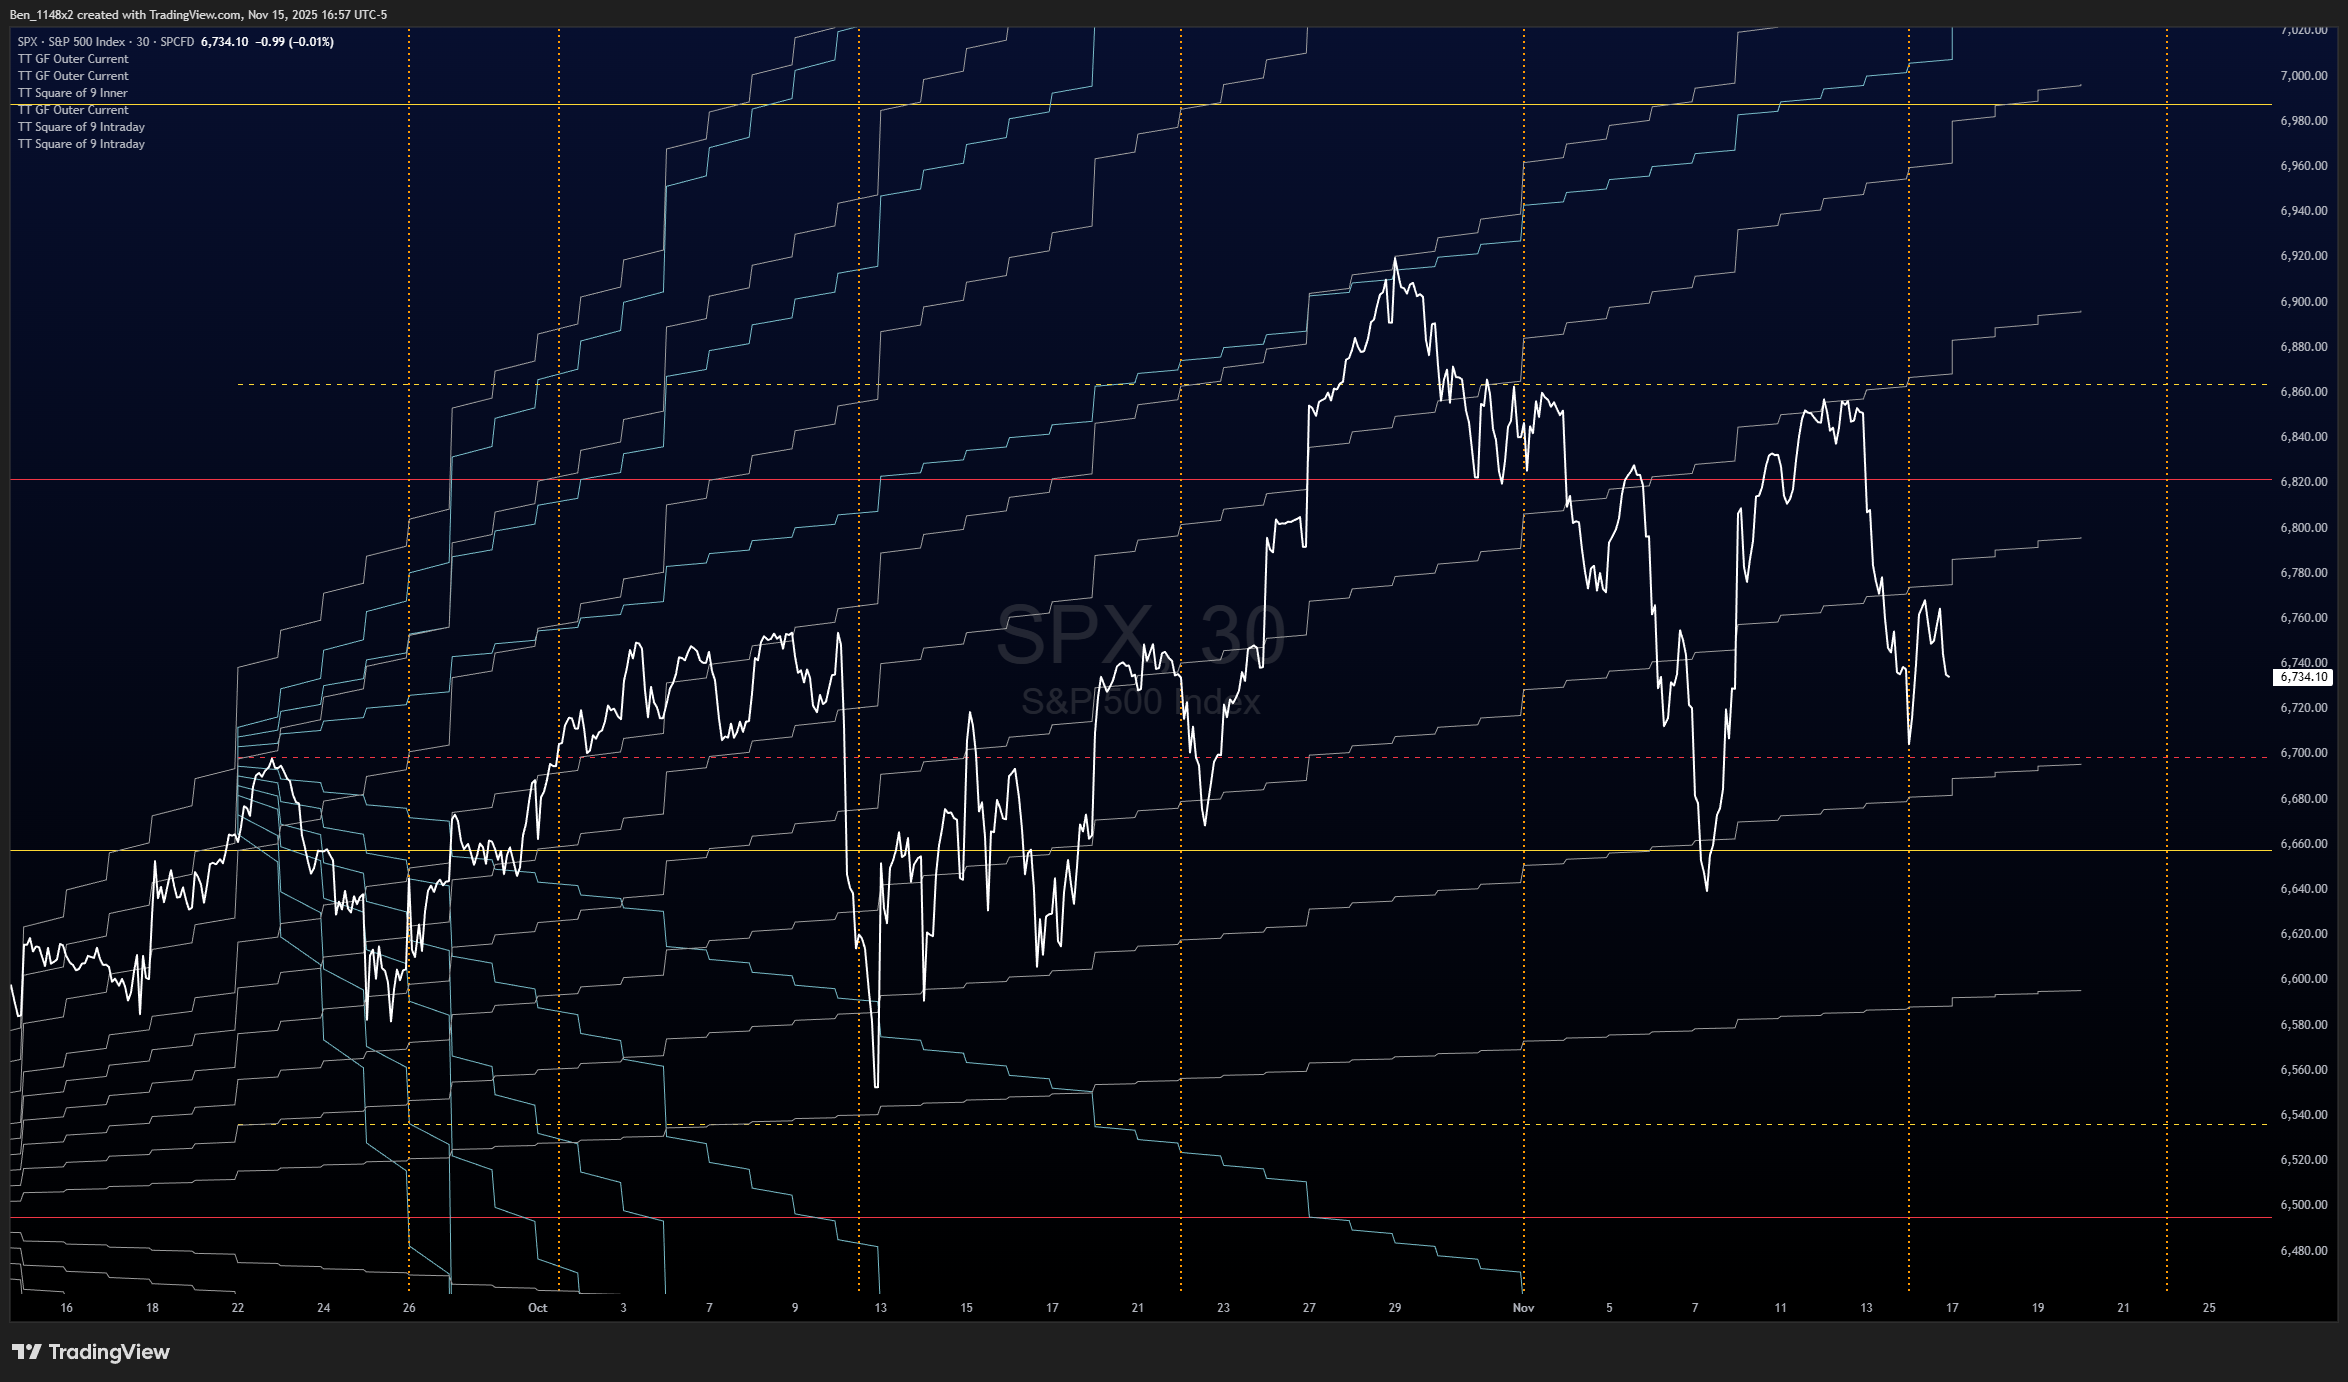
The approach on this chart uses a symmetrical measure from where the Venus cycle resets. Blair reviewed this approach on his subscriber videos over the past two weeks. My variation on this incorporates Connie Browns method of anchoring Fibonacci retraces to strong bars with her confluence zone strategy.
By starting with the cycle reset and looking for areas with large volume, gaps, two bar reversals, and/or wide trading ranges we can identify an area in the past that was influential to market participants outlook. These time frames in the past have aligned to future pivots. the next are Monday 11/17 and Friday 11/28.
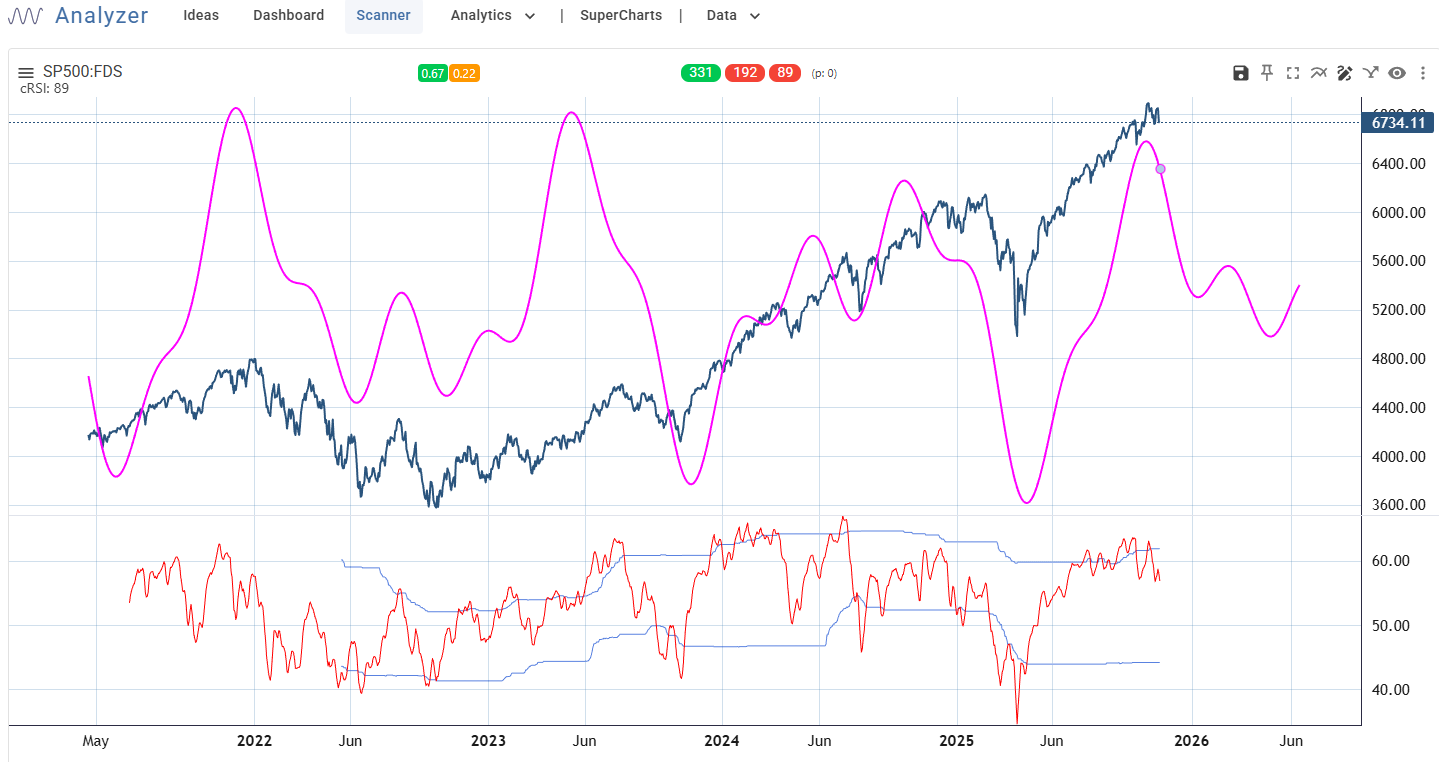
The cycle analyzer suggests that we won’t pivot from the current trend until January. I find this tool to be more effective when we use it with range bound charts, but that it is overly contrarian during strong trends.
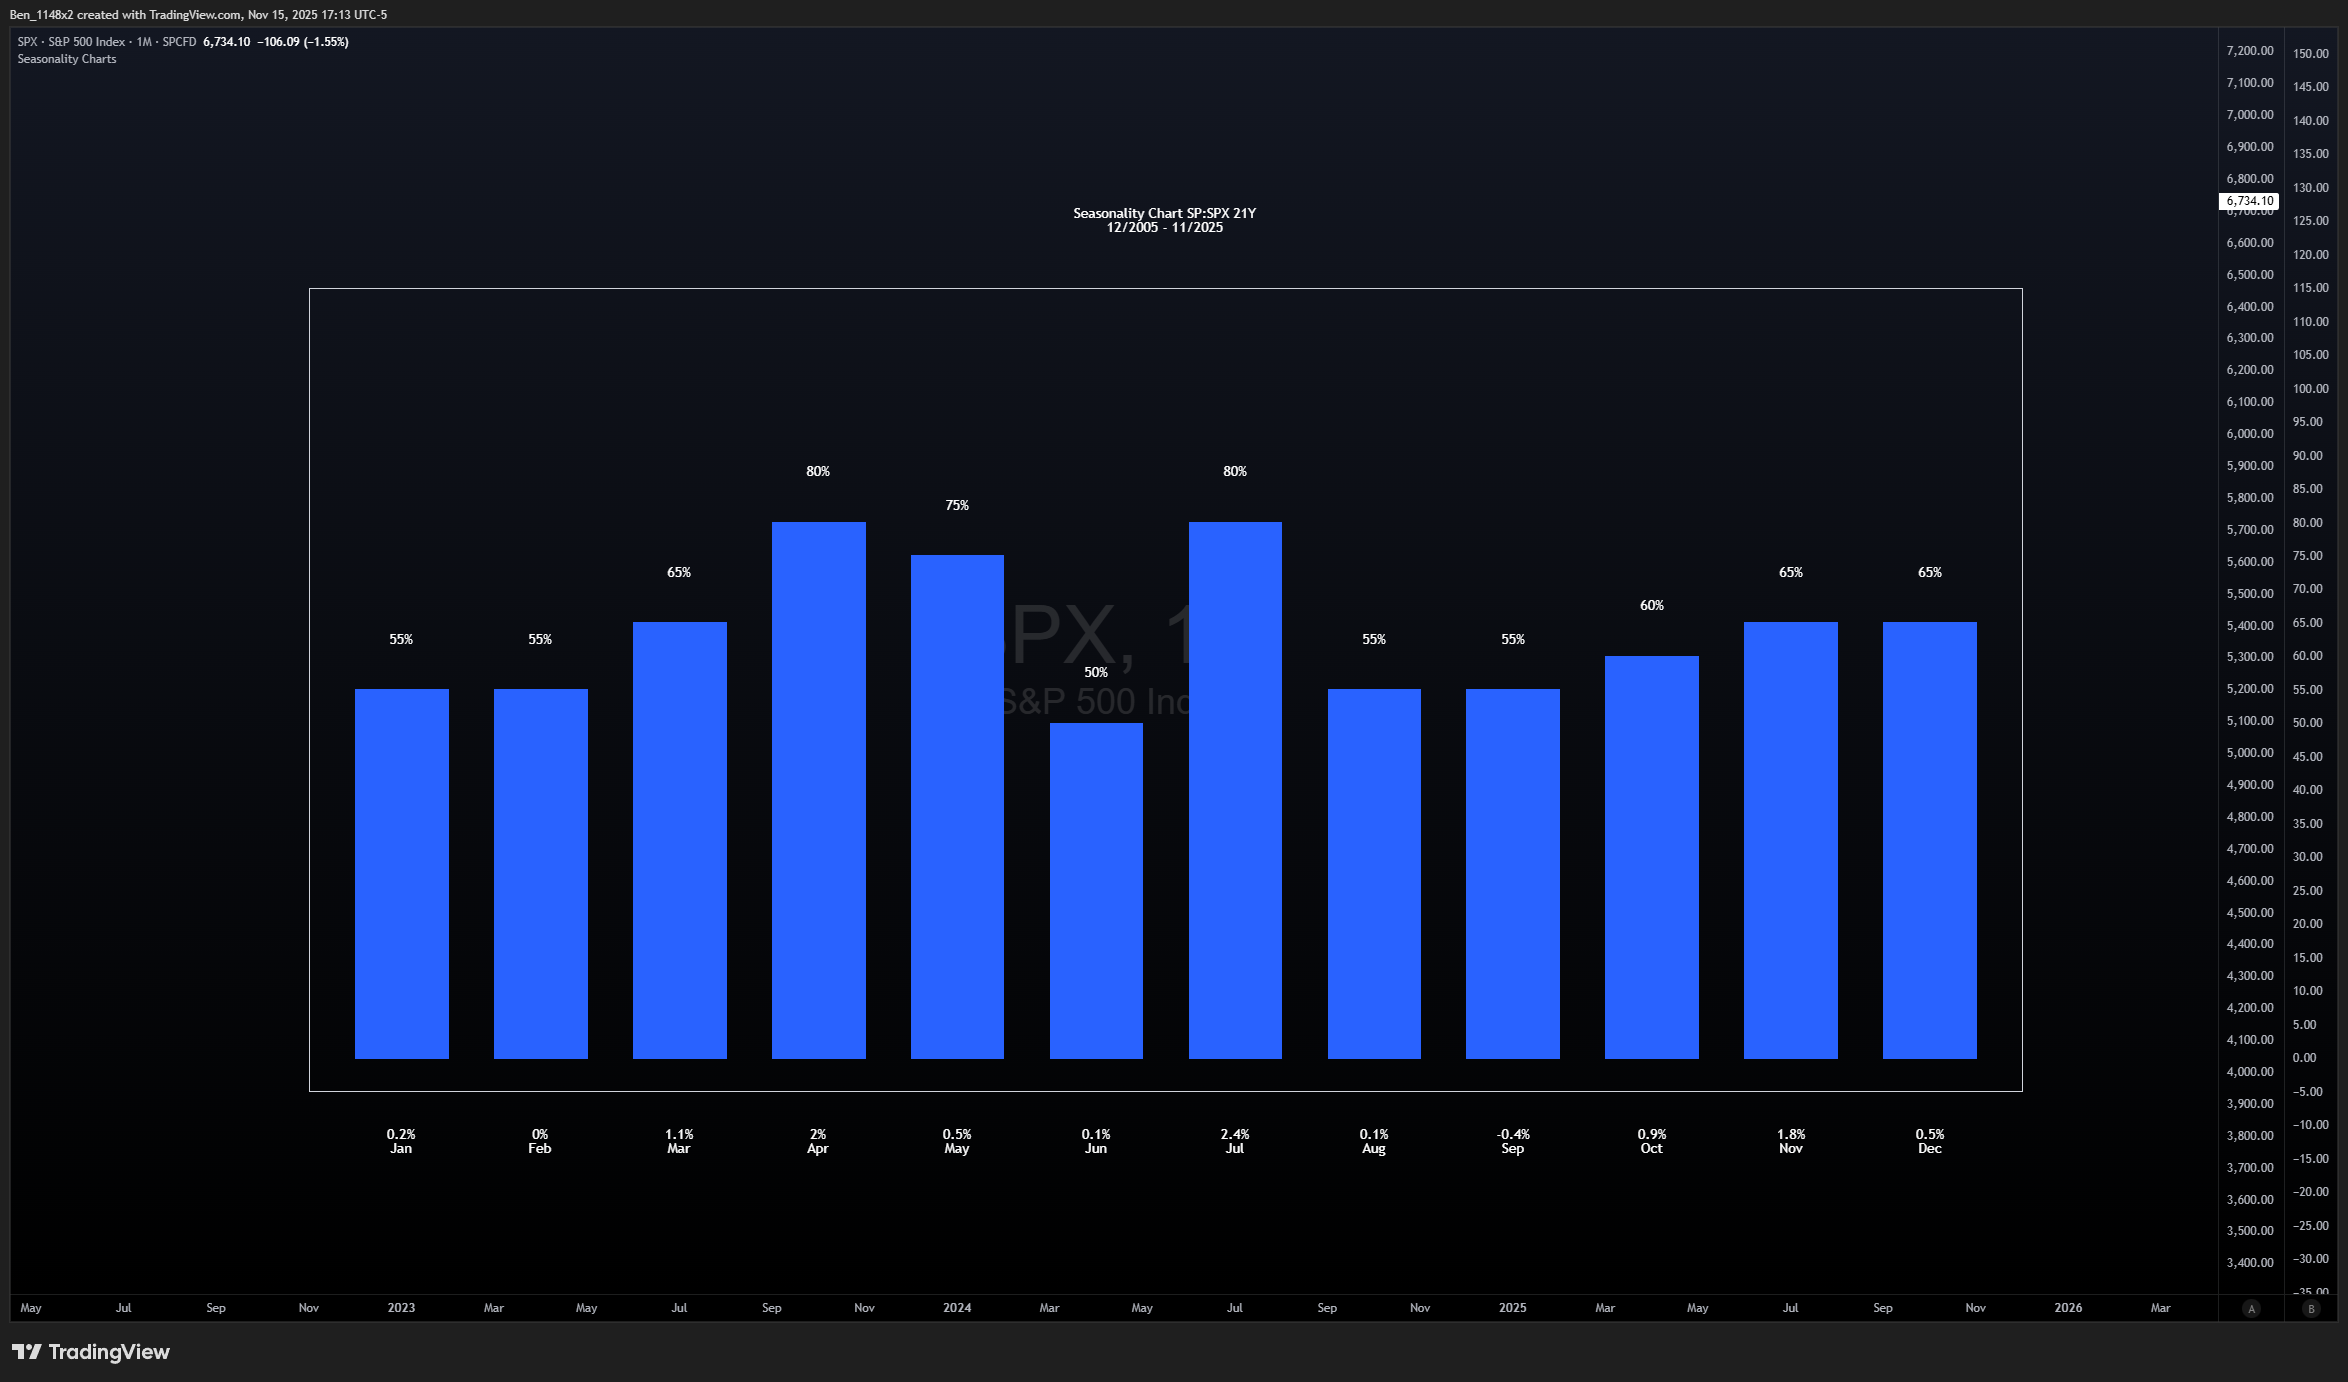
Seasonally, we have entered the strongest six consecutive months.
Recapping key dates and consideration of the upcoming holiday:
11/17, 11/24, and 11/28 are identified on the timing charts.
11/18 is when we move 15 sessions away from the S&P ATH, removing the risk of triggering a 5% drawdown alert.
11/19 is when the Nasdaq is 15 sessions from its ATH and when NVDA reports earnings.
The day period of Wednesday to Friday on Thanksgiving week have ended higher 56% of times since 1988.
If we are beyond the 11/18 and 11/19 without a 5% alert, I want to take short term bullish trades and take quick profits into the Weds and Fri sessions before and after Thanksgiving.
Gold
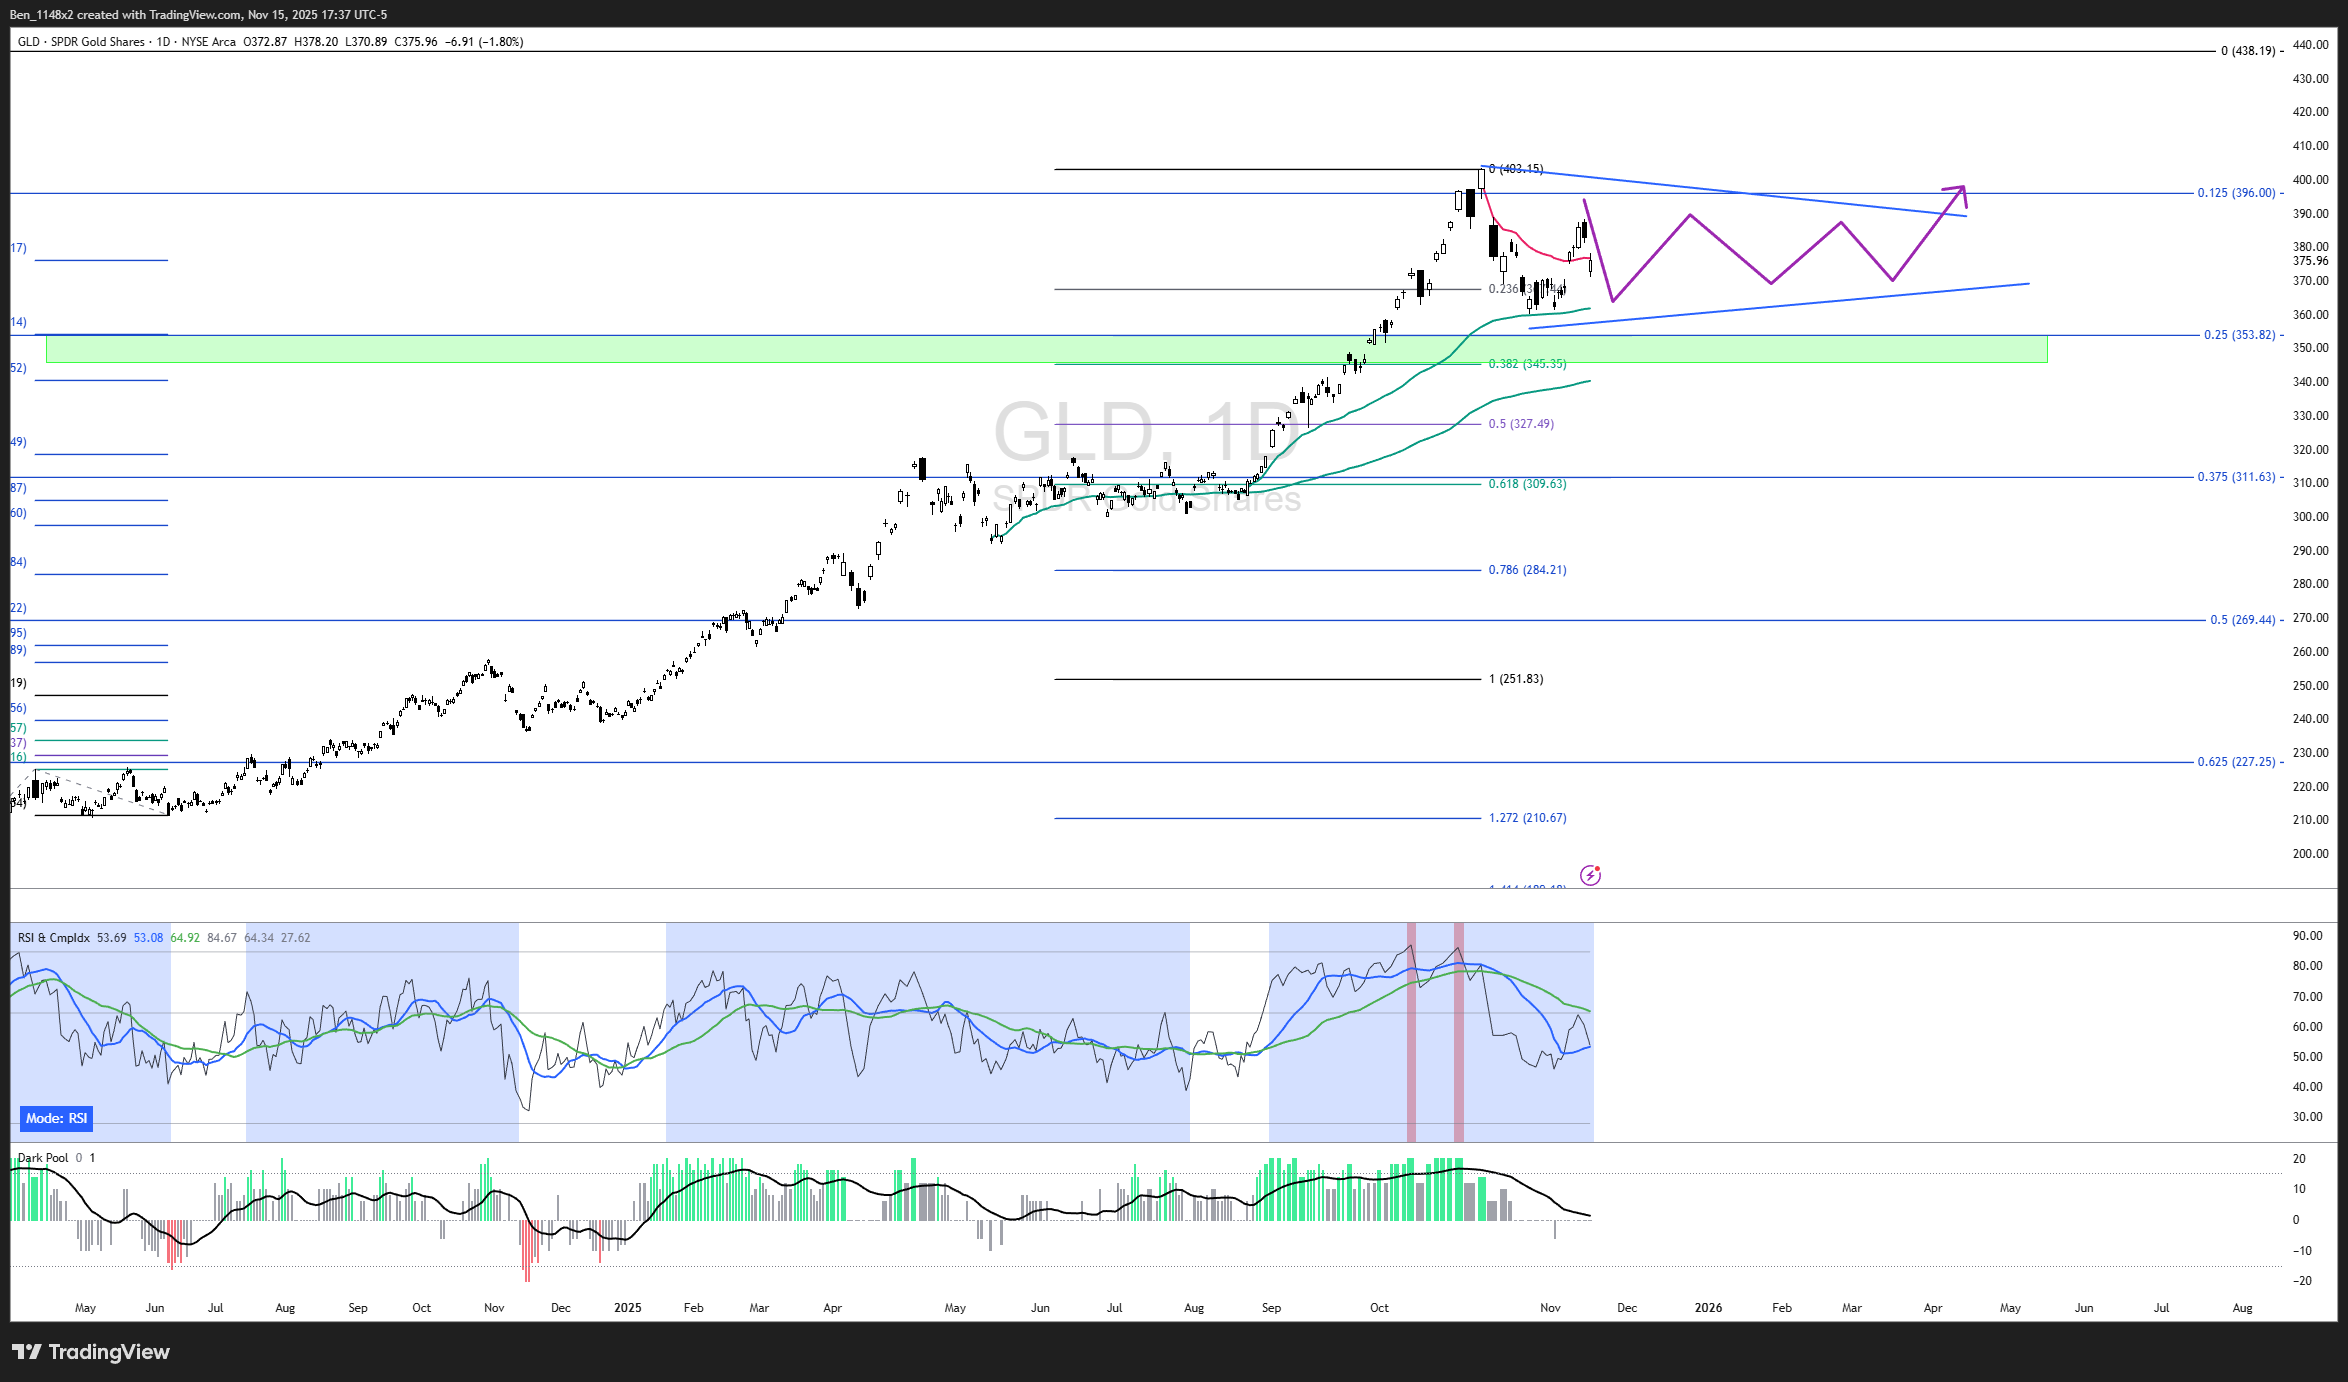
Working from the 8 year cycle in gold, I plan to remain long.
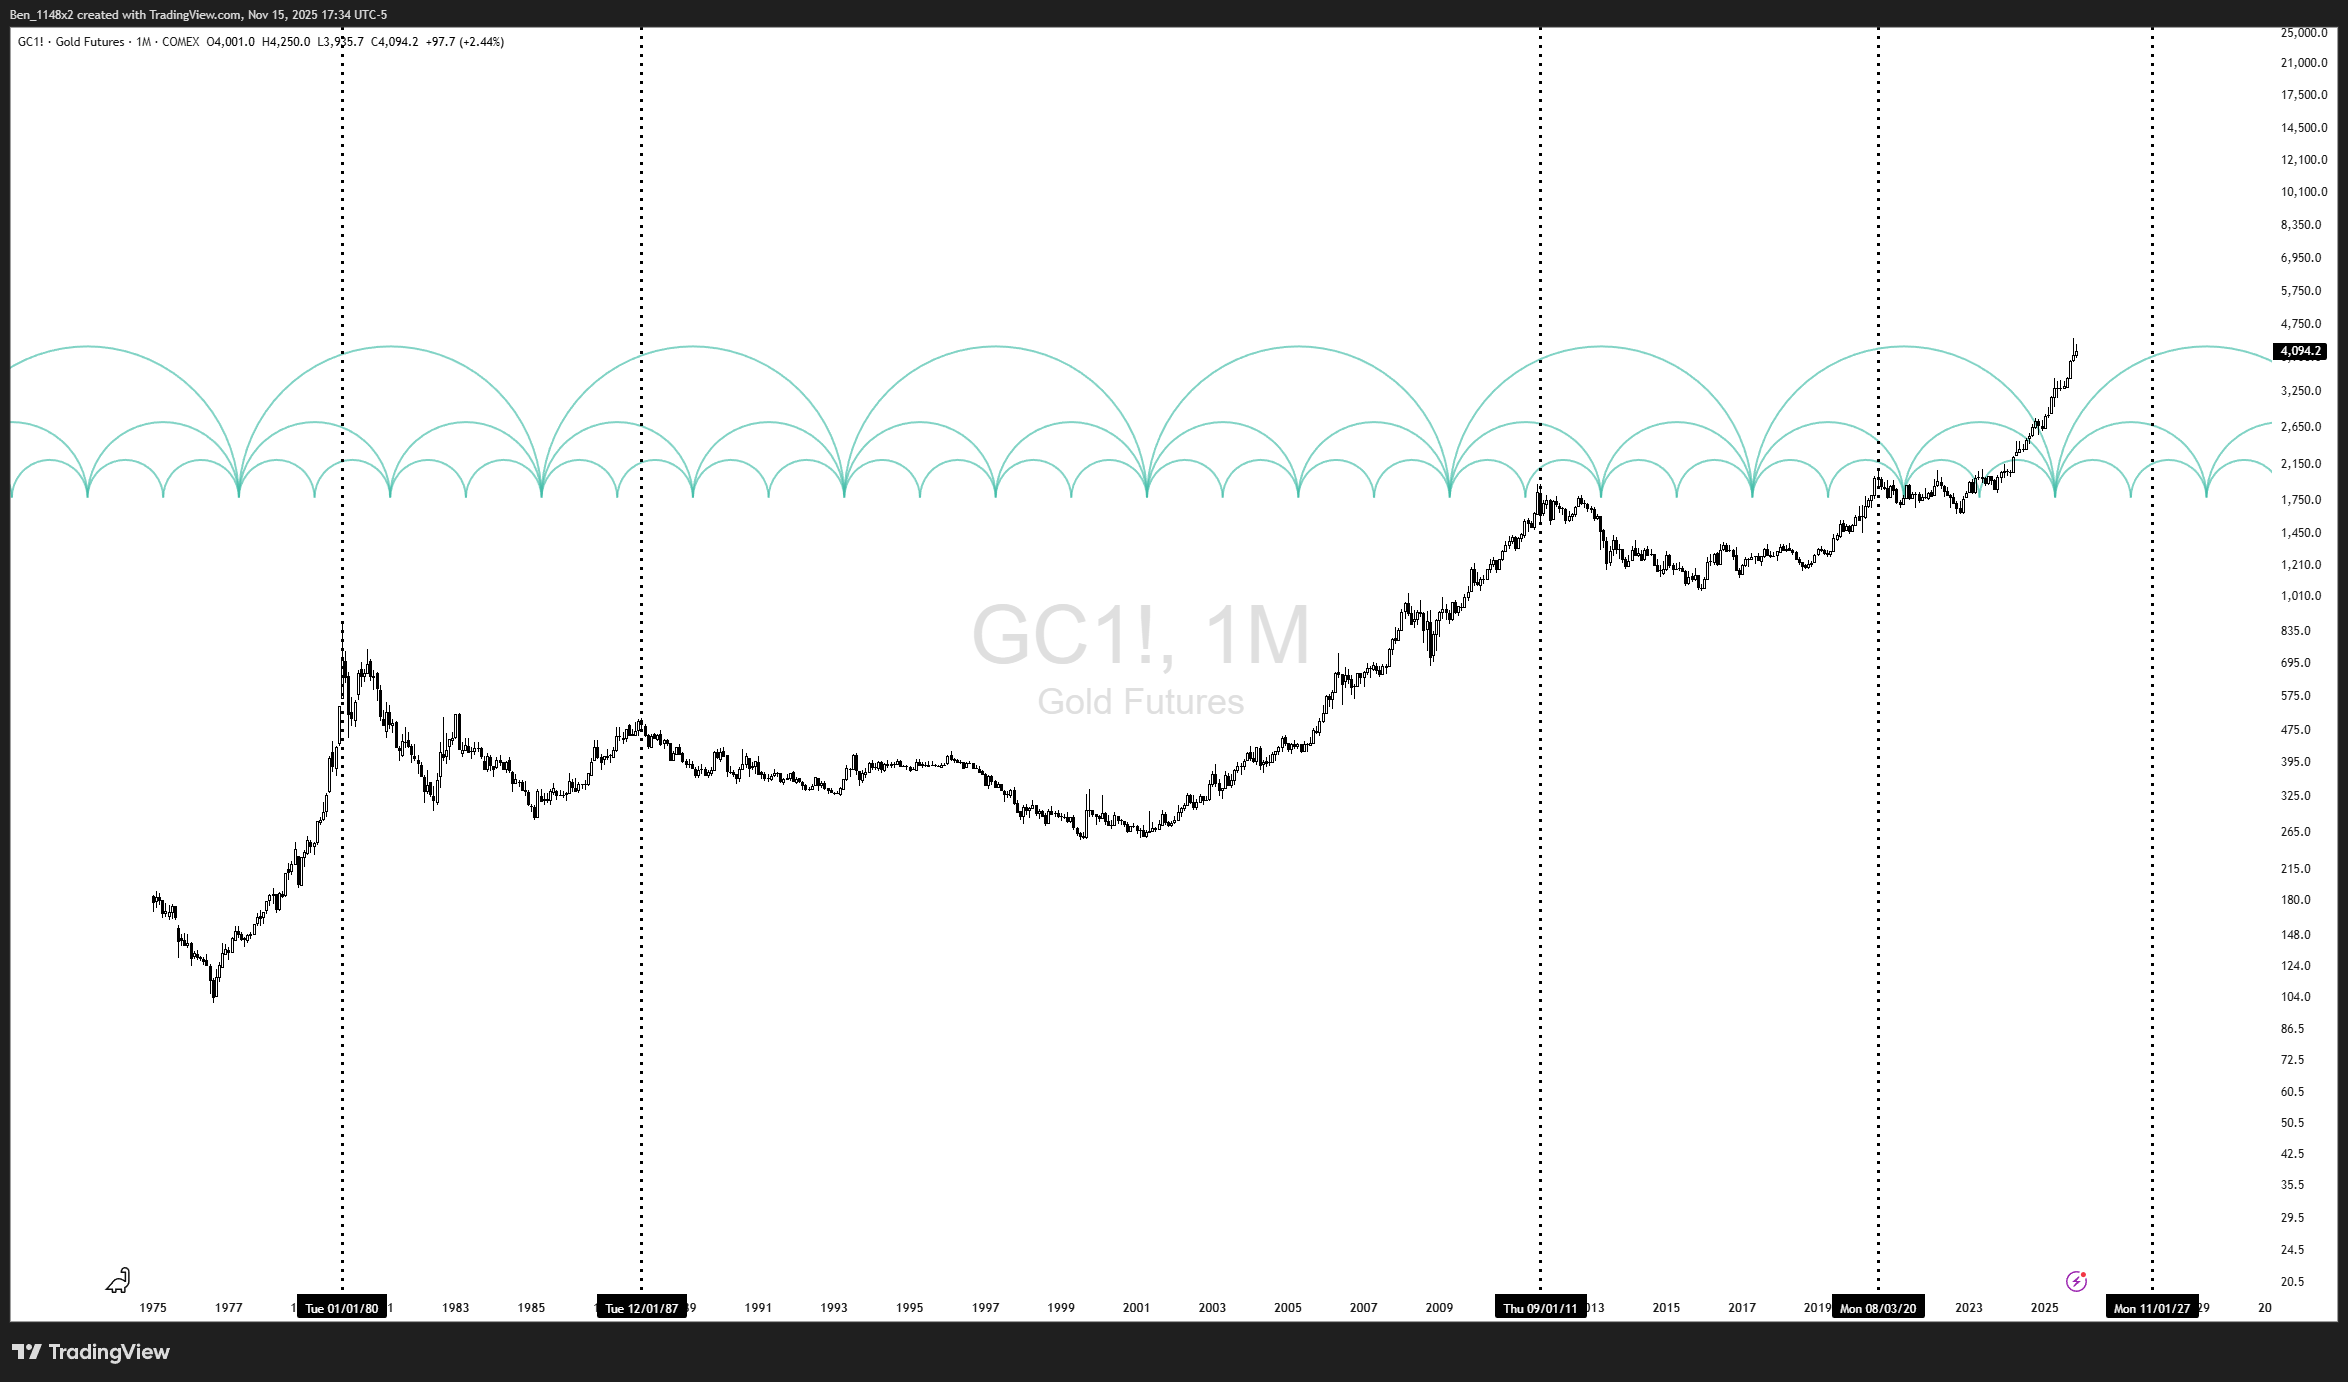
I am interested any time GLD gets within the 355-363 range. The indicator at the bottom is a hybrid volume based indicator intended to help identify accumulation during a consolidation. Relatively flat like this means that we are seeing that now.
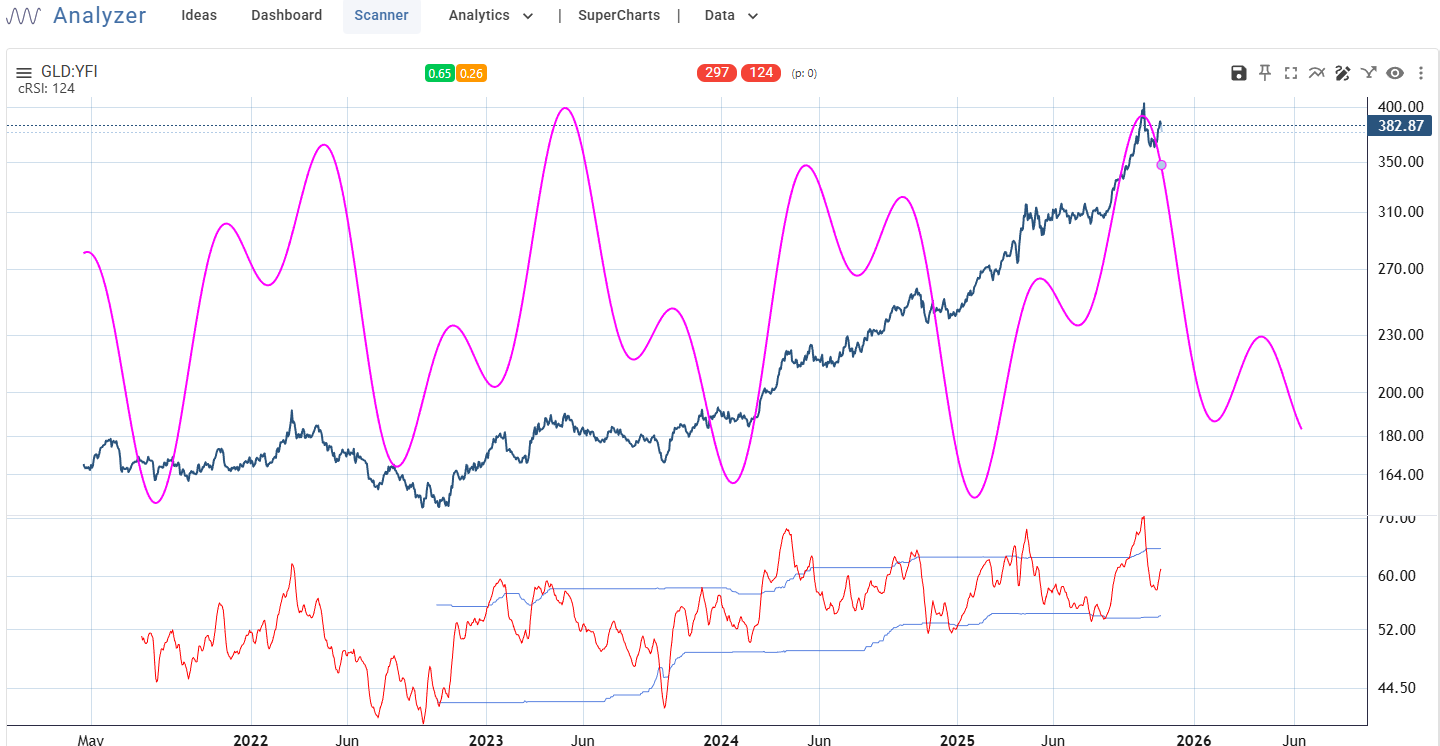
The cycle analyzer anticipates early February as a pivot point.
Bitcoin
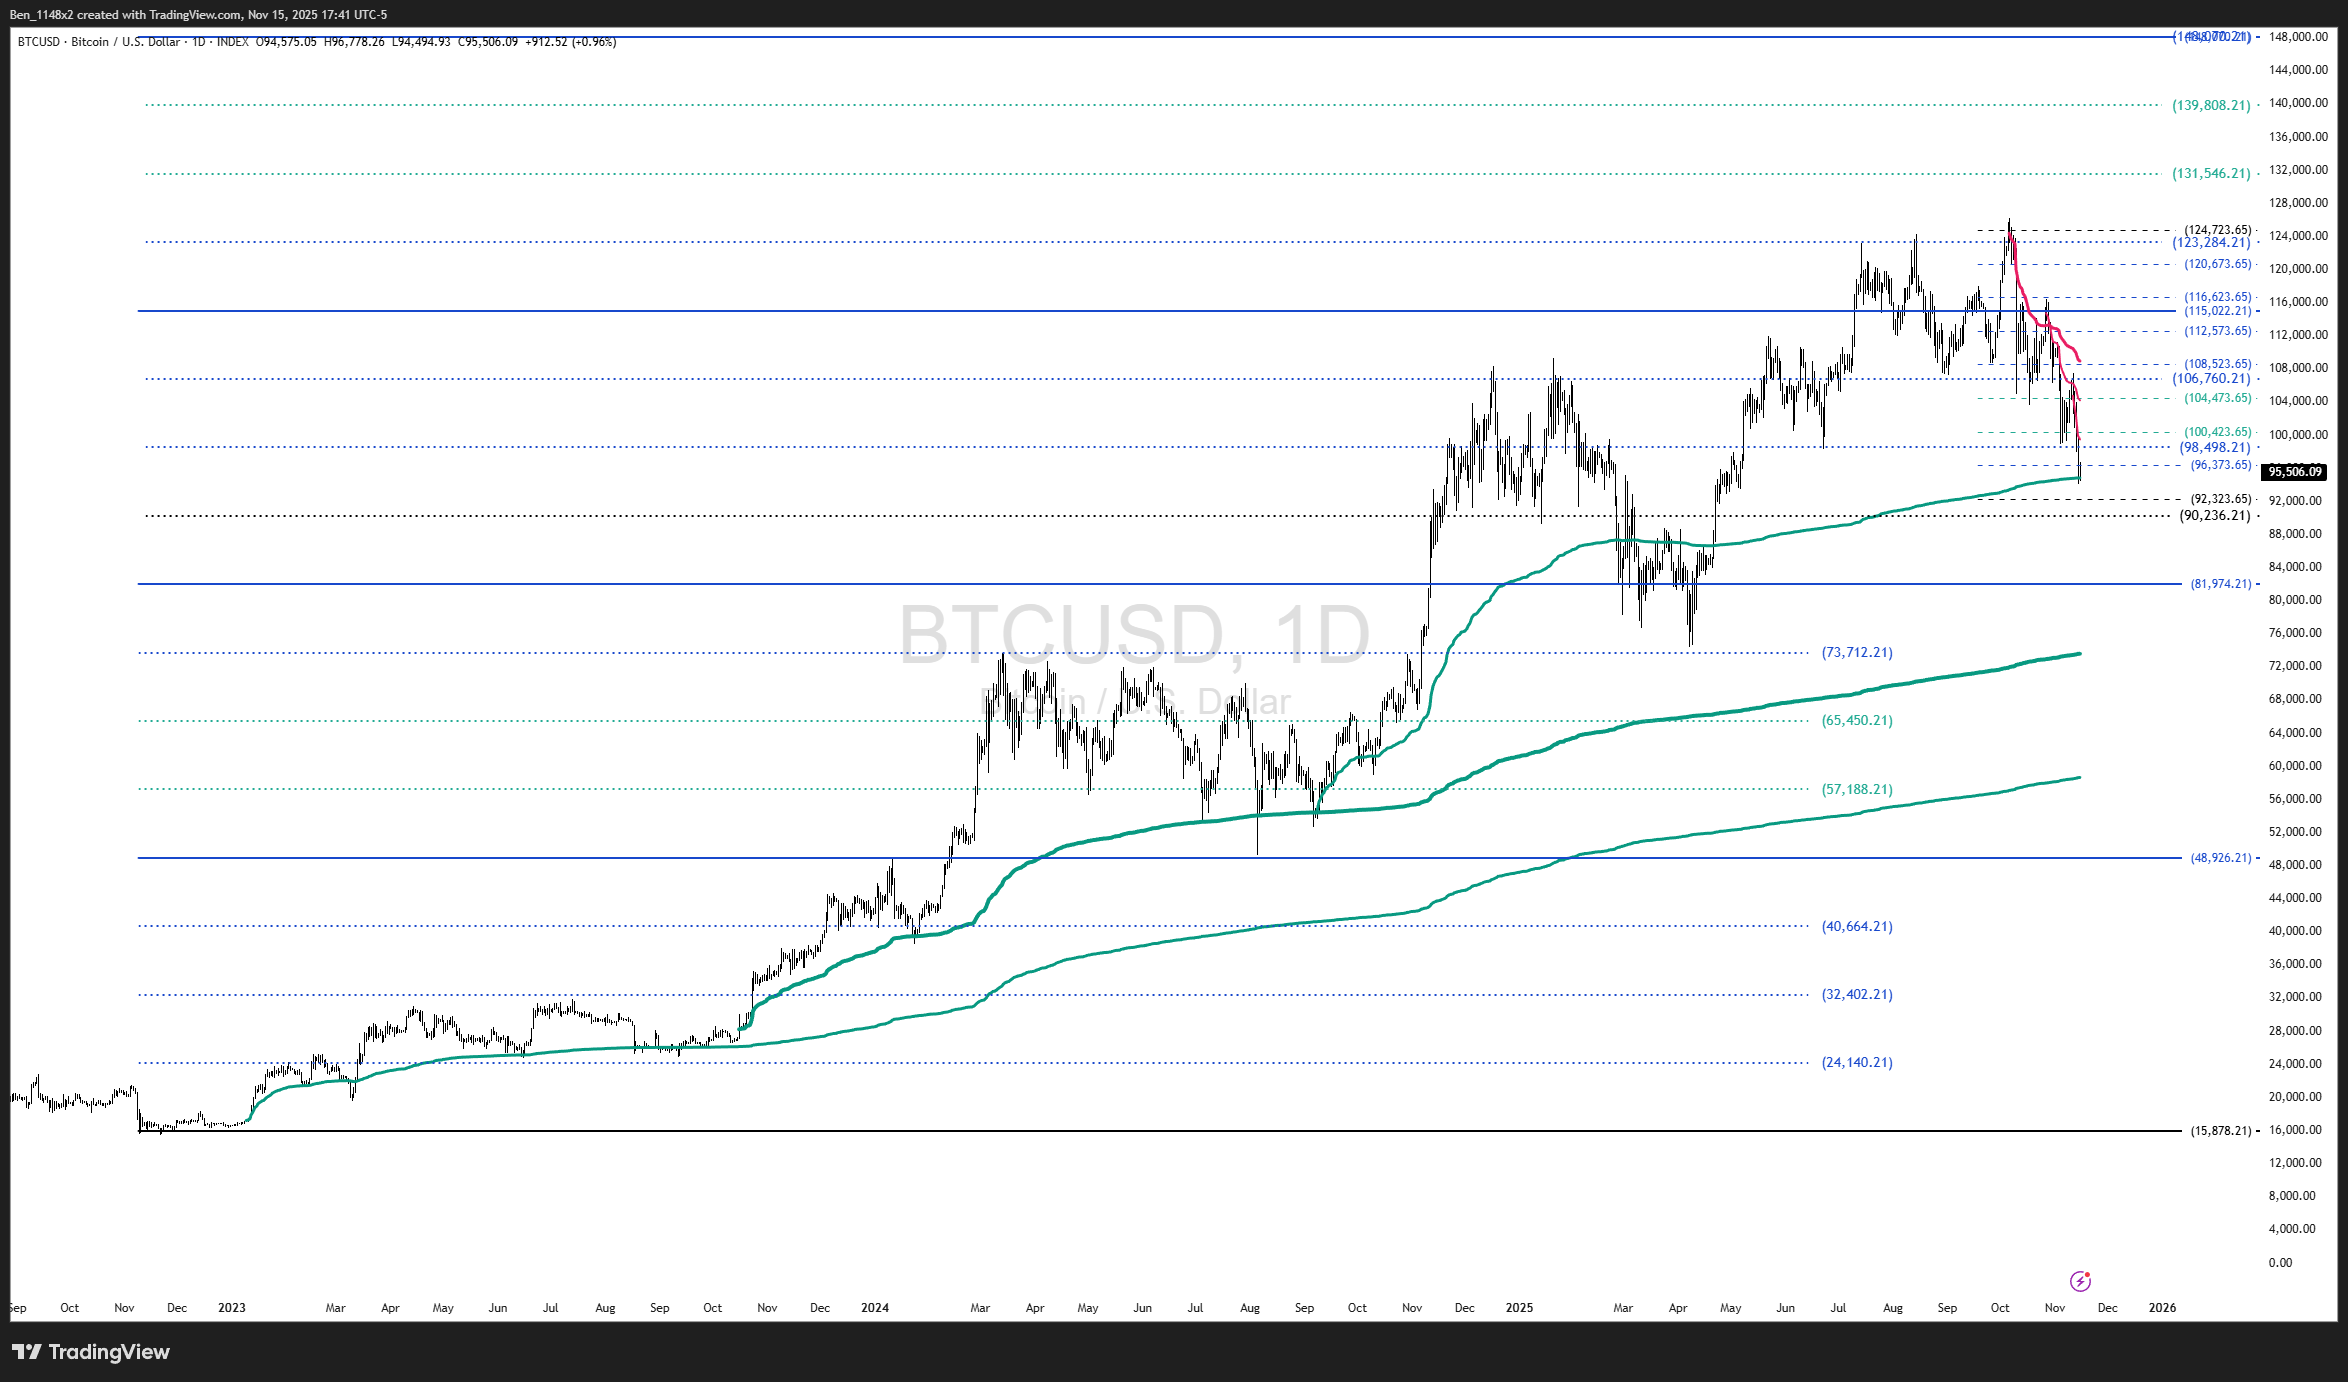
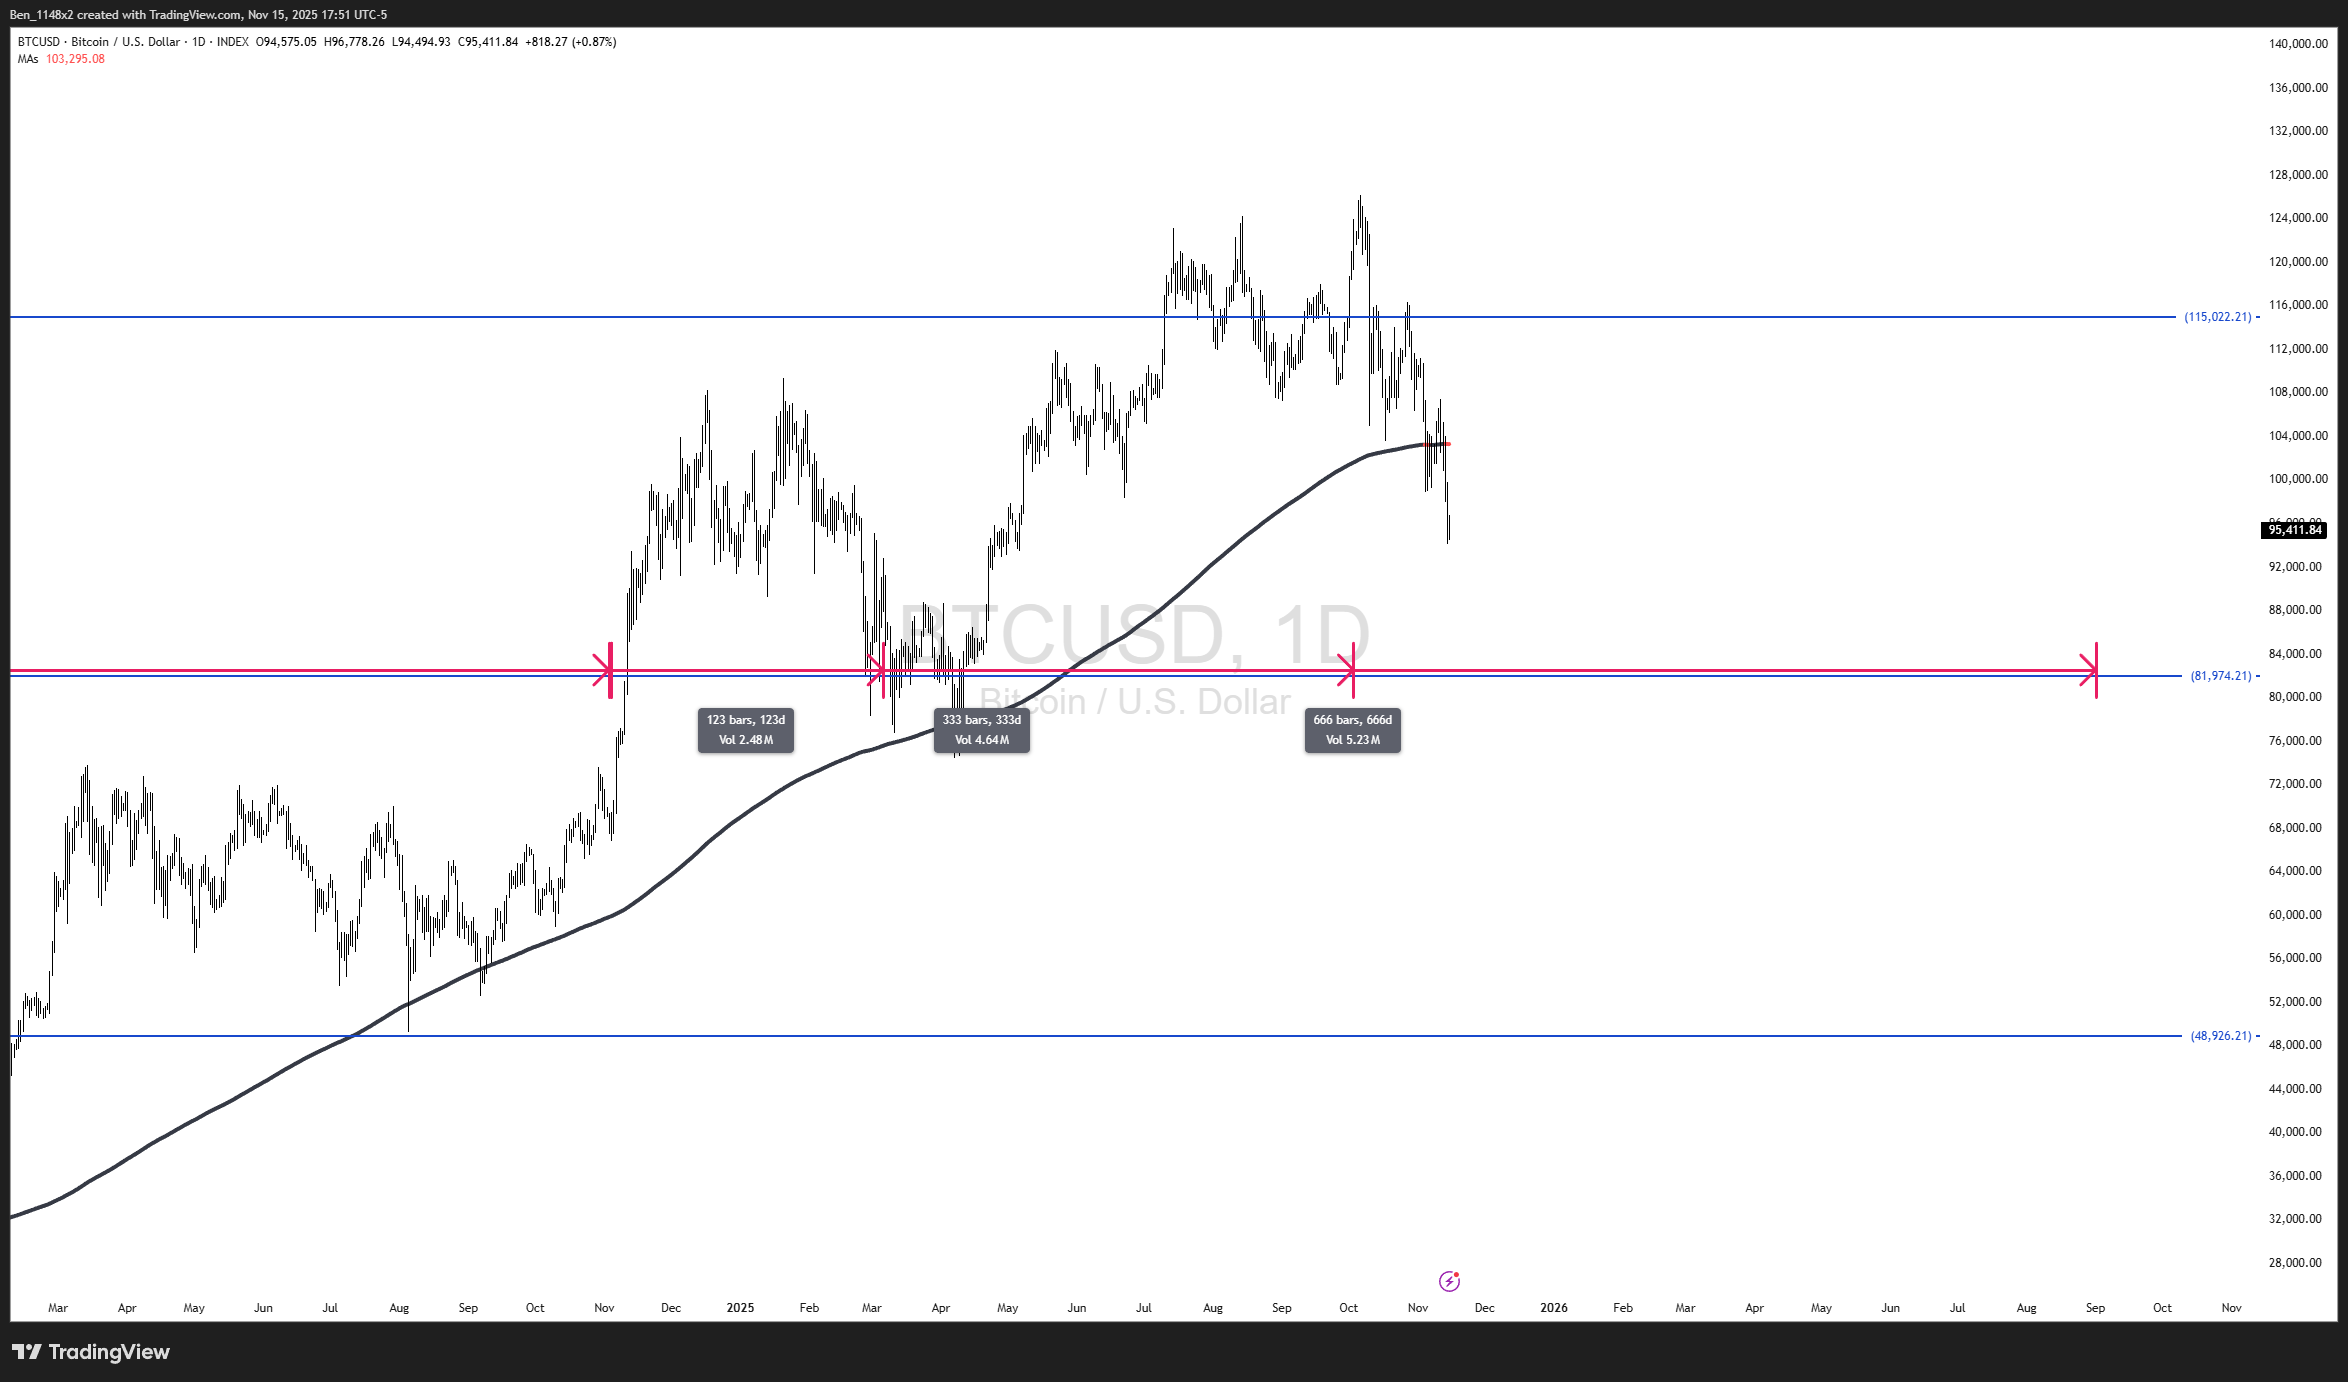
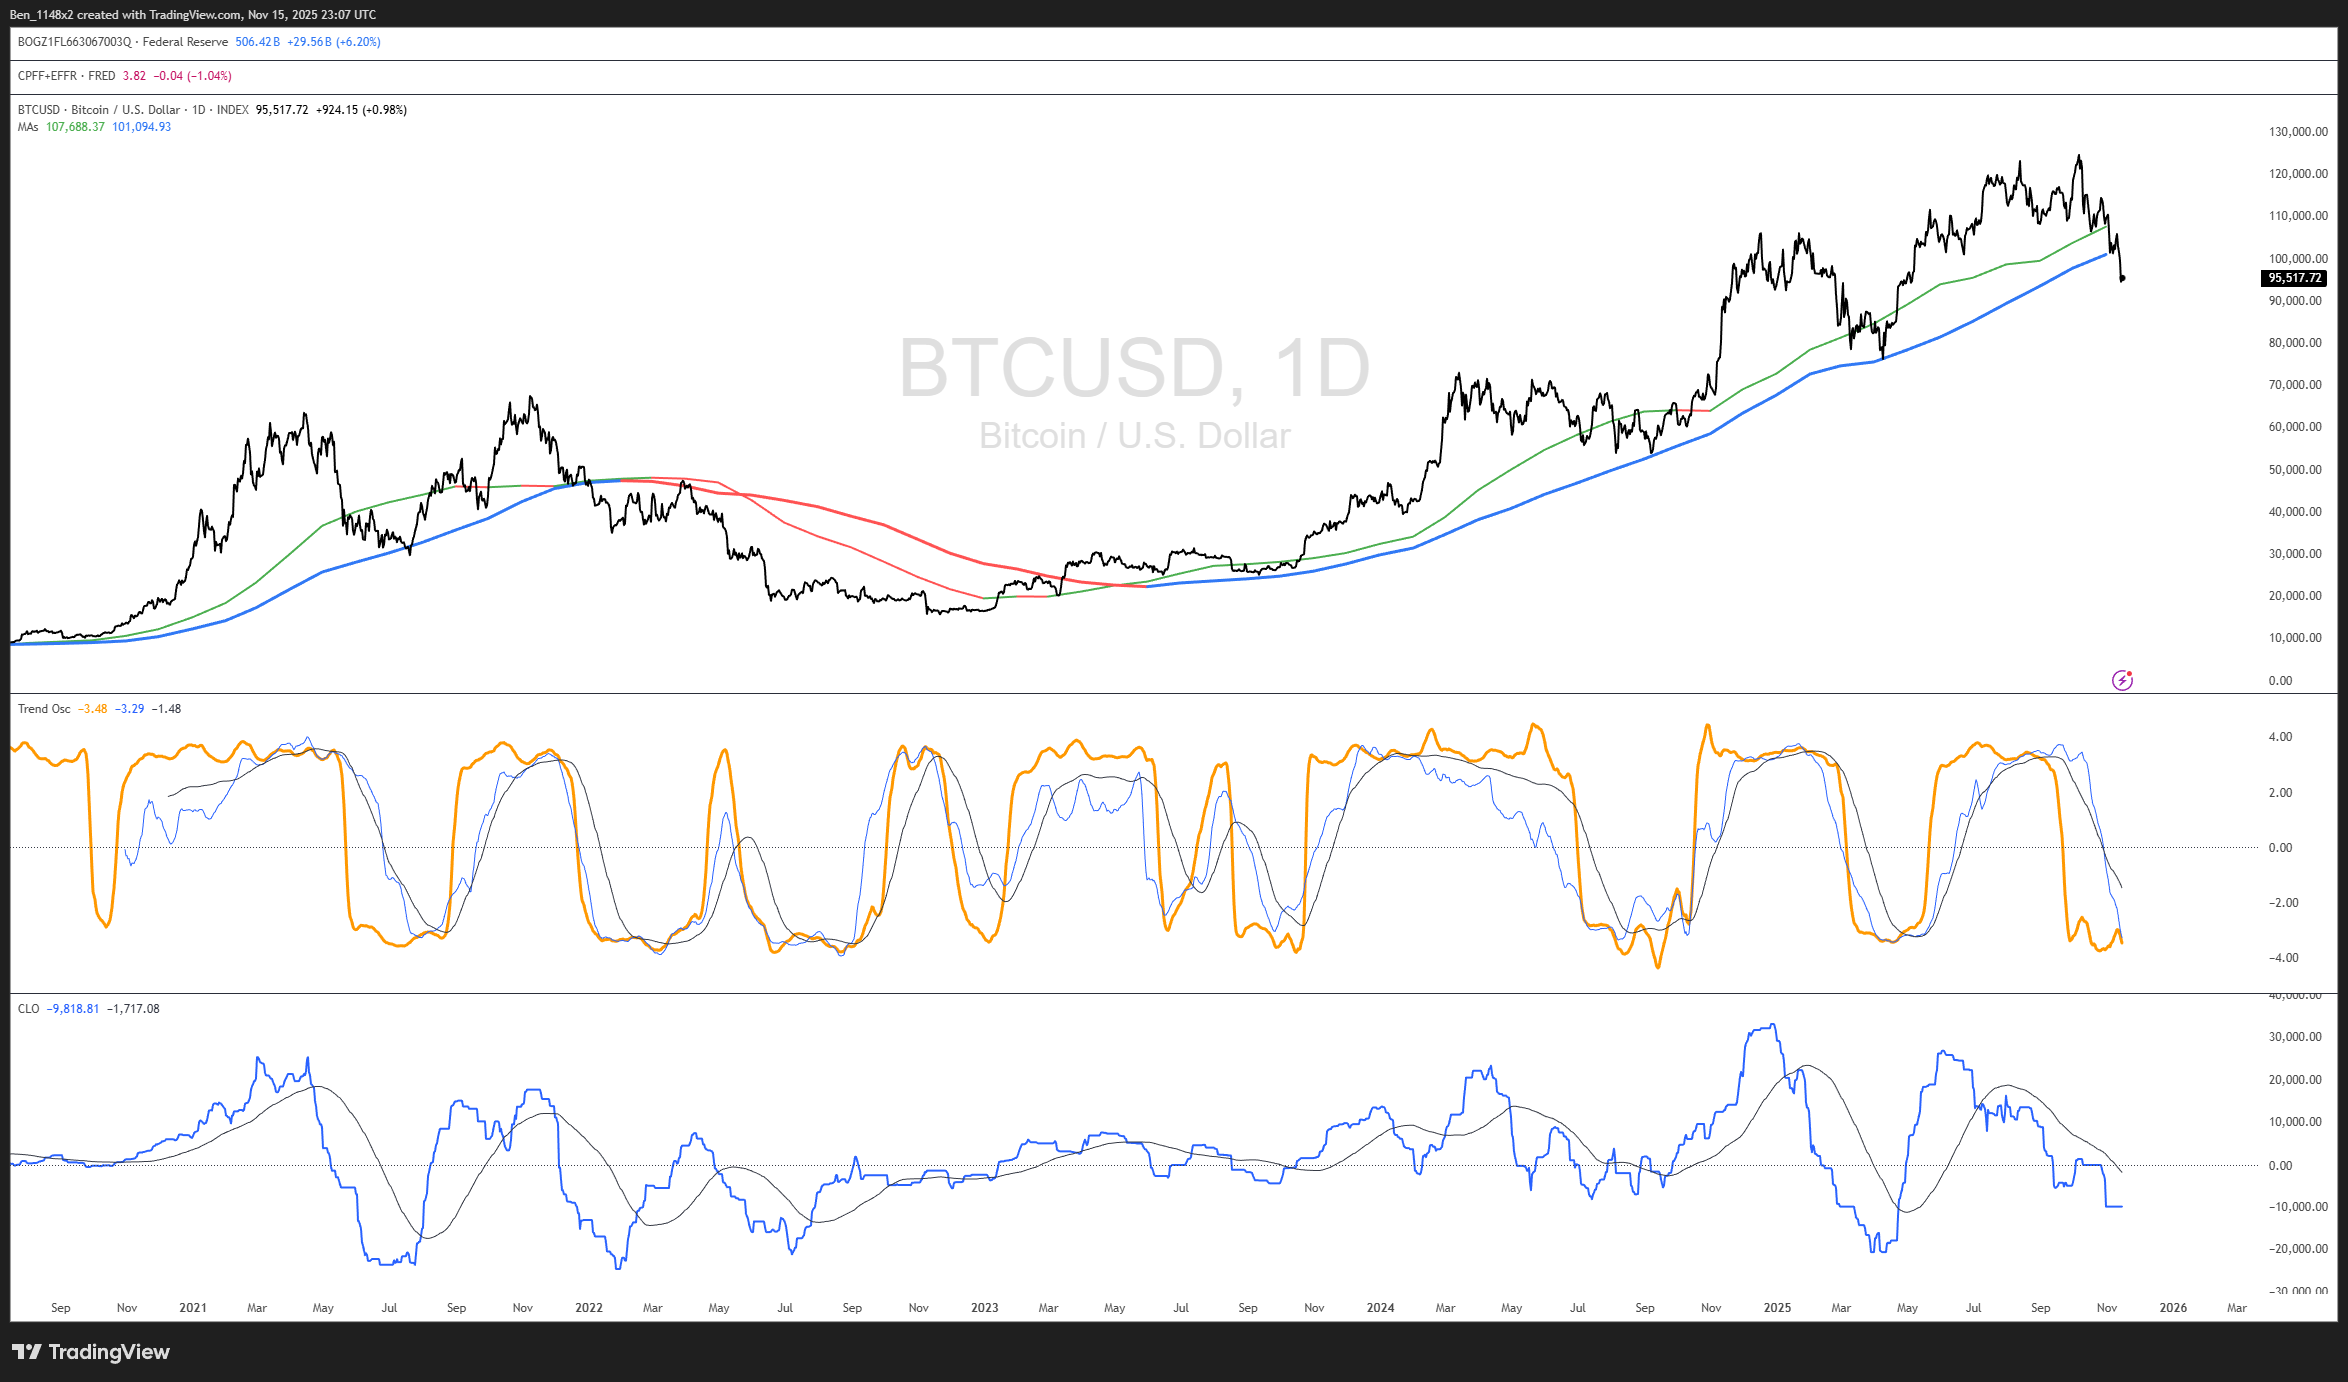
I have a lot of concern for BTC here. We lost the AVWAP that handed off from the April low (no longer on the chart) and we are testing the AVWAP from the September 2024 handoff.
Gann was big on using cycle dates that were referenced in the bible.
“Blessed is he who waits and comes to the one thousand three hundred and thirty-five days.” Daniel 12:12
1335 is roughly a 3.5 year cycle. This is equivalent to the average Kitchin inventory cycle. The most important moving average for me with BTC is the 325SMA. This is nearly 1/4 of 1335.
Below we can see that BTC took 1335 days to form a base between the 2020 high and the 2024 breakout. When I draw bases I look for strong moves from the breakout to take place within 1/4 to 1/2 of the timeframe of the base. 1/2 of the 1335 base coincides with the October high.
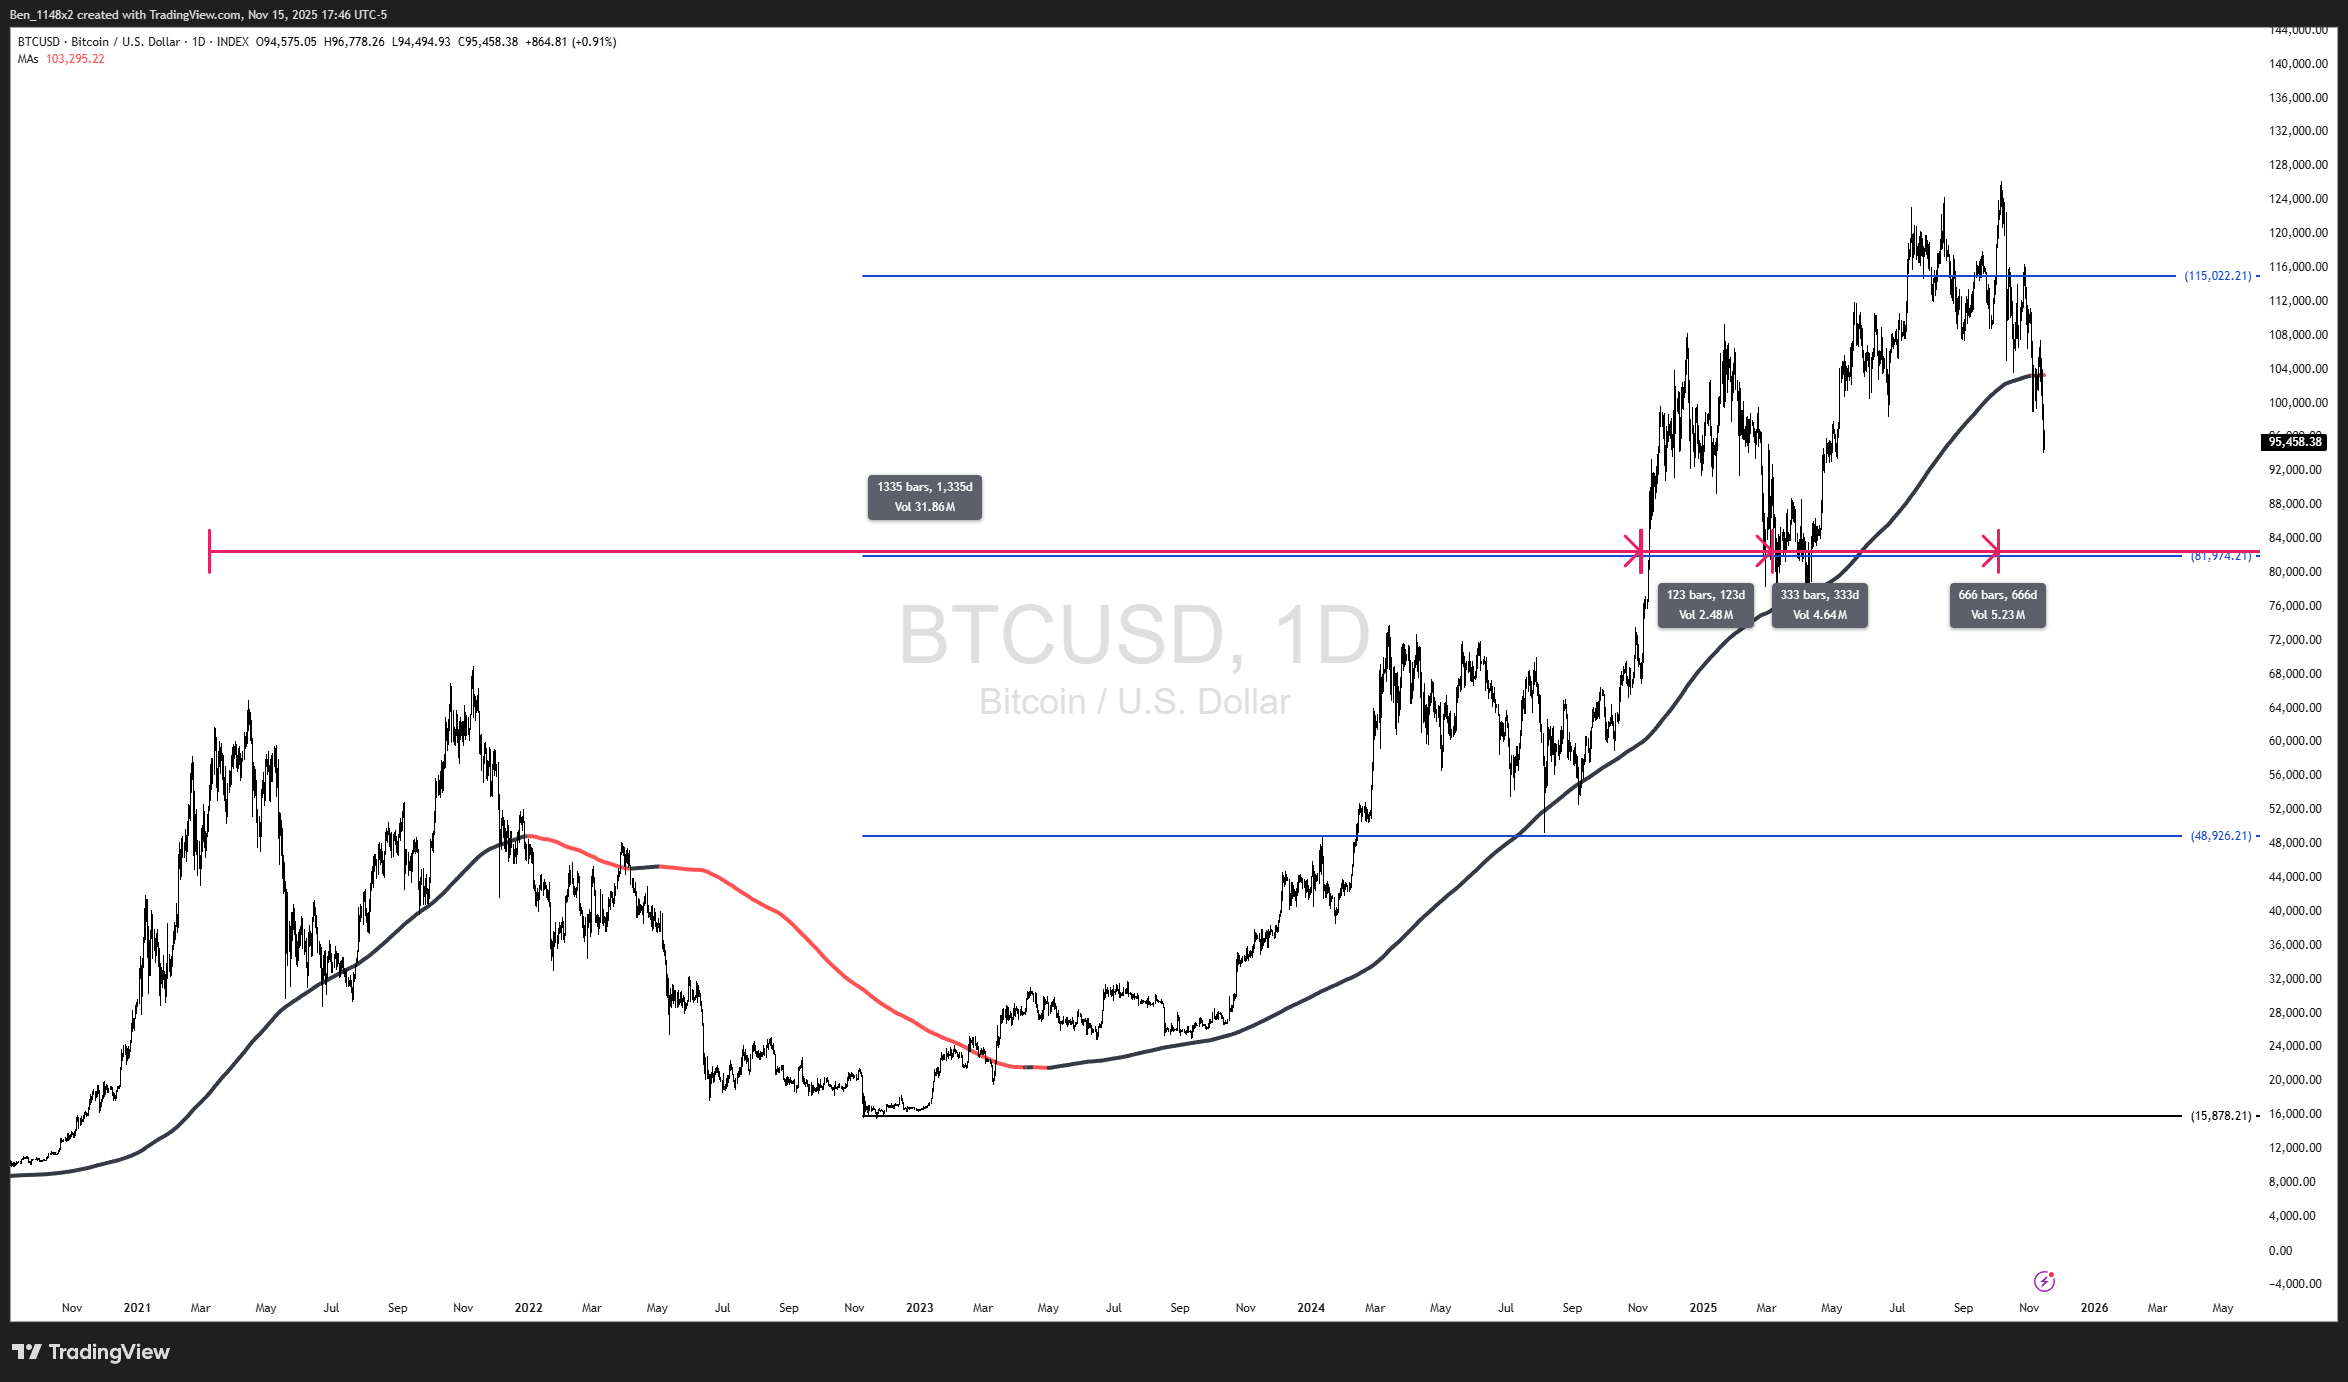
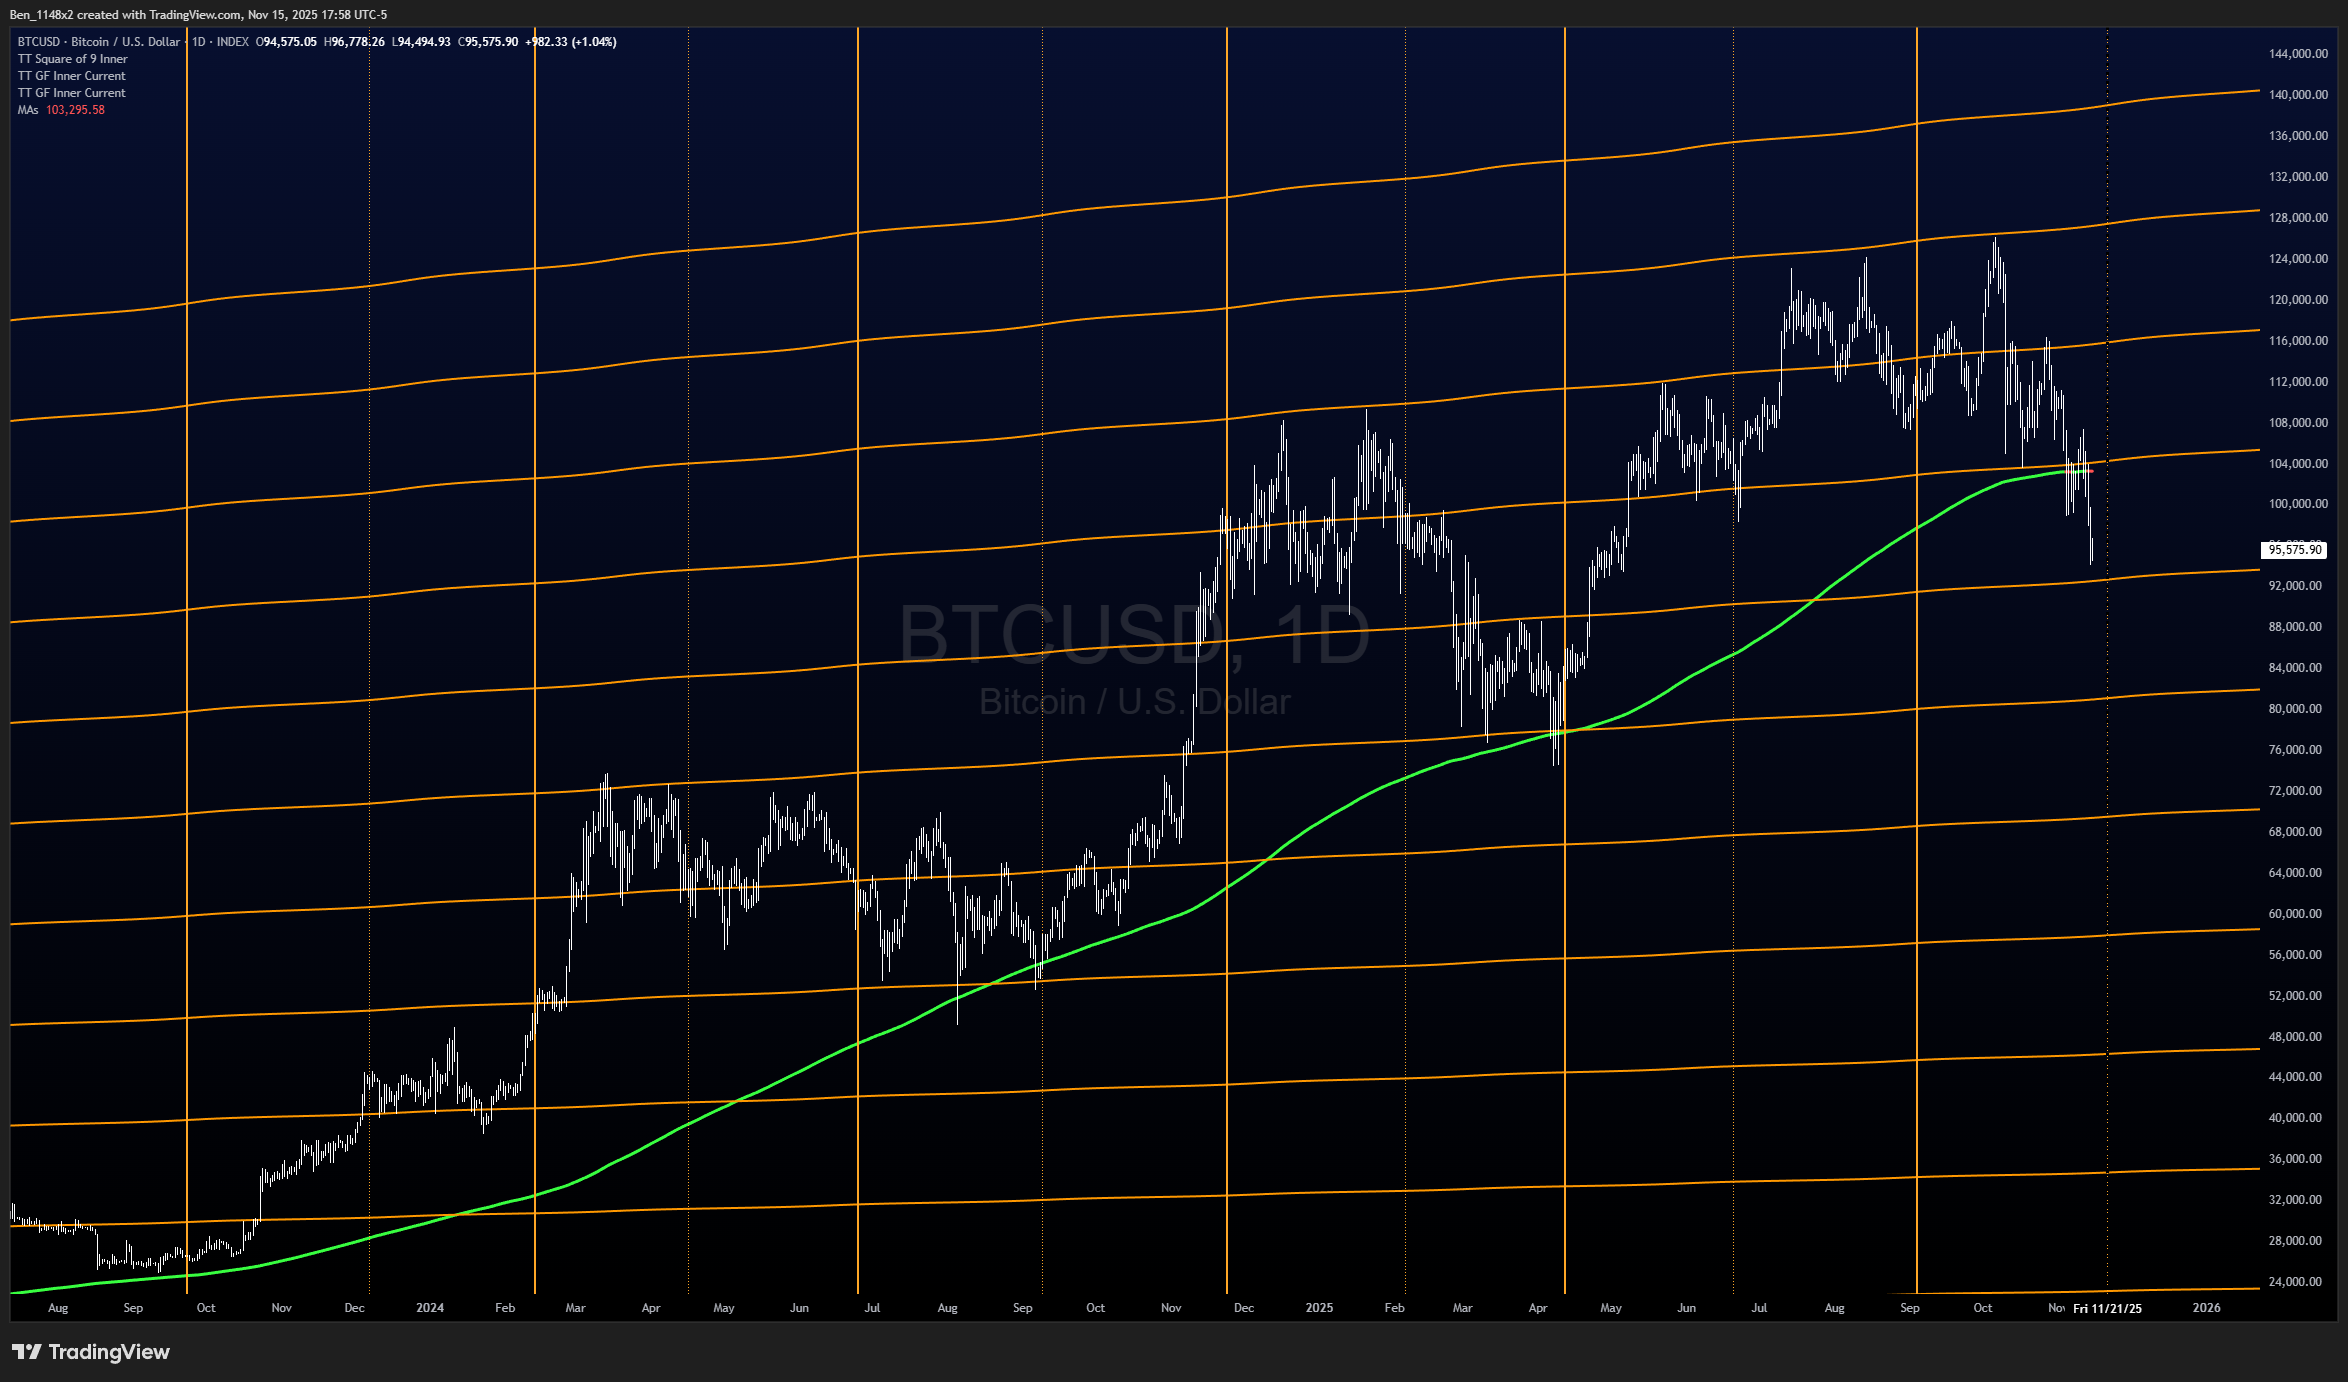
This suggests that we could consolidate through September 2026. Note that we are below a descending 325SMA for the first time since 2022.
When these slow cyclic tools roll over in BTC it is common for us to see very strong bounces. 11/20 is the next date of interest on the astrological chart. If we see strong NVDA earnings and a rebound in equities, I could see 11/20 being bullish pivot for BTC.
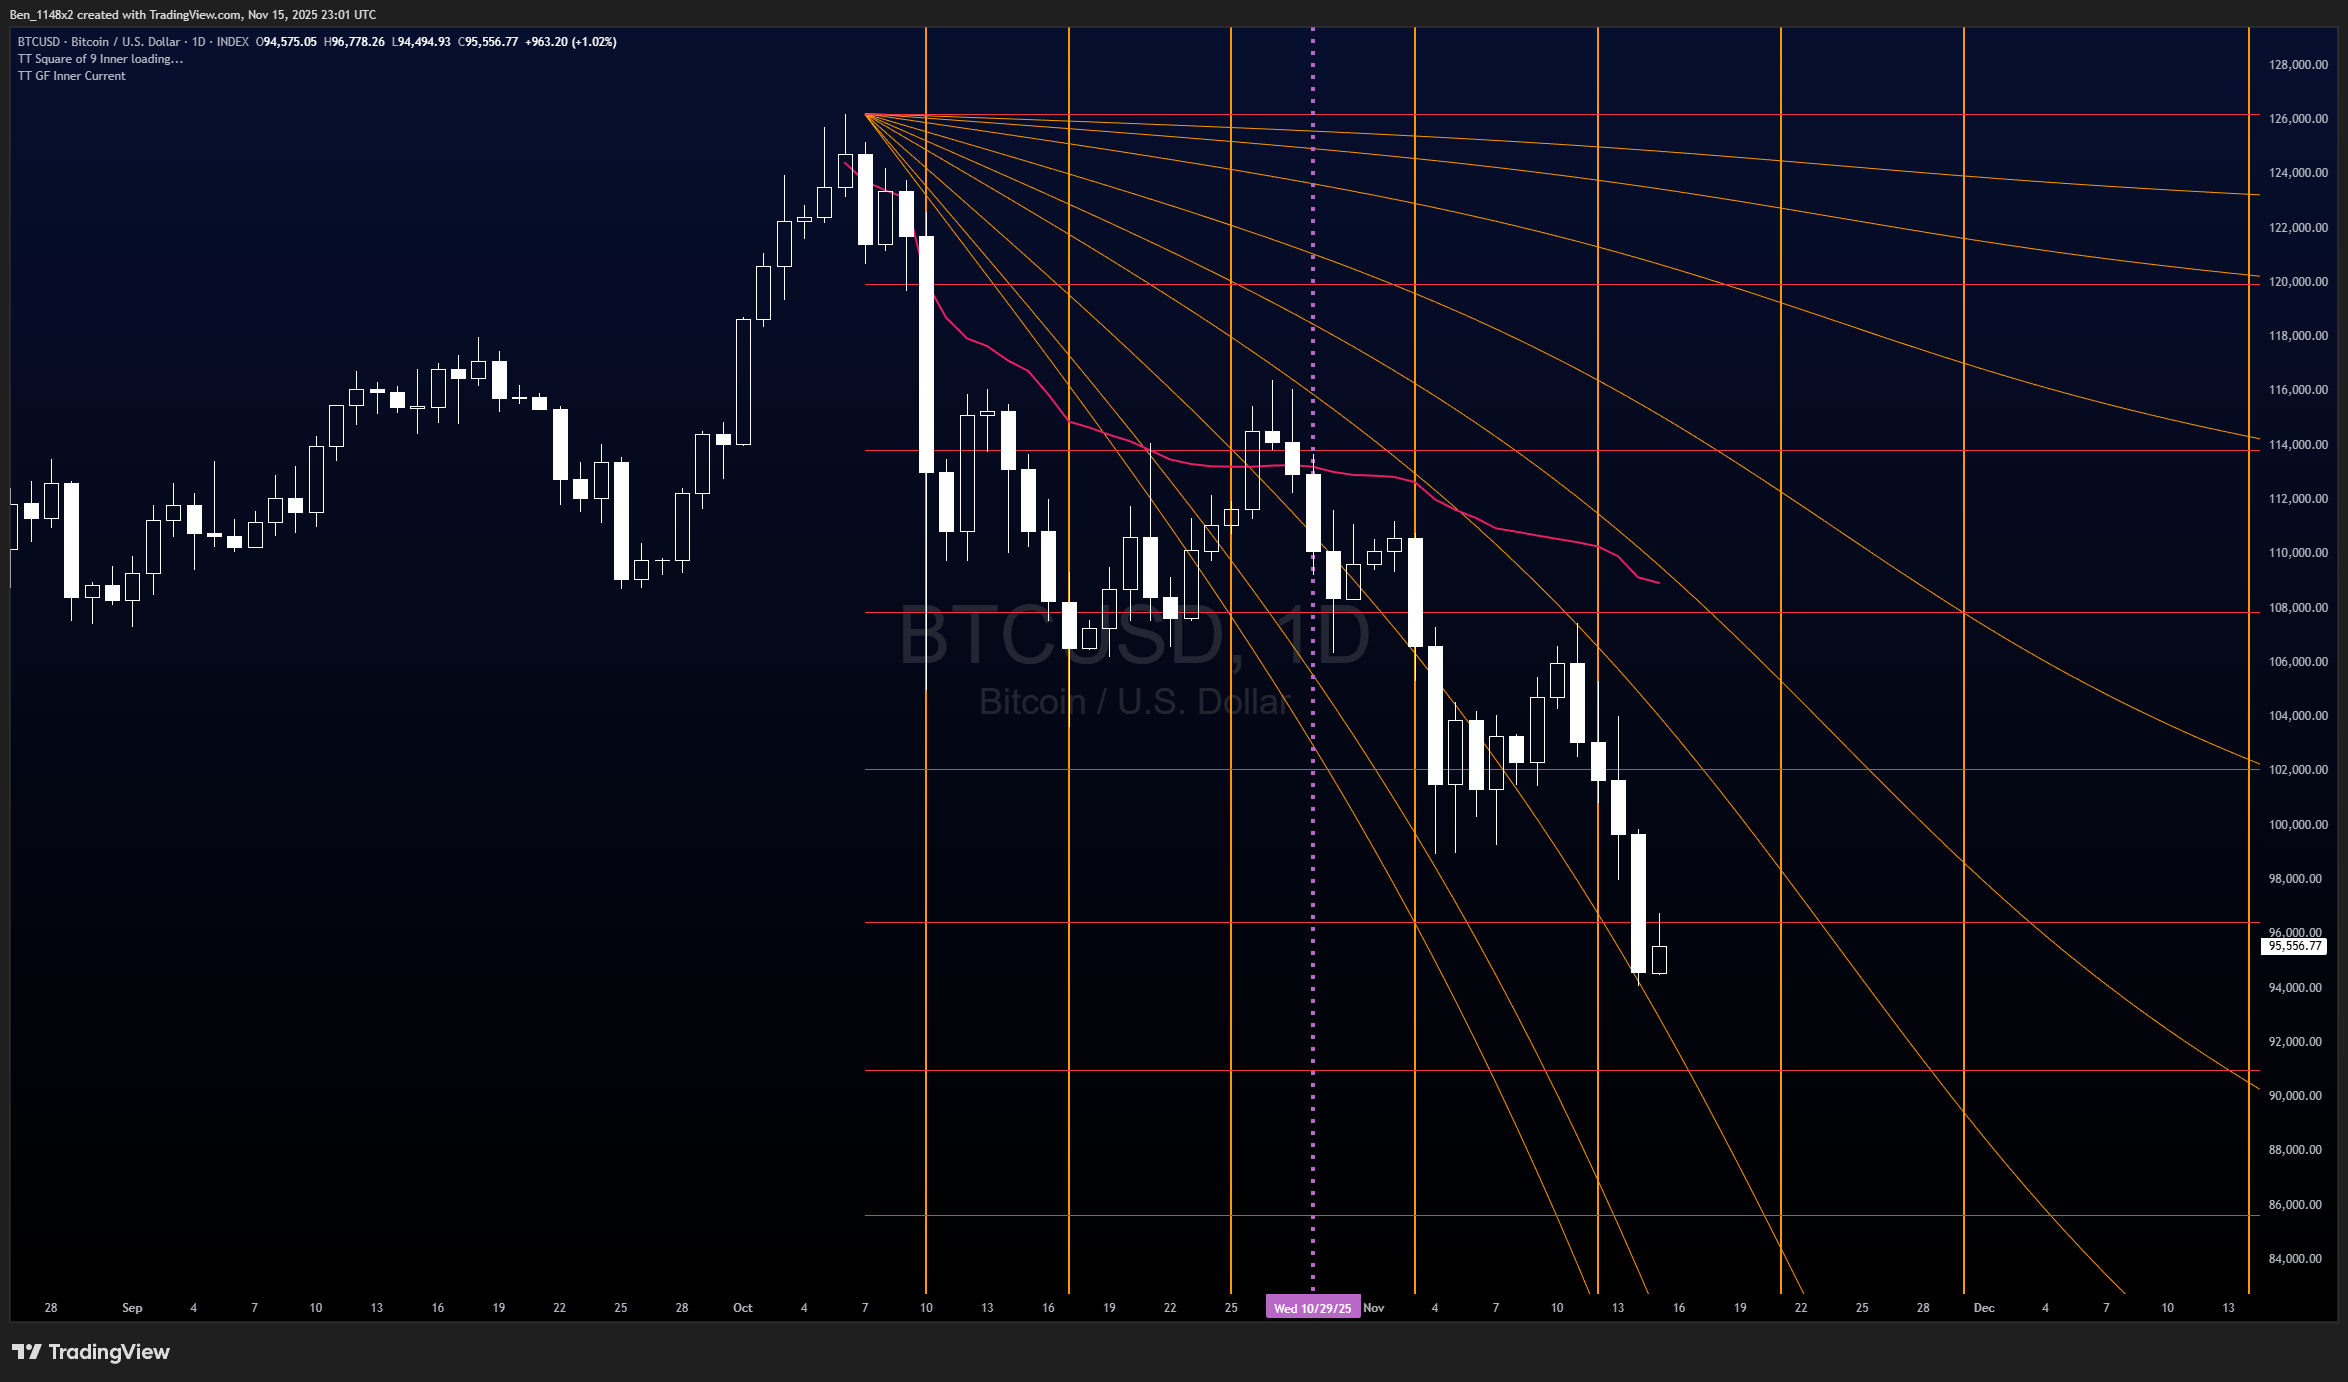
The cycle analyzer anticipates December 3 as a pivot point.
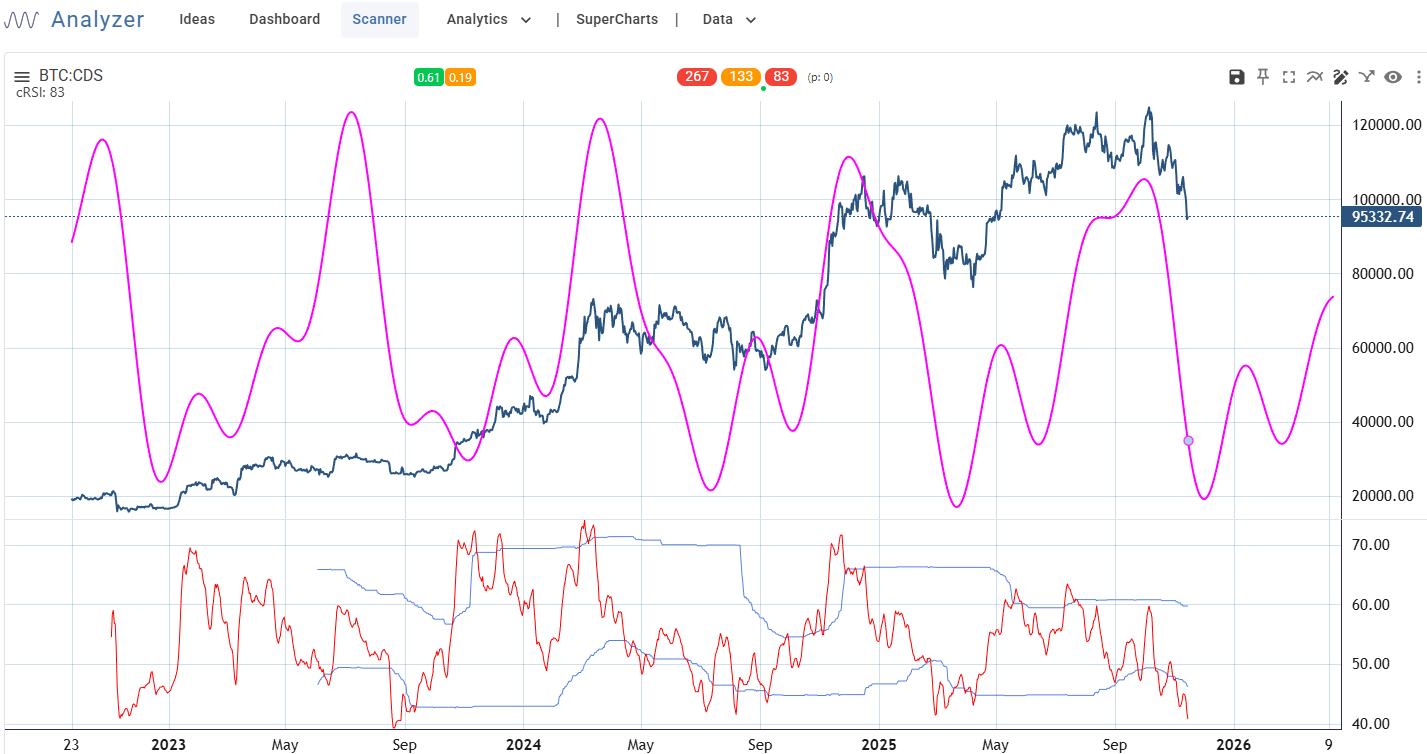
The middle indicator creates an oscillator out of the difference between the 325 day least squares moving average and the 82 day LSMA. The orange line is BTC, the blue is a composite of ETH XRP SOL DOGE LINK and LTC. The black line is a composite of them with BTC. It confirms that we are in a downtrend.
The bottom indicator measures the distance between short and long term Donchain channels. It tells us that we are closer to lower channel limits that are falling.
Individual Charts
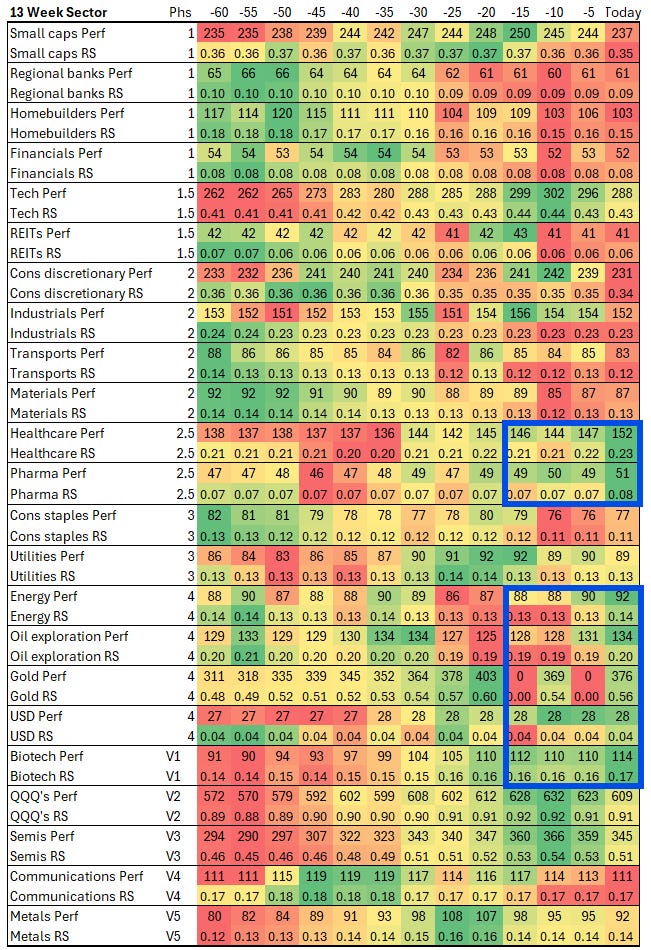
So, what is working right now? IBB biotech and XME metals have the strongest ongoing combinations of relative strength to the S&P and overall performance. XLV healthcare is making a strong push.
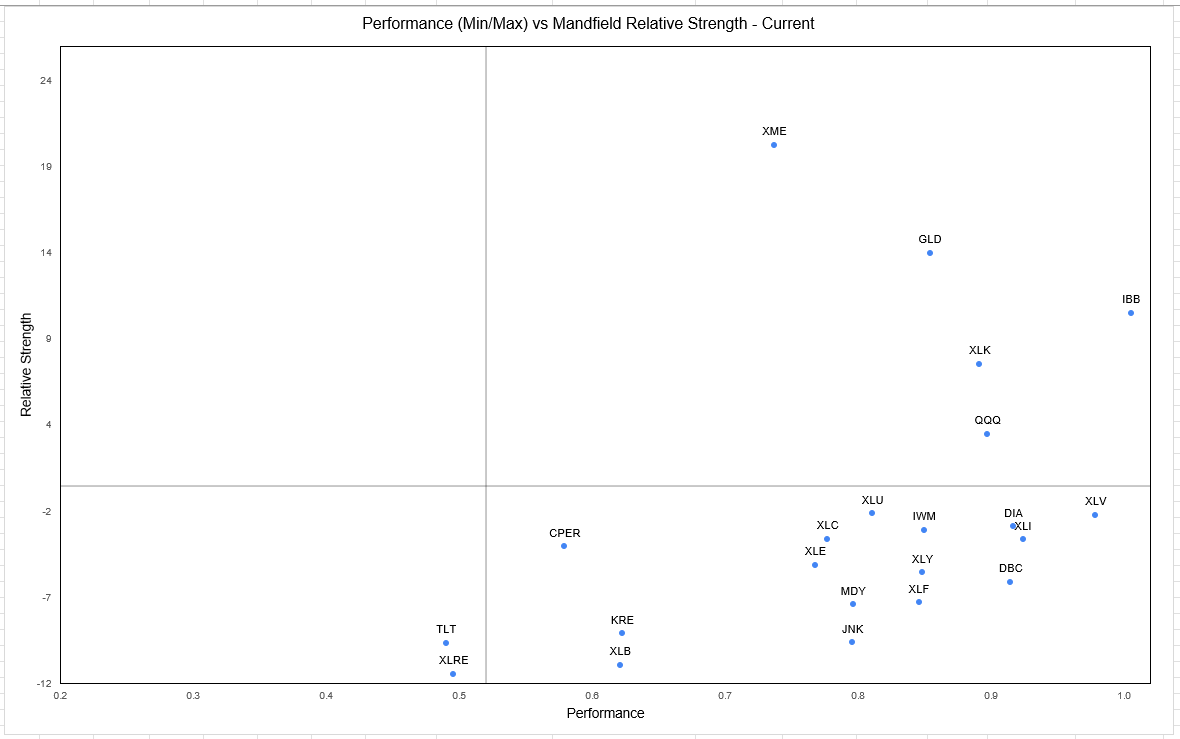
Looking at a 13 week history of performance and strength relative to the S&P, we can see a rotation toward energy, gold, healthcare, pharma, and biotechs. We tend to see this during later stages of the cycle.
AKAM
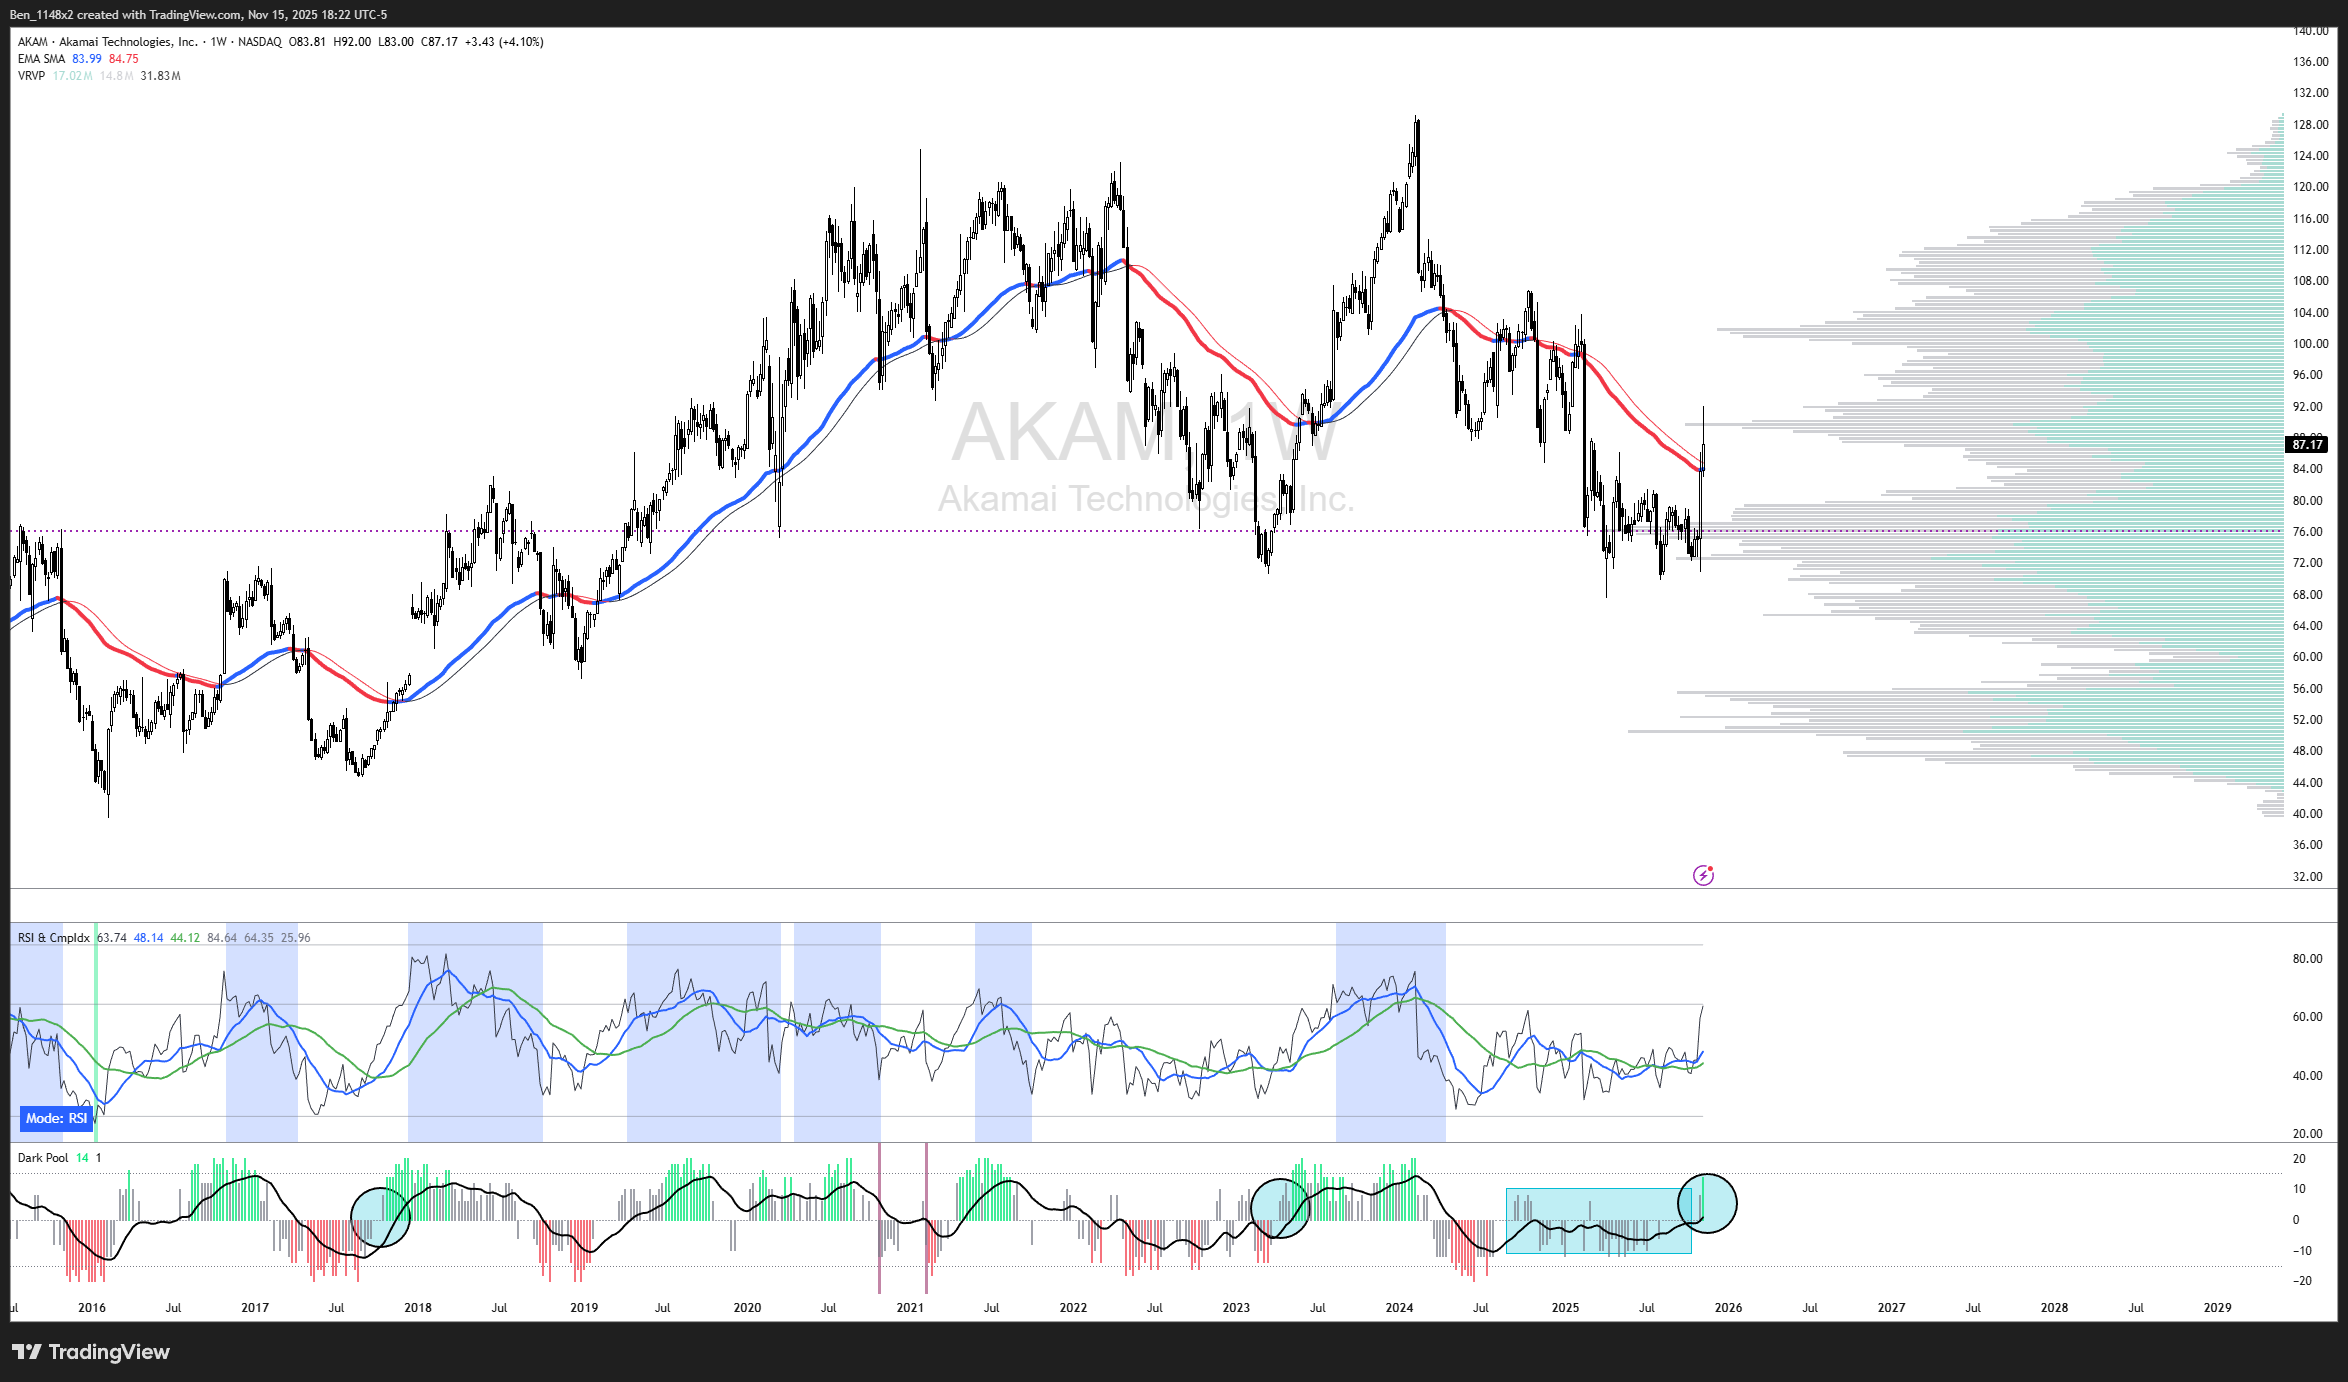
This is the only tech that I am considering in the short term. We have bullish momentum signals on the weekly chart, with the 65 week EMA turning bullish. If I pursue this I will look to take profit near 100, and set my stop near 77.
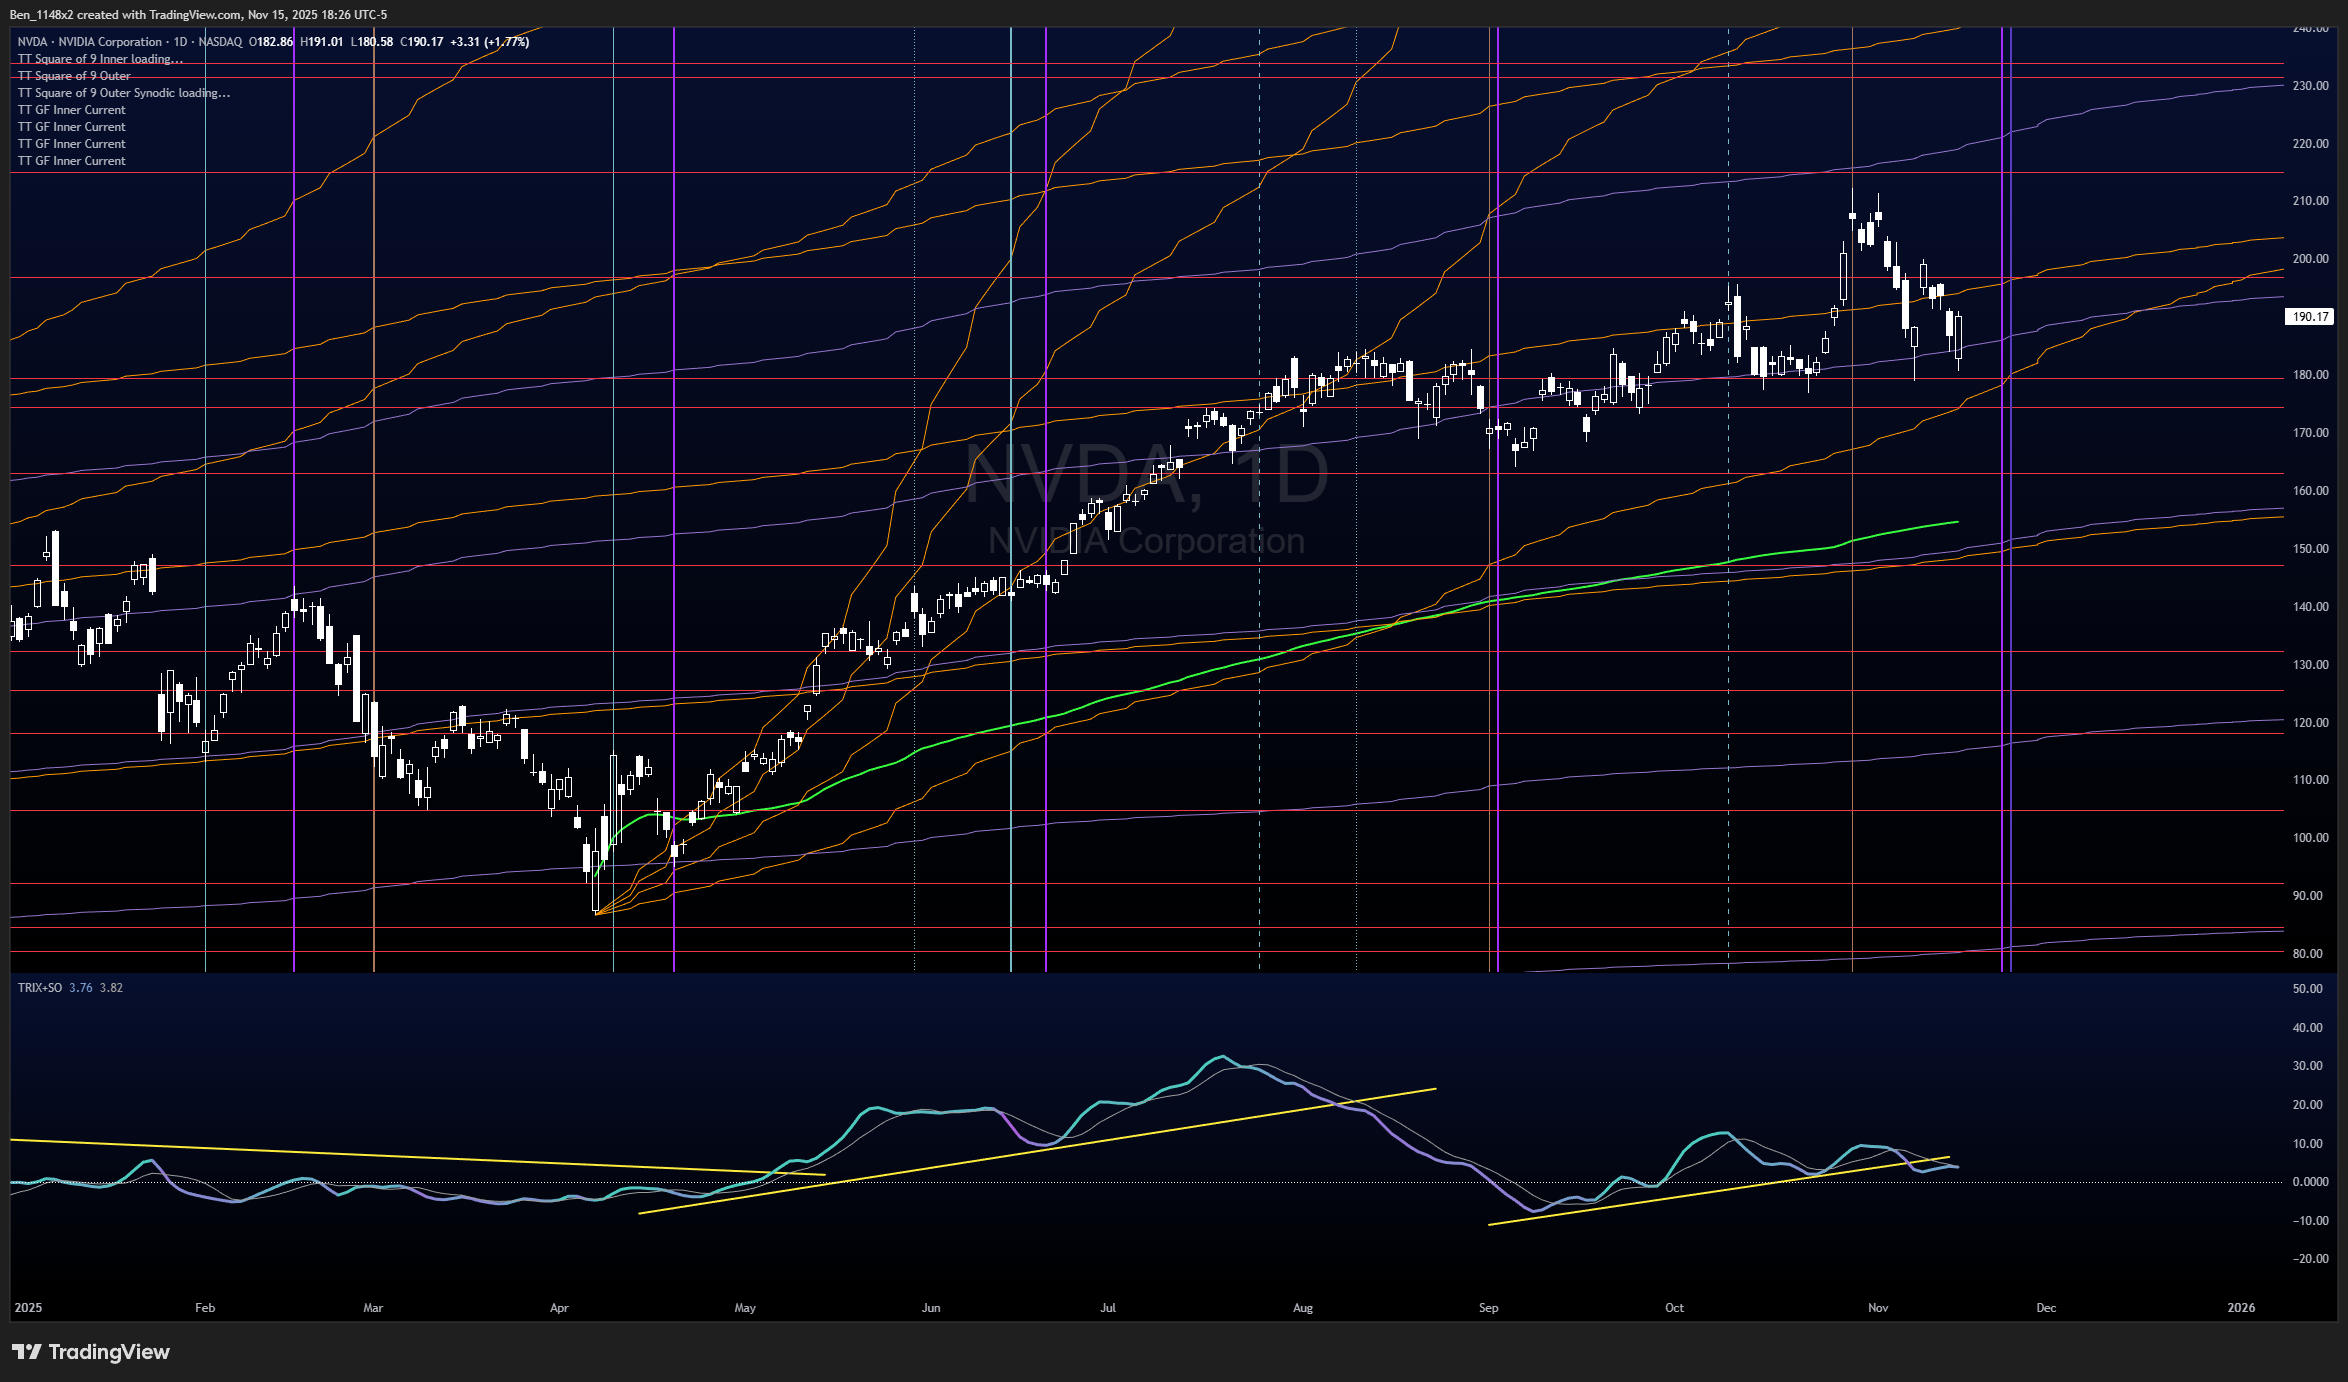
NVDA
The next date of interest on this chart is 11/21.
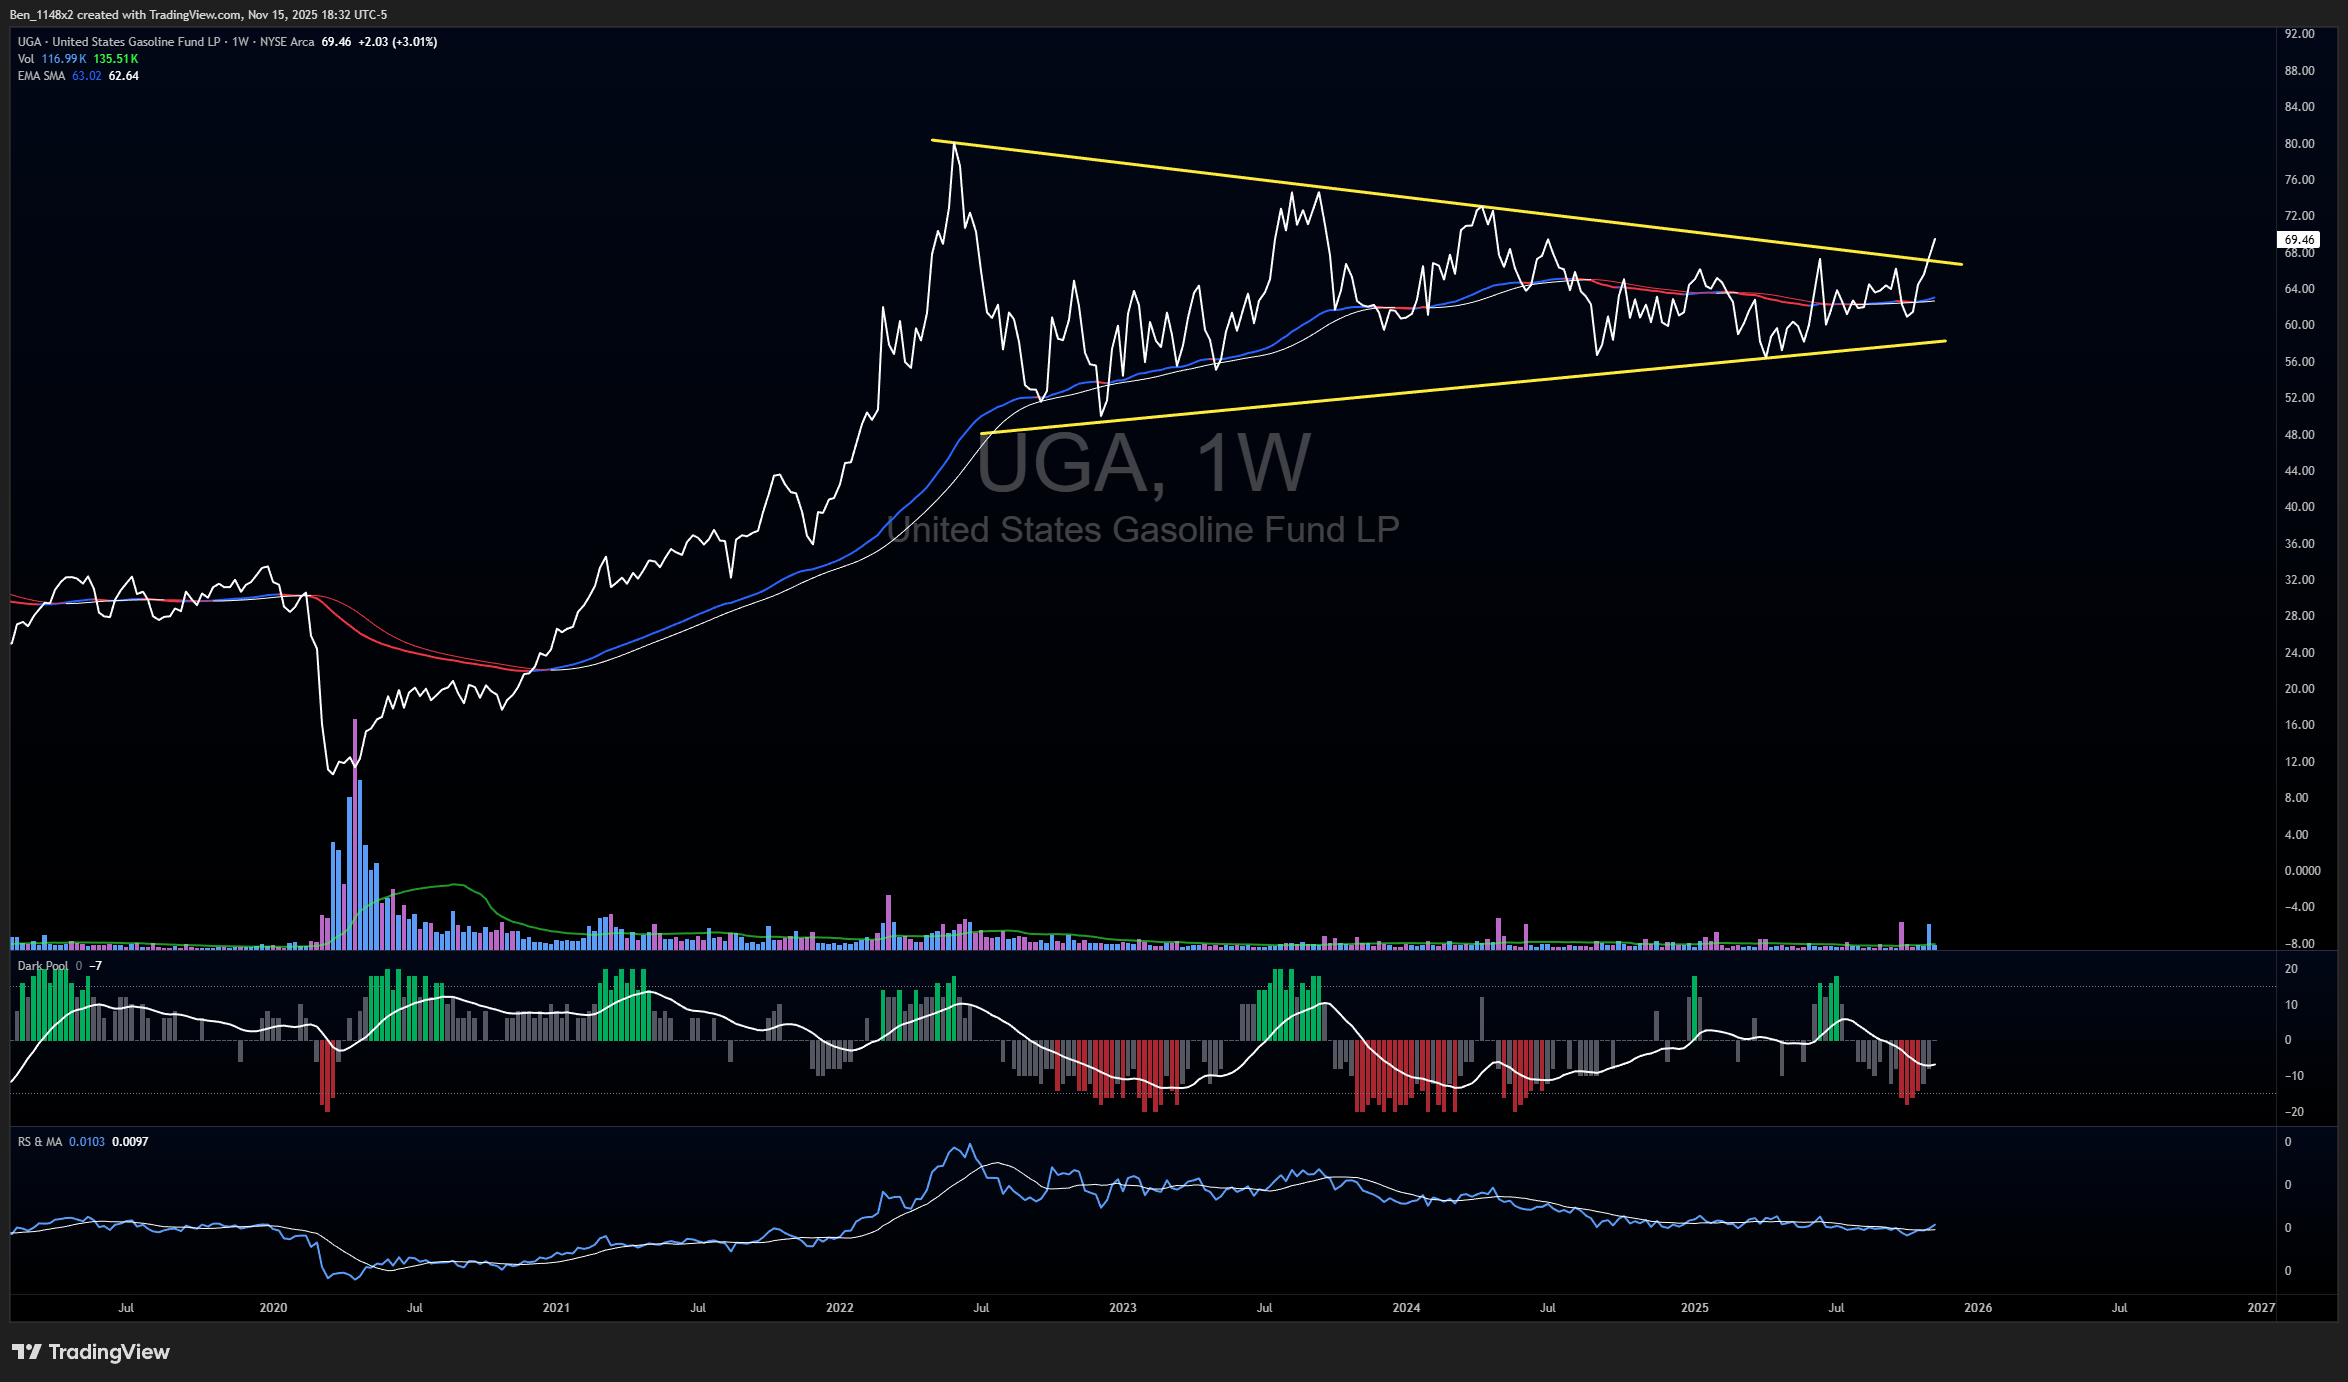
Energy
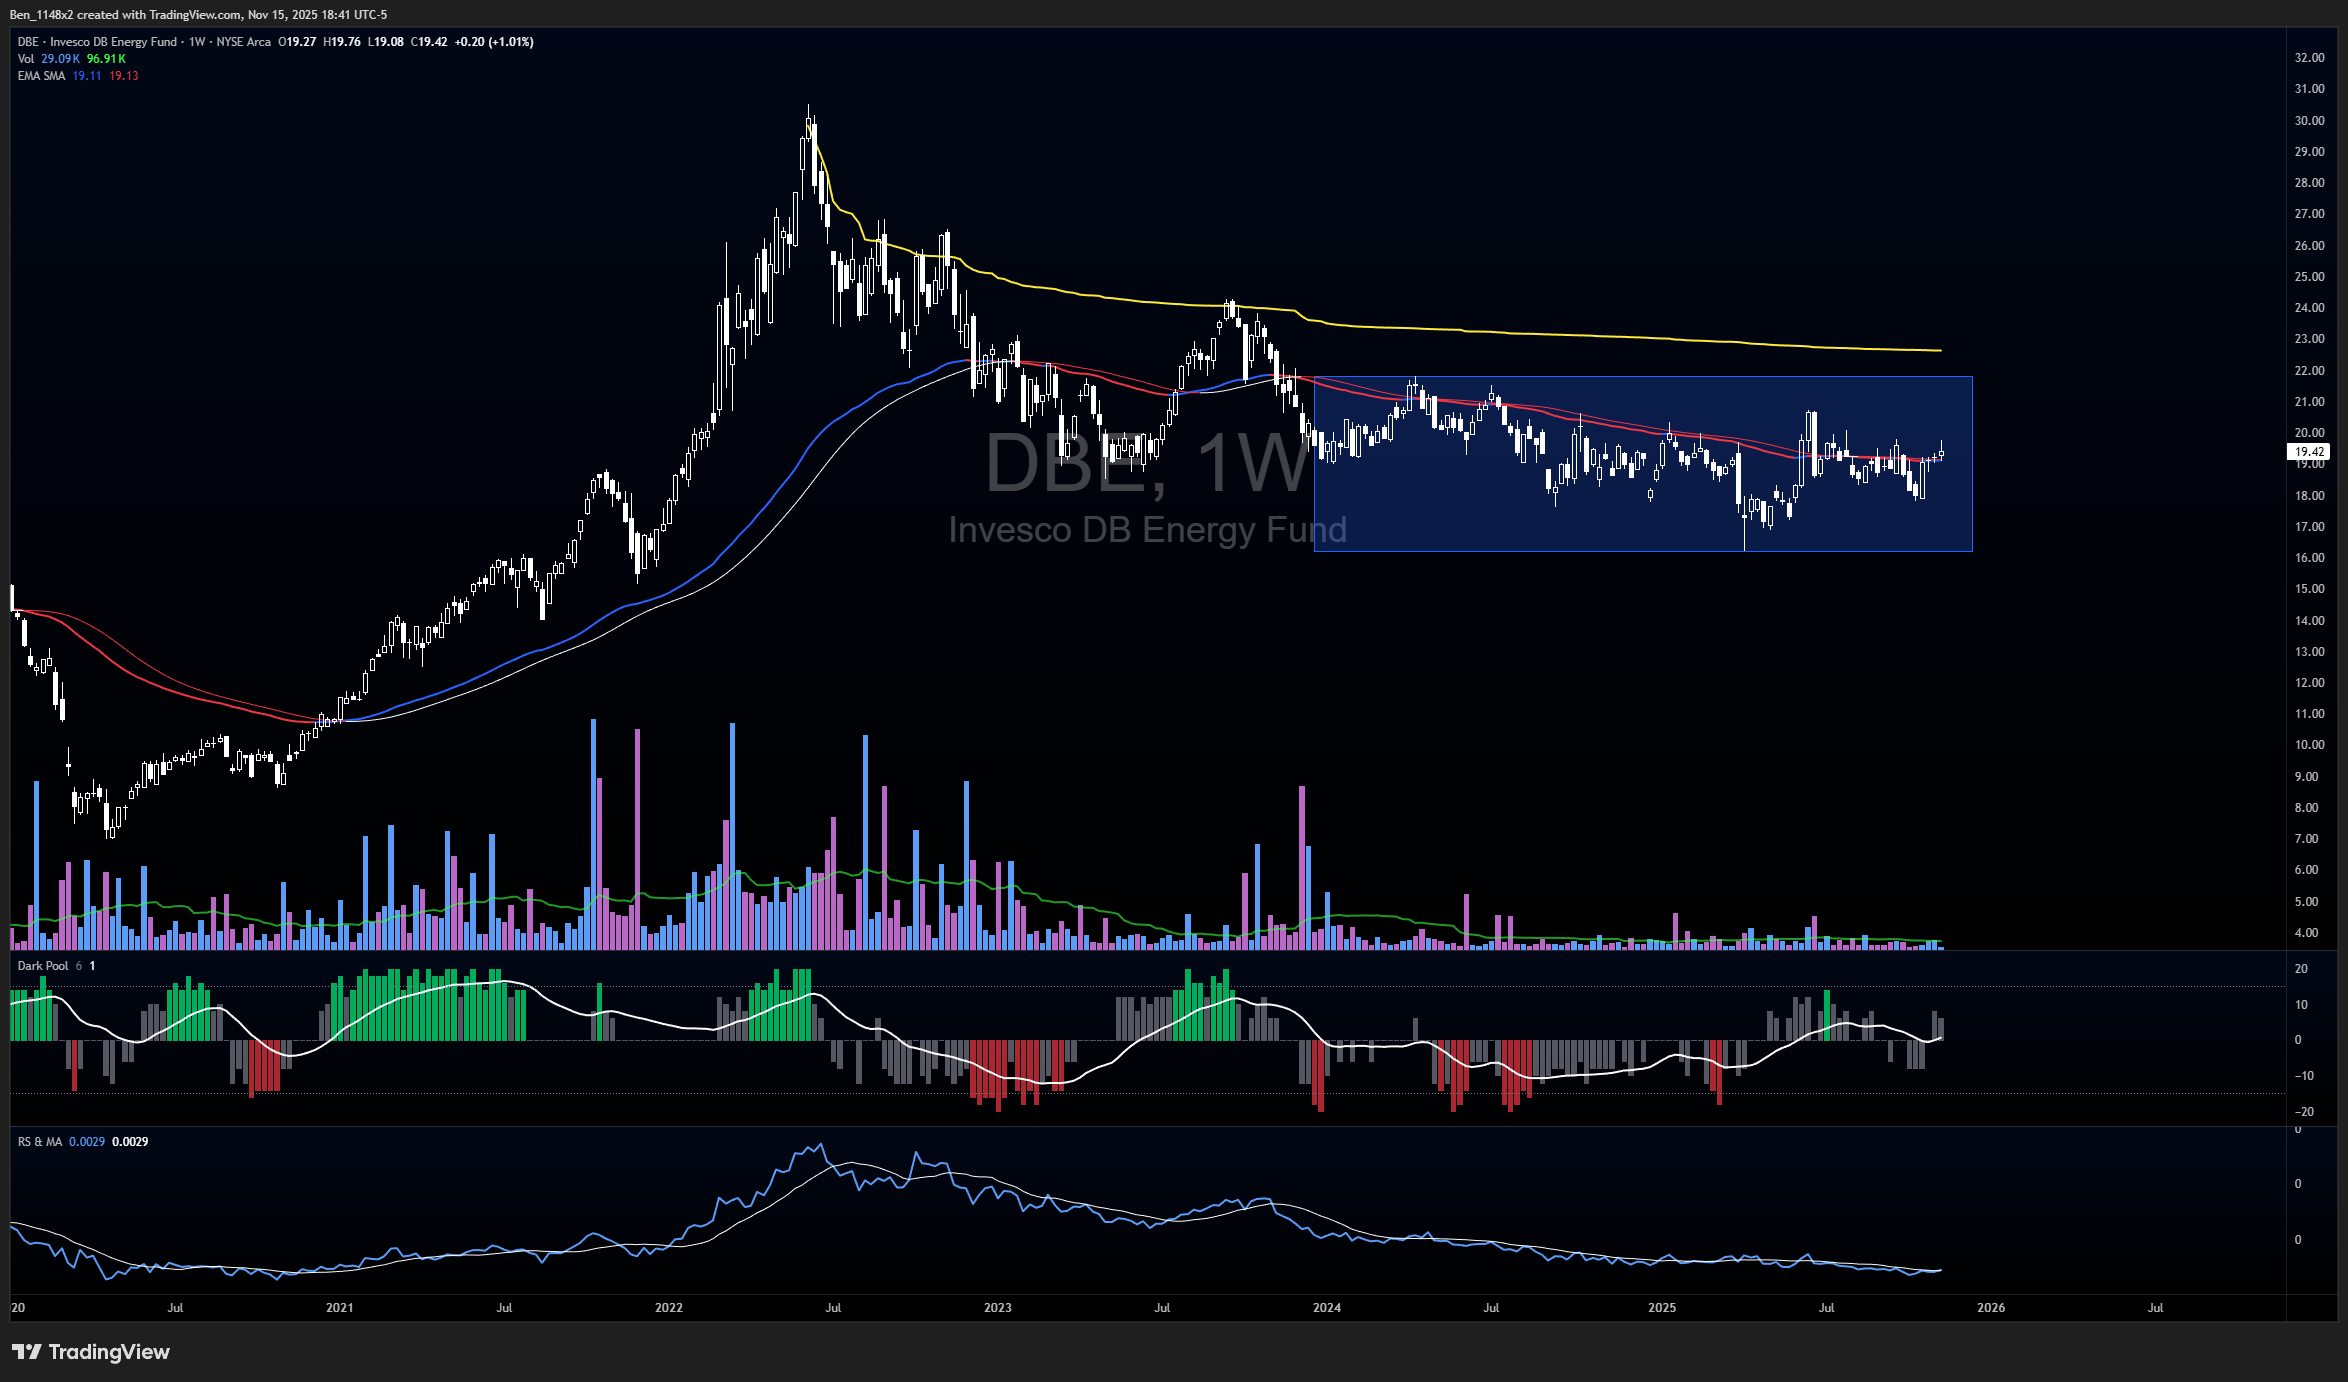
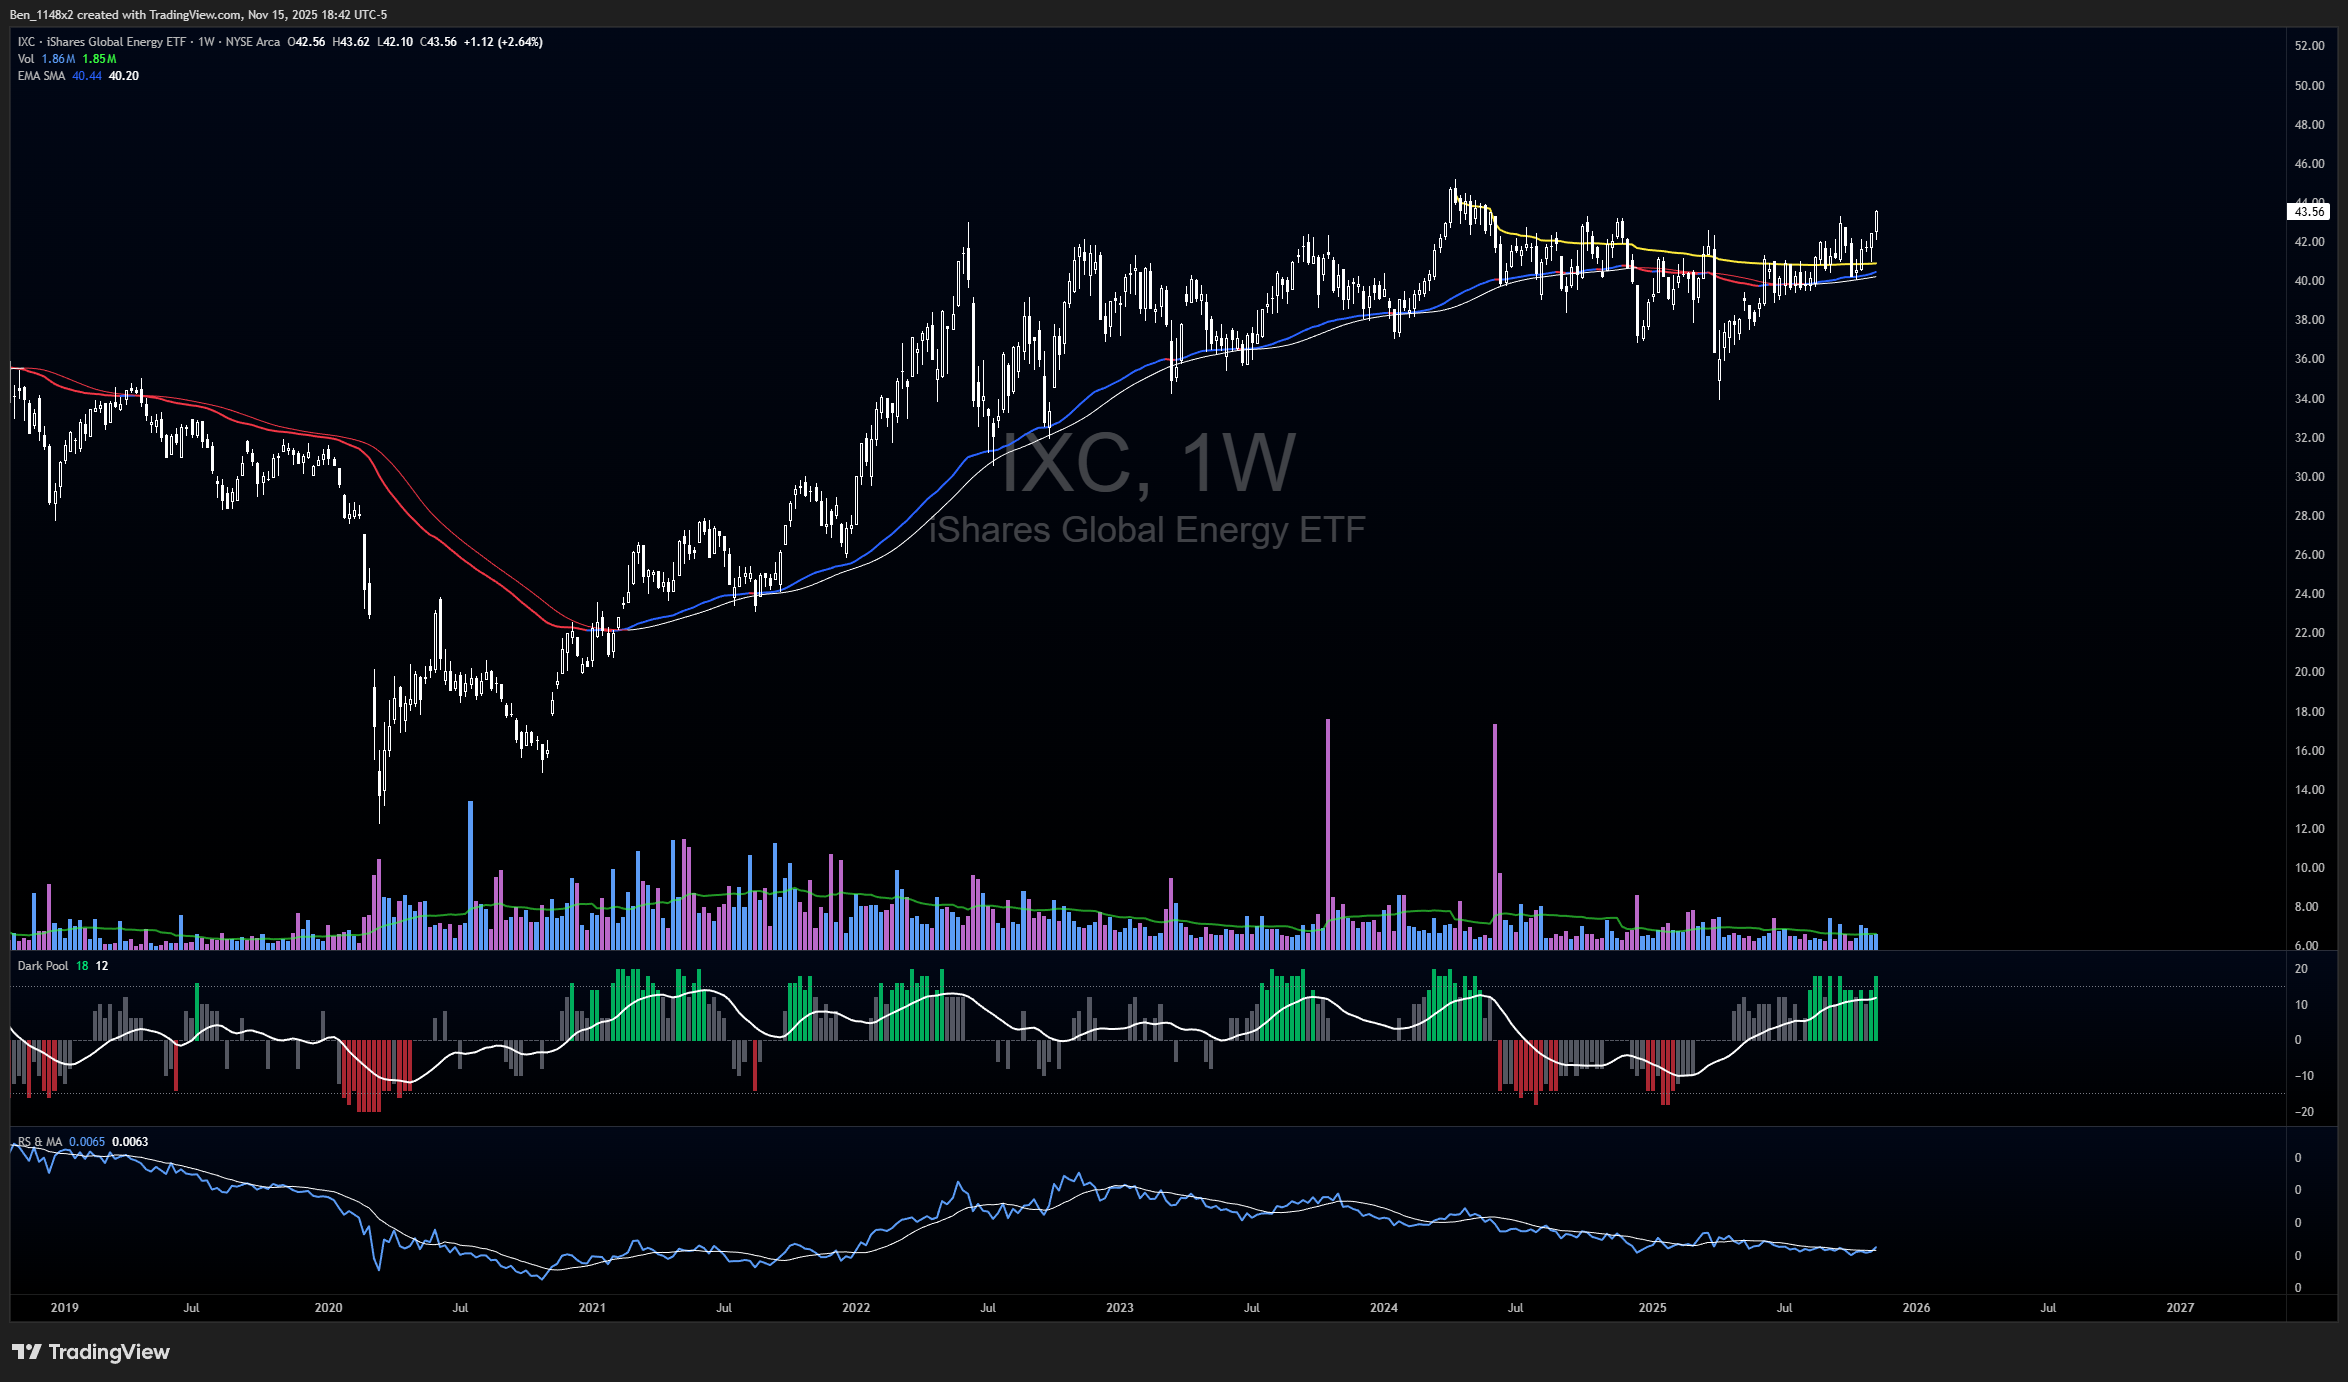
These charts use the 65 week EMA, the pseudo dark pool accumulation indicator, and a relative strength comparison to the S&P.
UGA gasoline ETF. Accumulation is favorable and we have an early relative strength crossover.
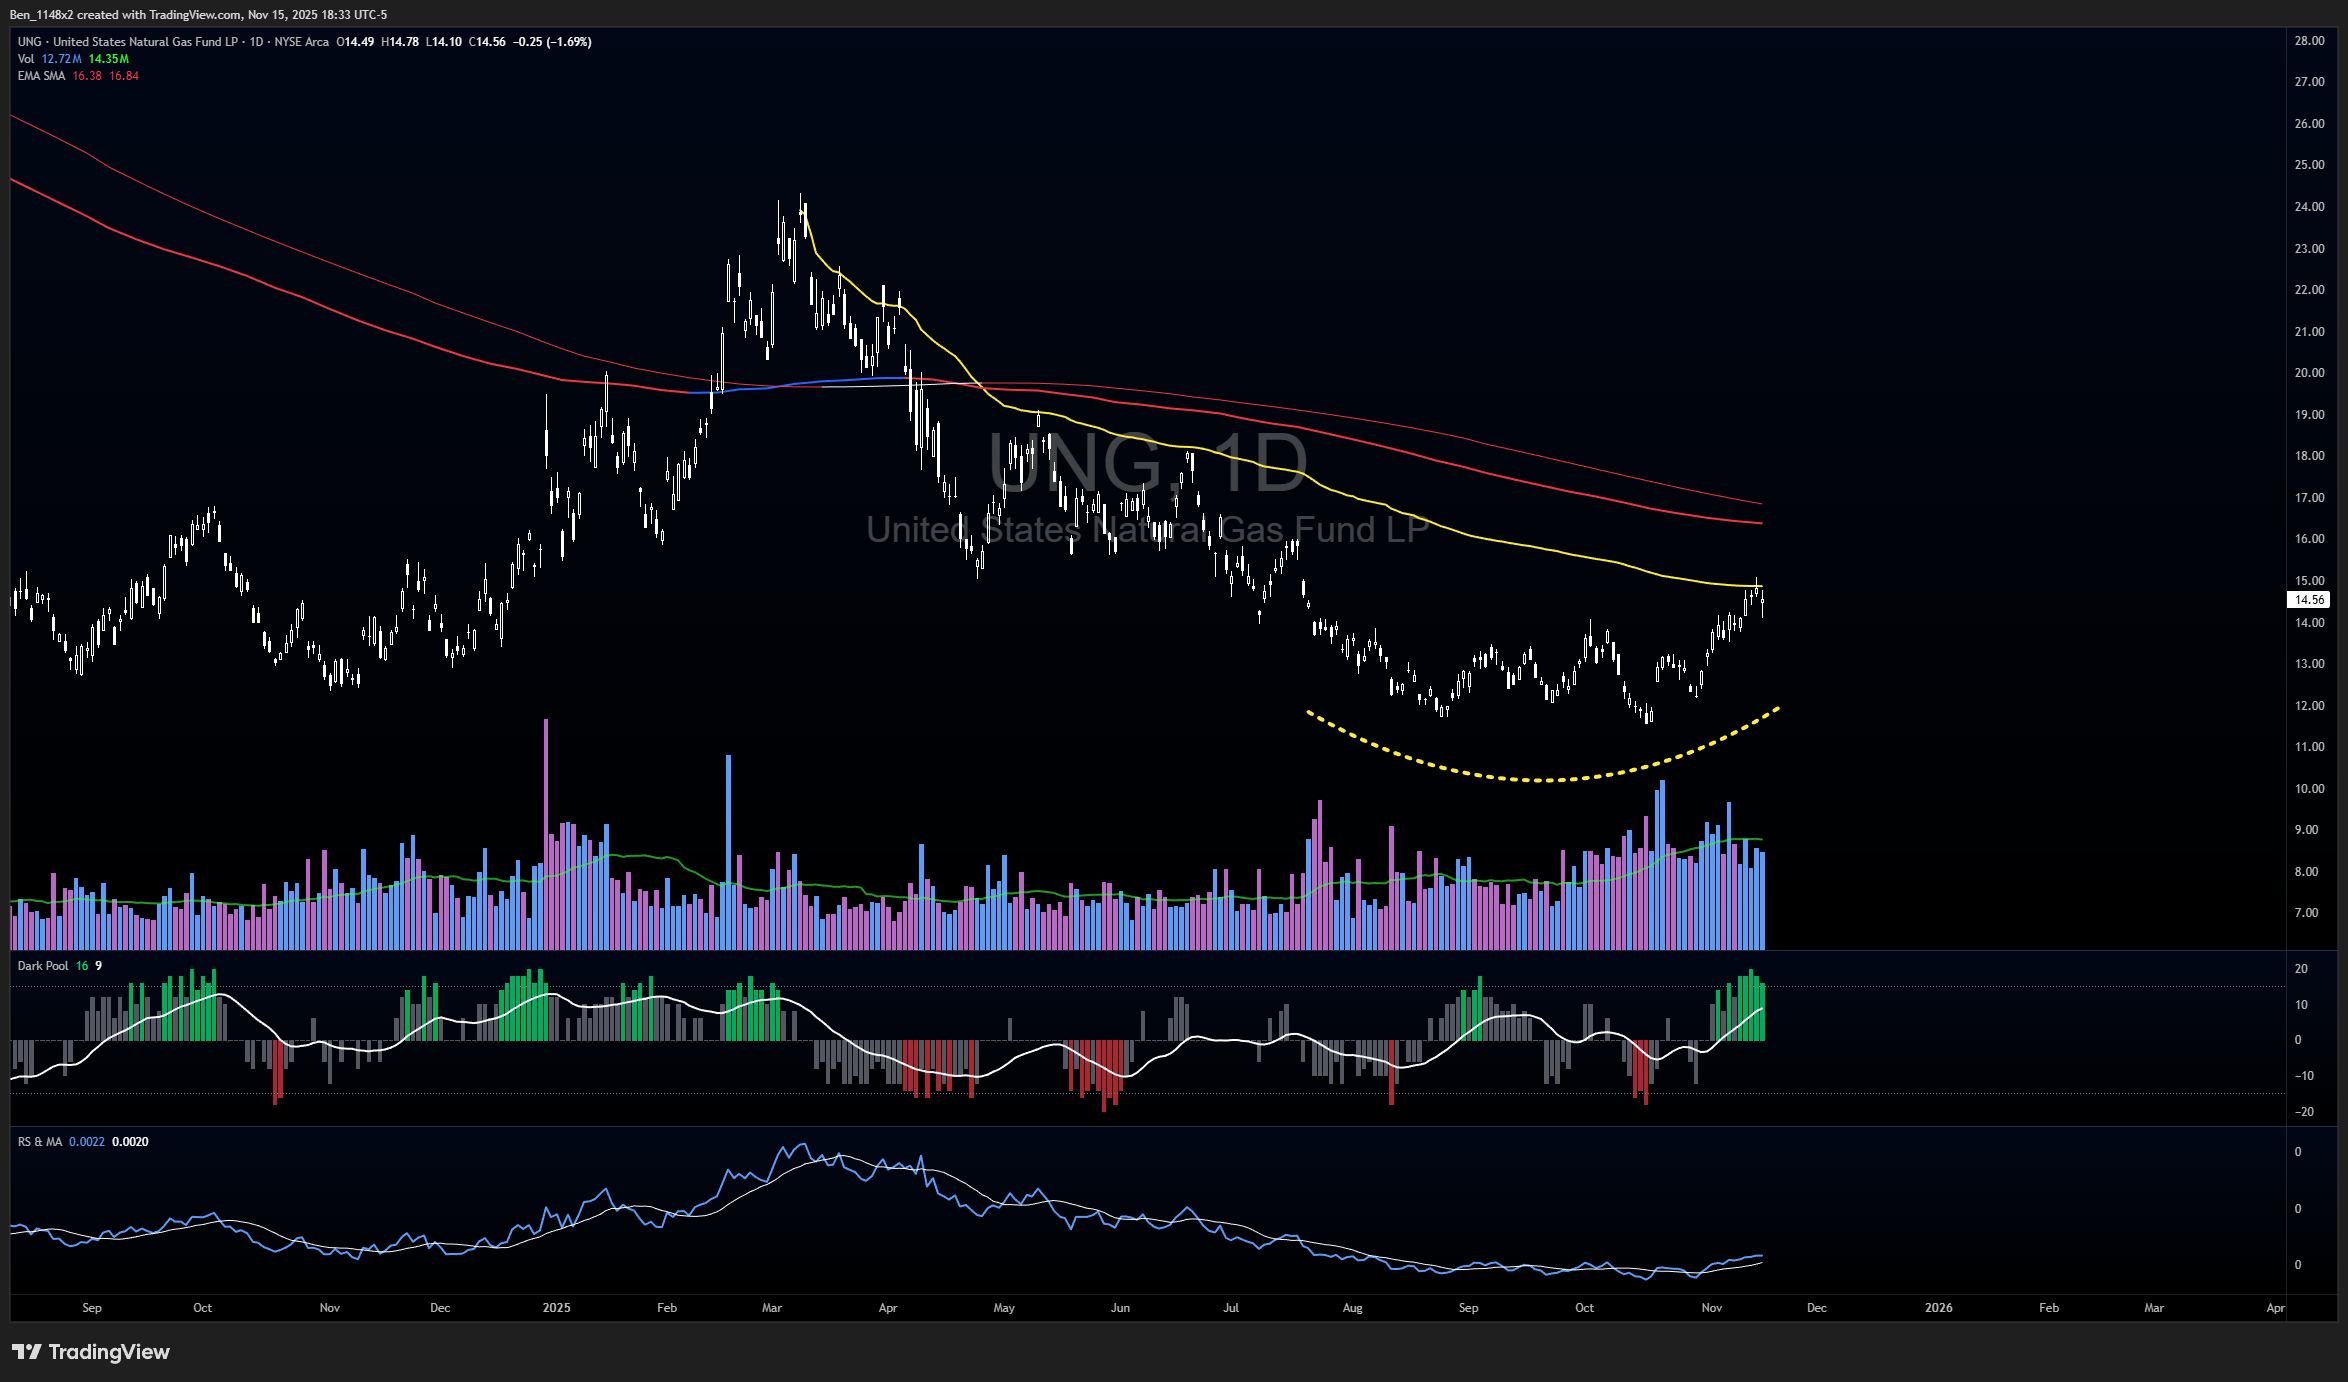
UNG natural gas likely gets some resistance at this level. A break above and retest would be very constructive.
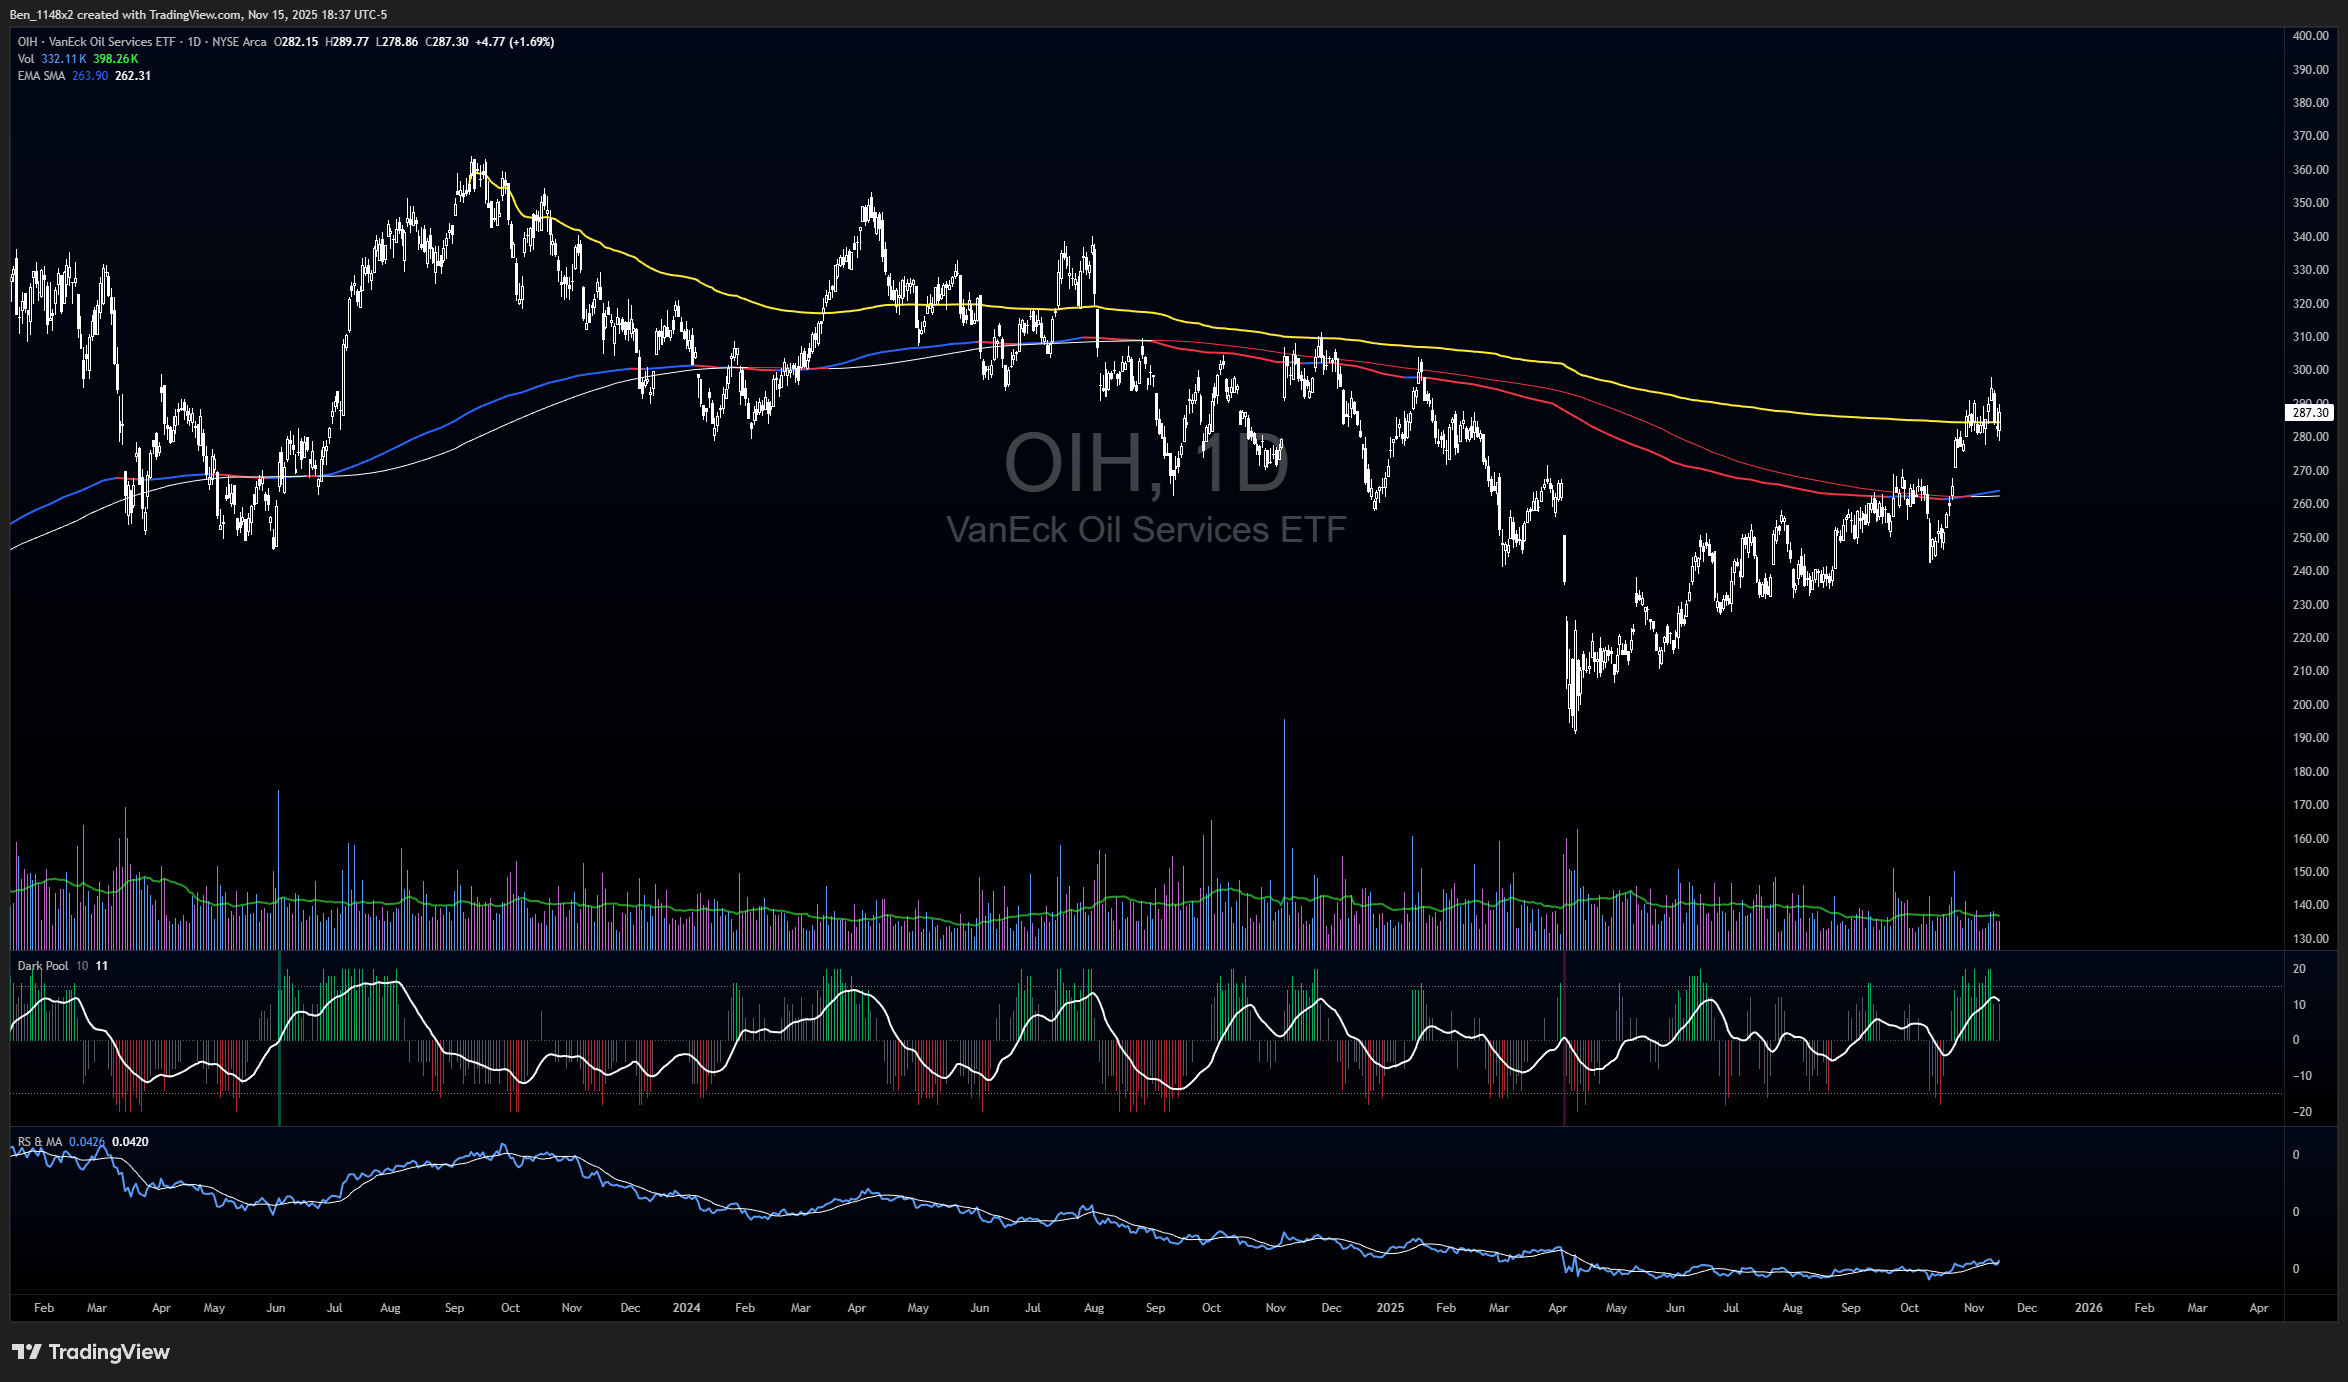
OIH oil service ETF.
DBE energy ETF is in an area of accumulation.
IXC global energy ETF looks much more constructive.
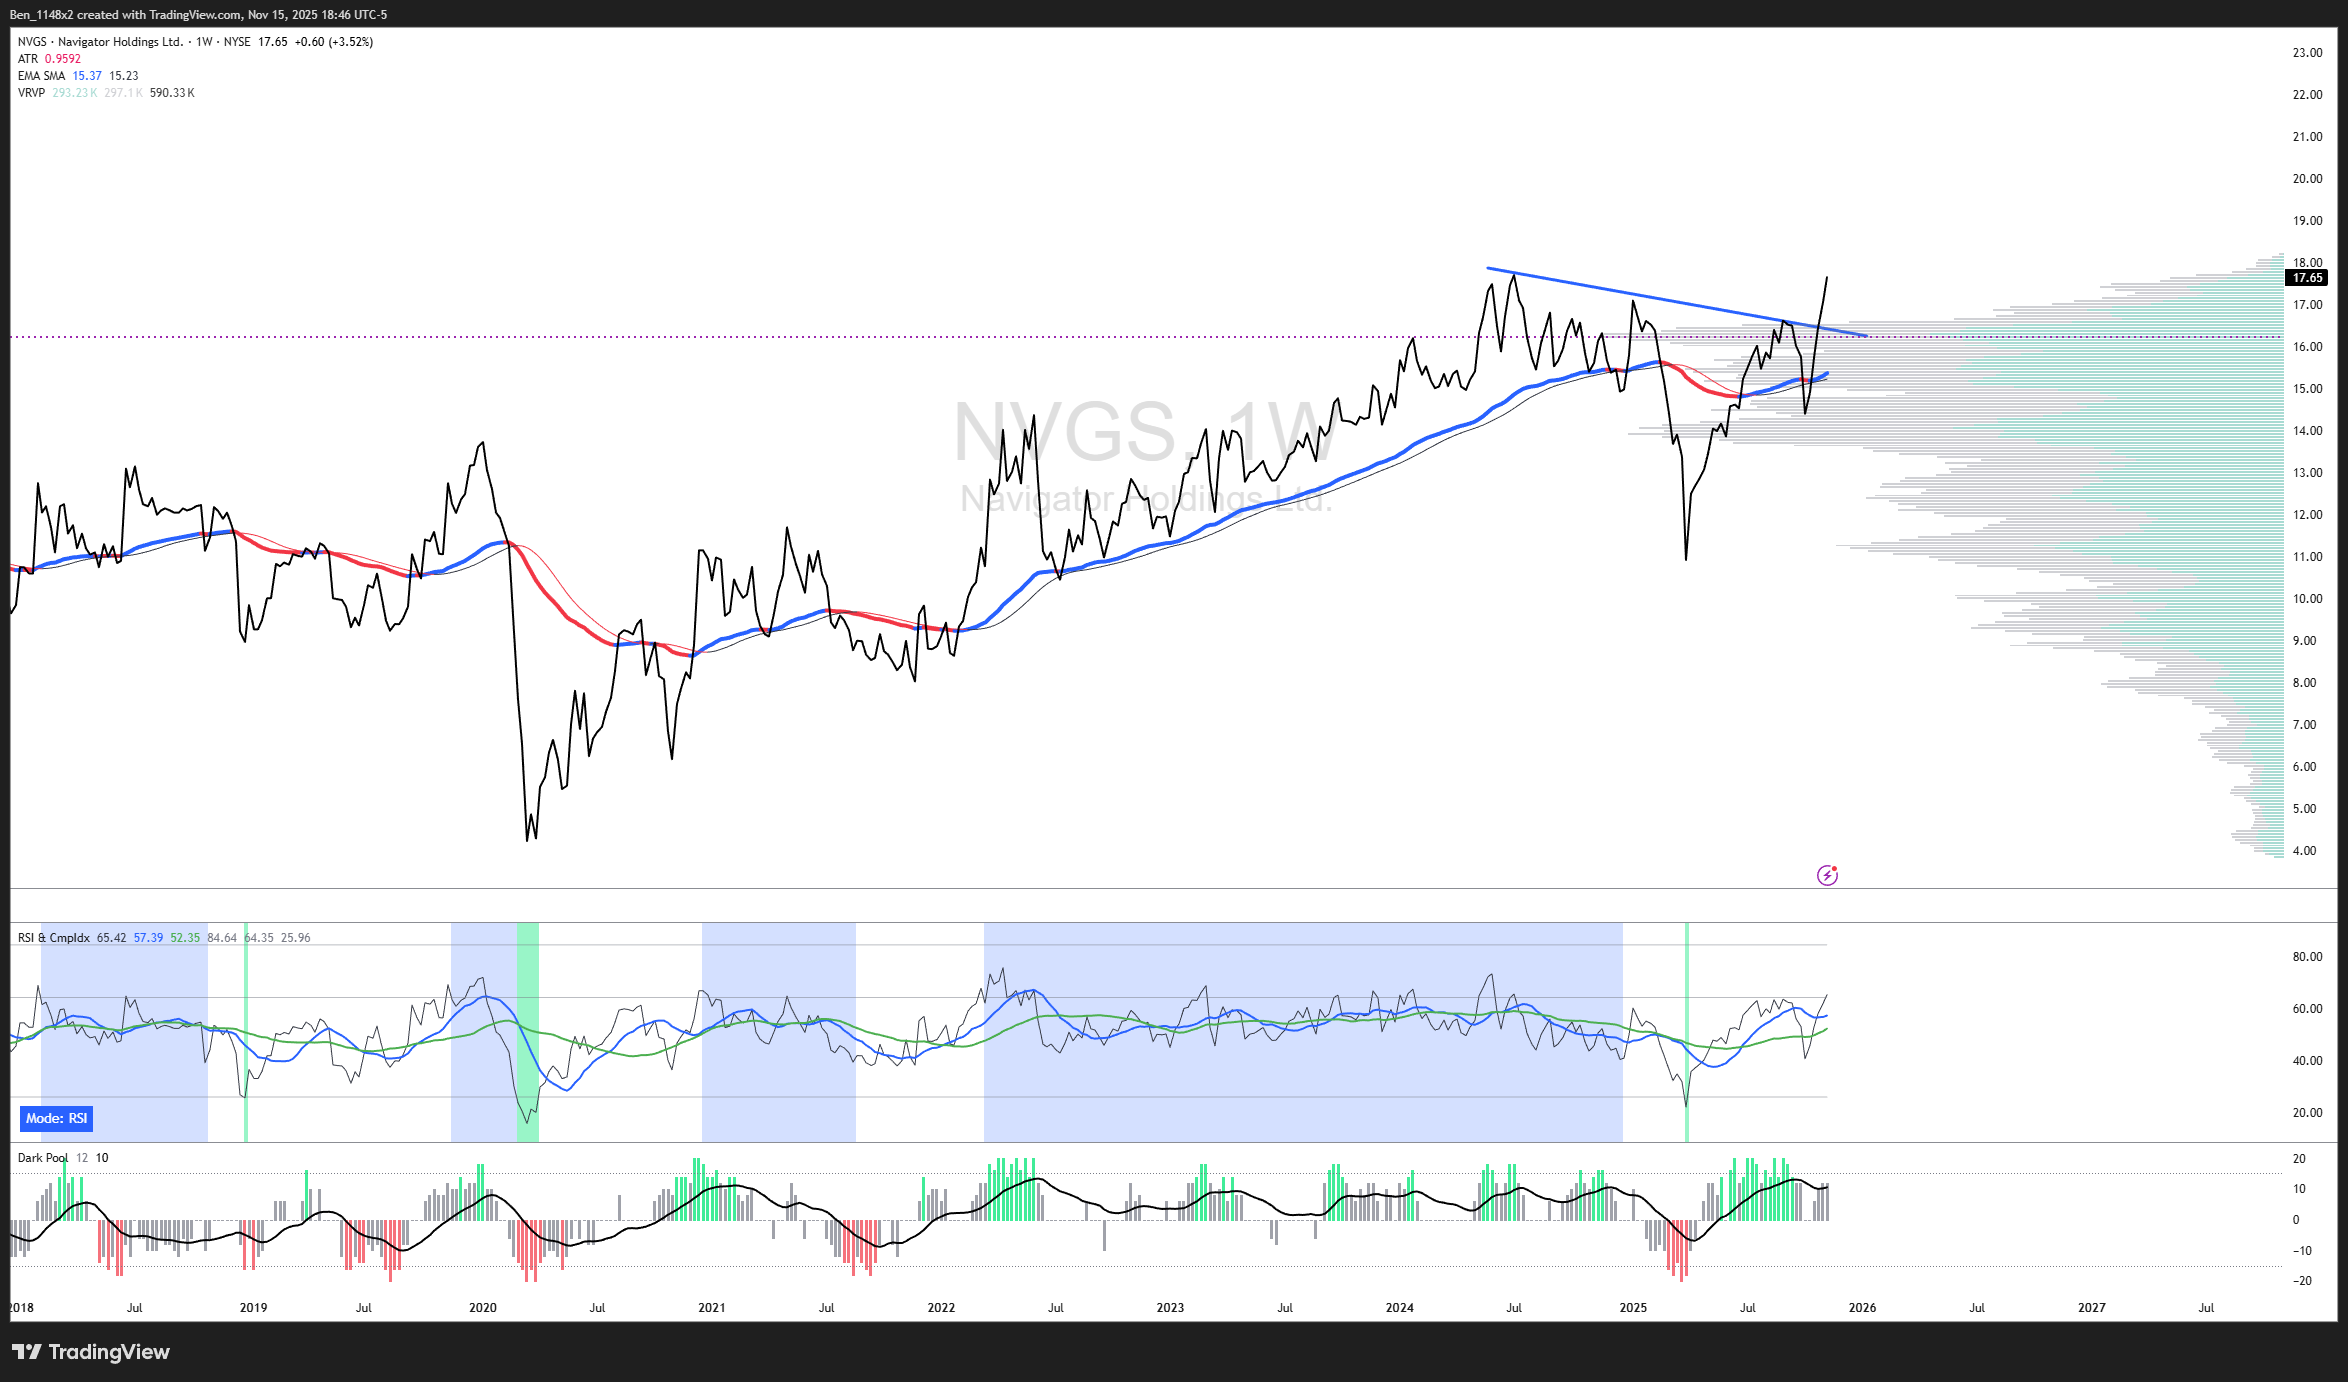
NVGS is a small cap natural gas play. We can make a case for a bullish inverted head and shoulders.
EXE is an energy exploration firm that looks to have given us the fake out, shake out, breakout.
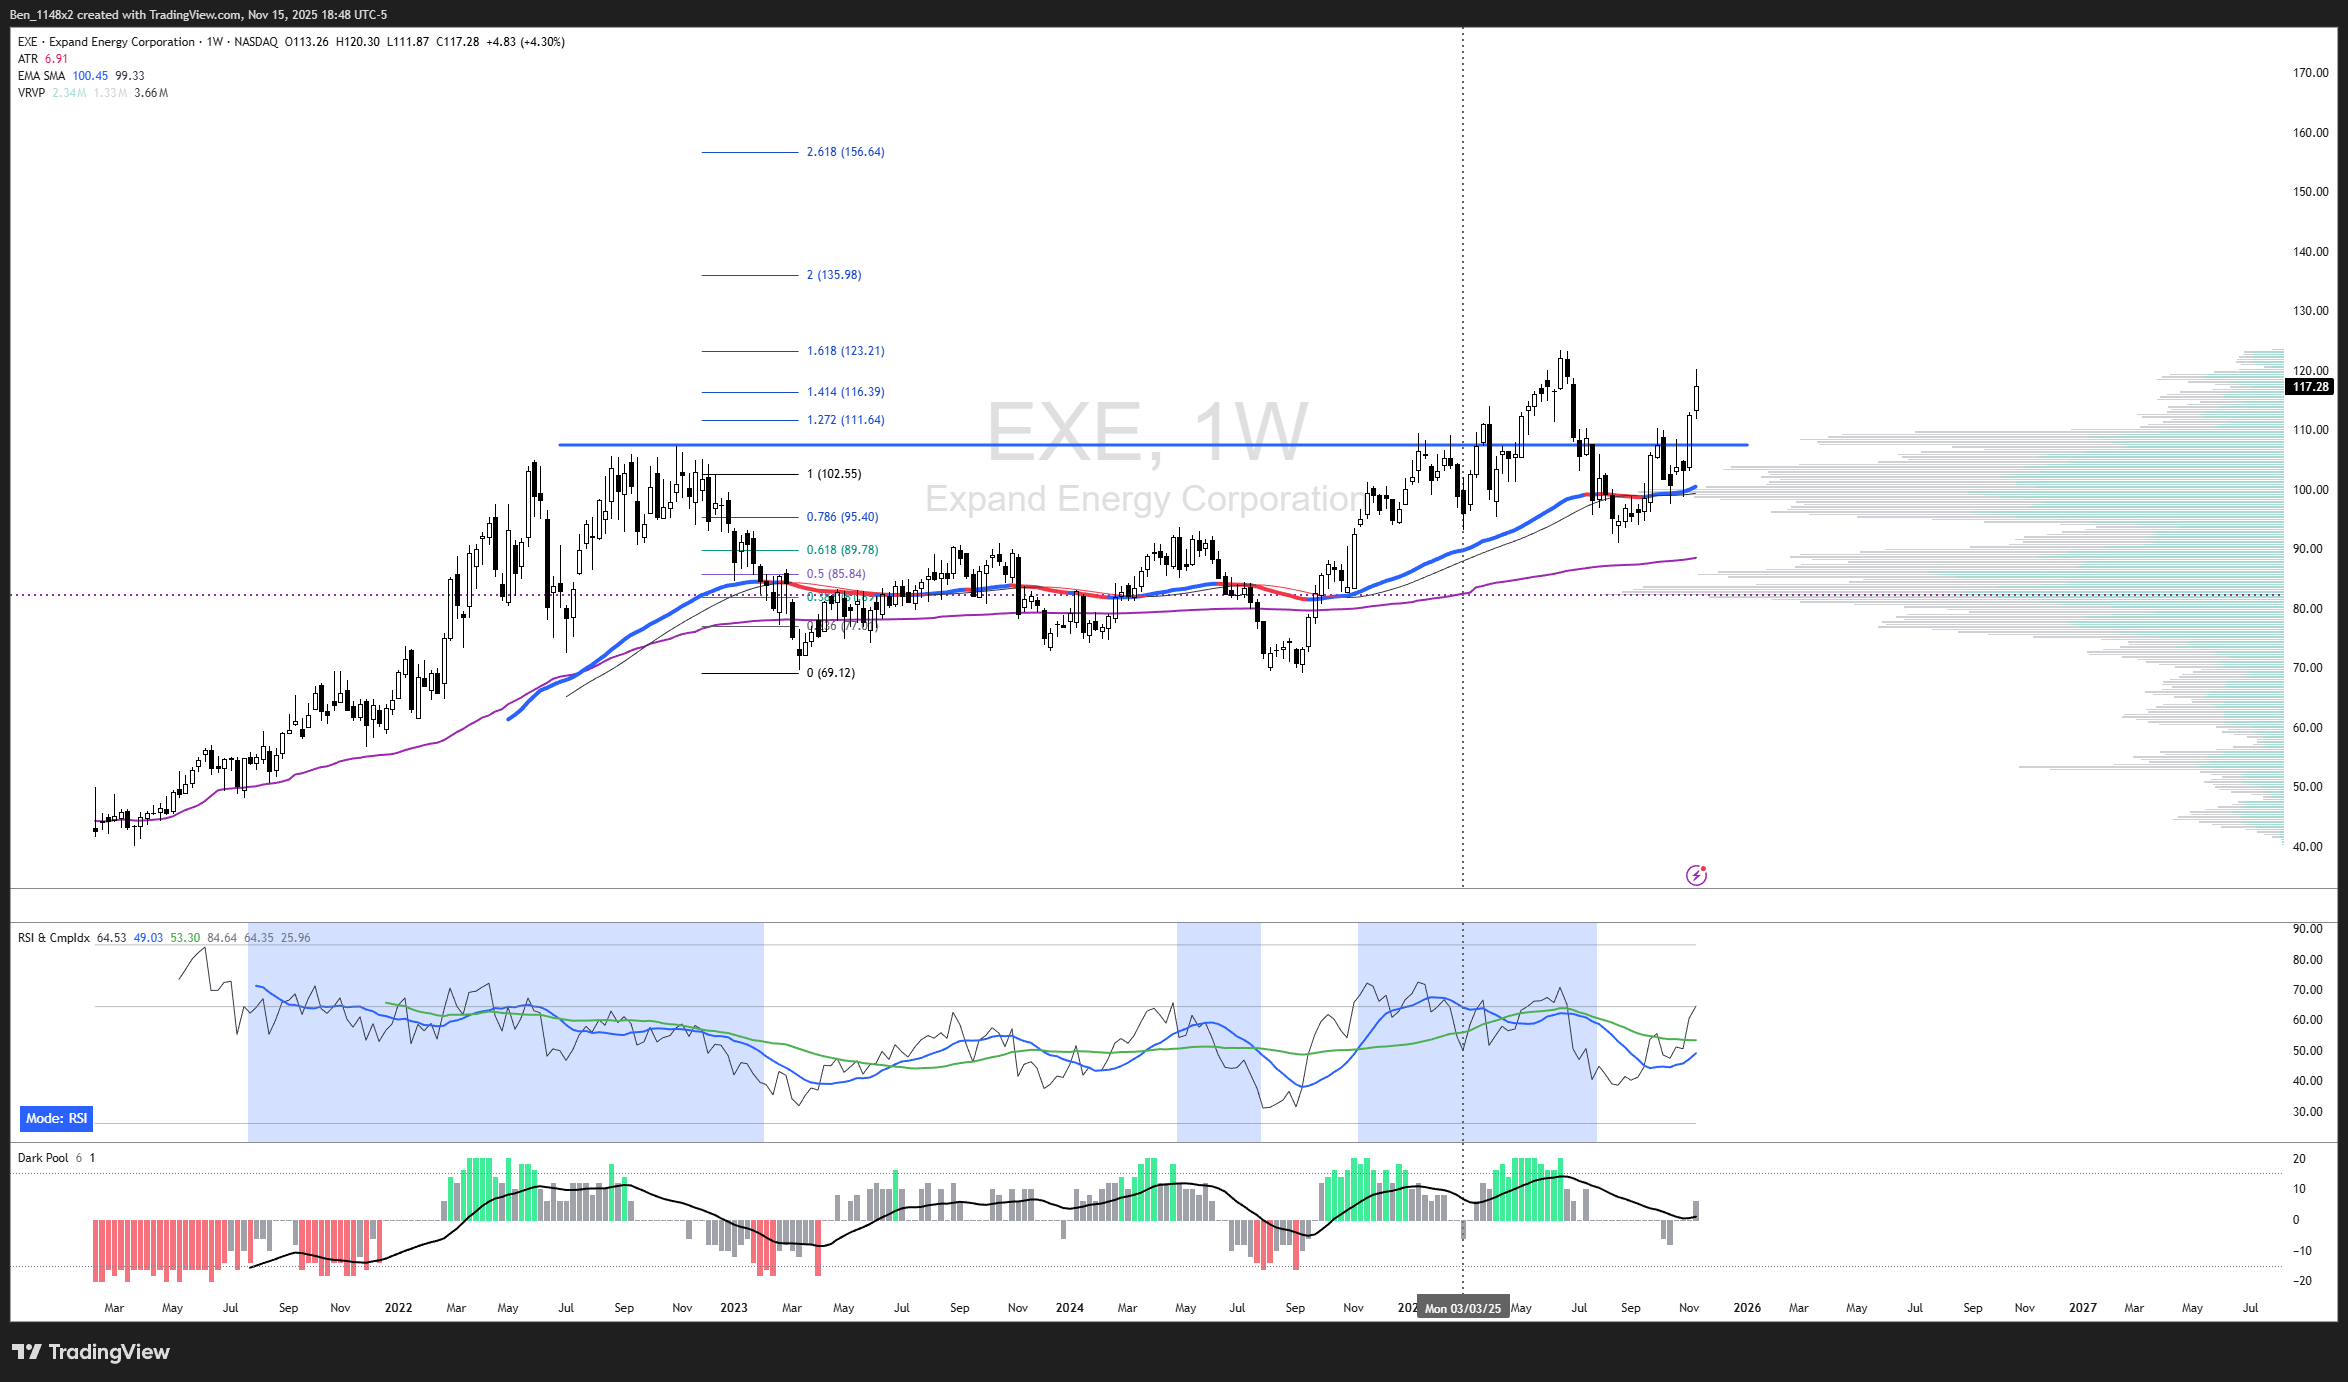
That’s enough of energy for now.
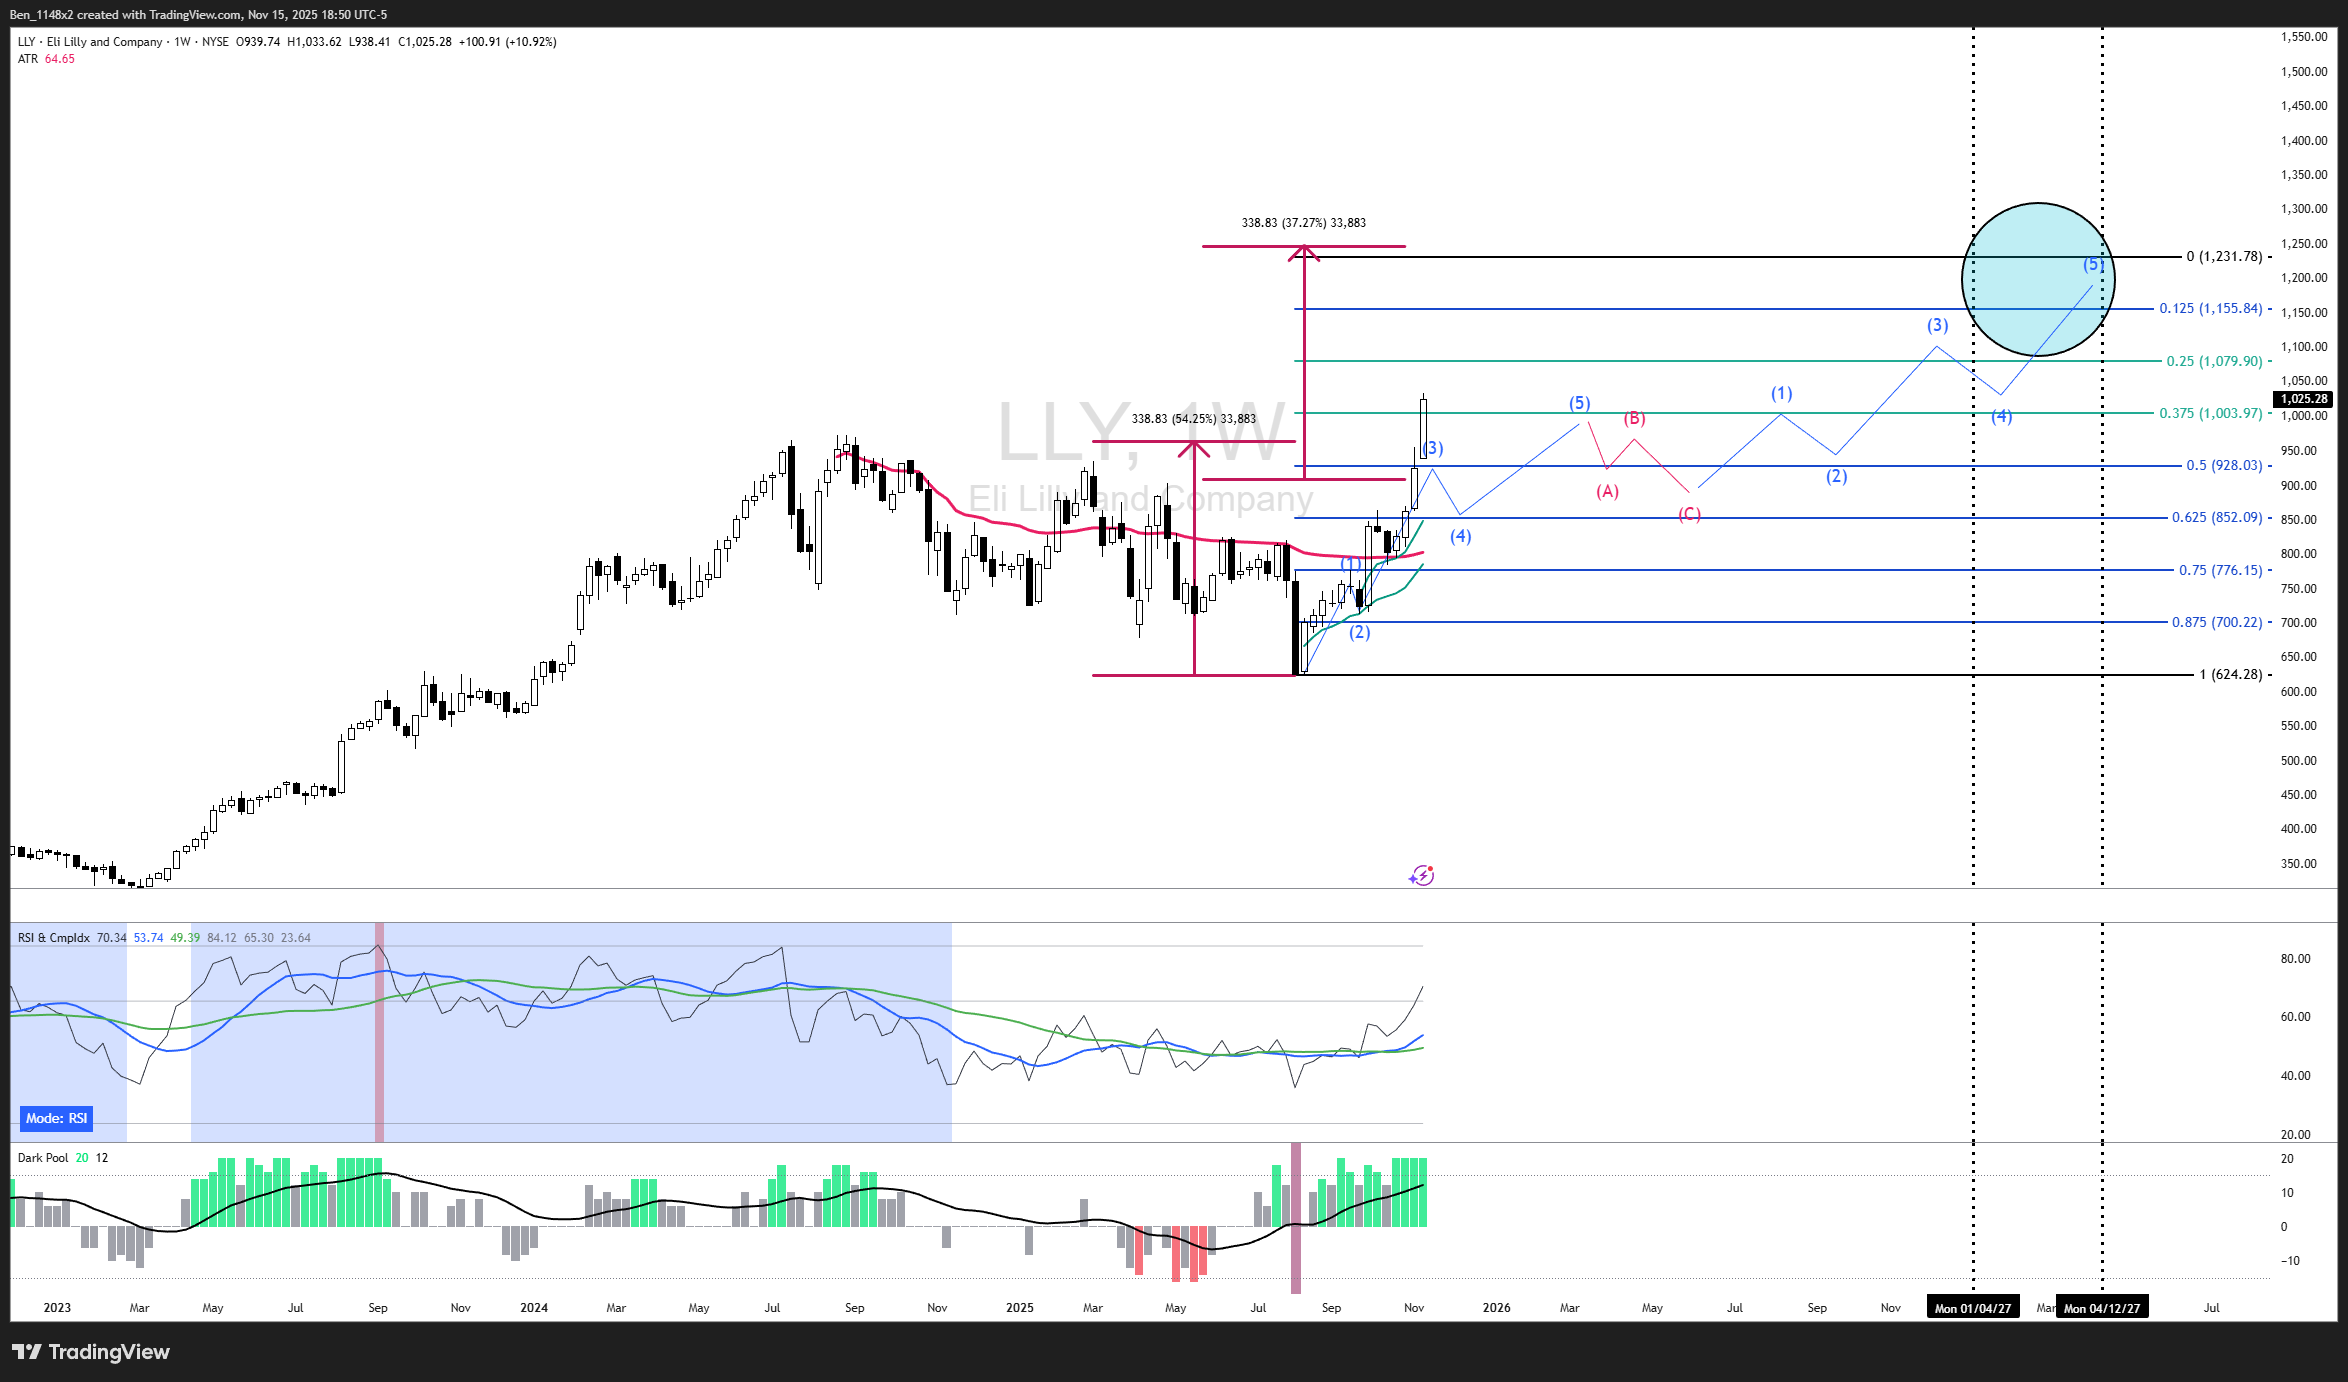
LLY
LLY had a great earnings response and is ahead of my forecast. This is a good reminder that slow drawdowns see steep recoveries and rapid drawdowns see slow recoveries.
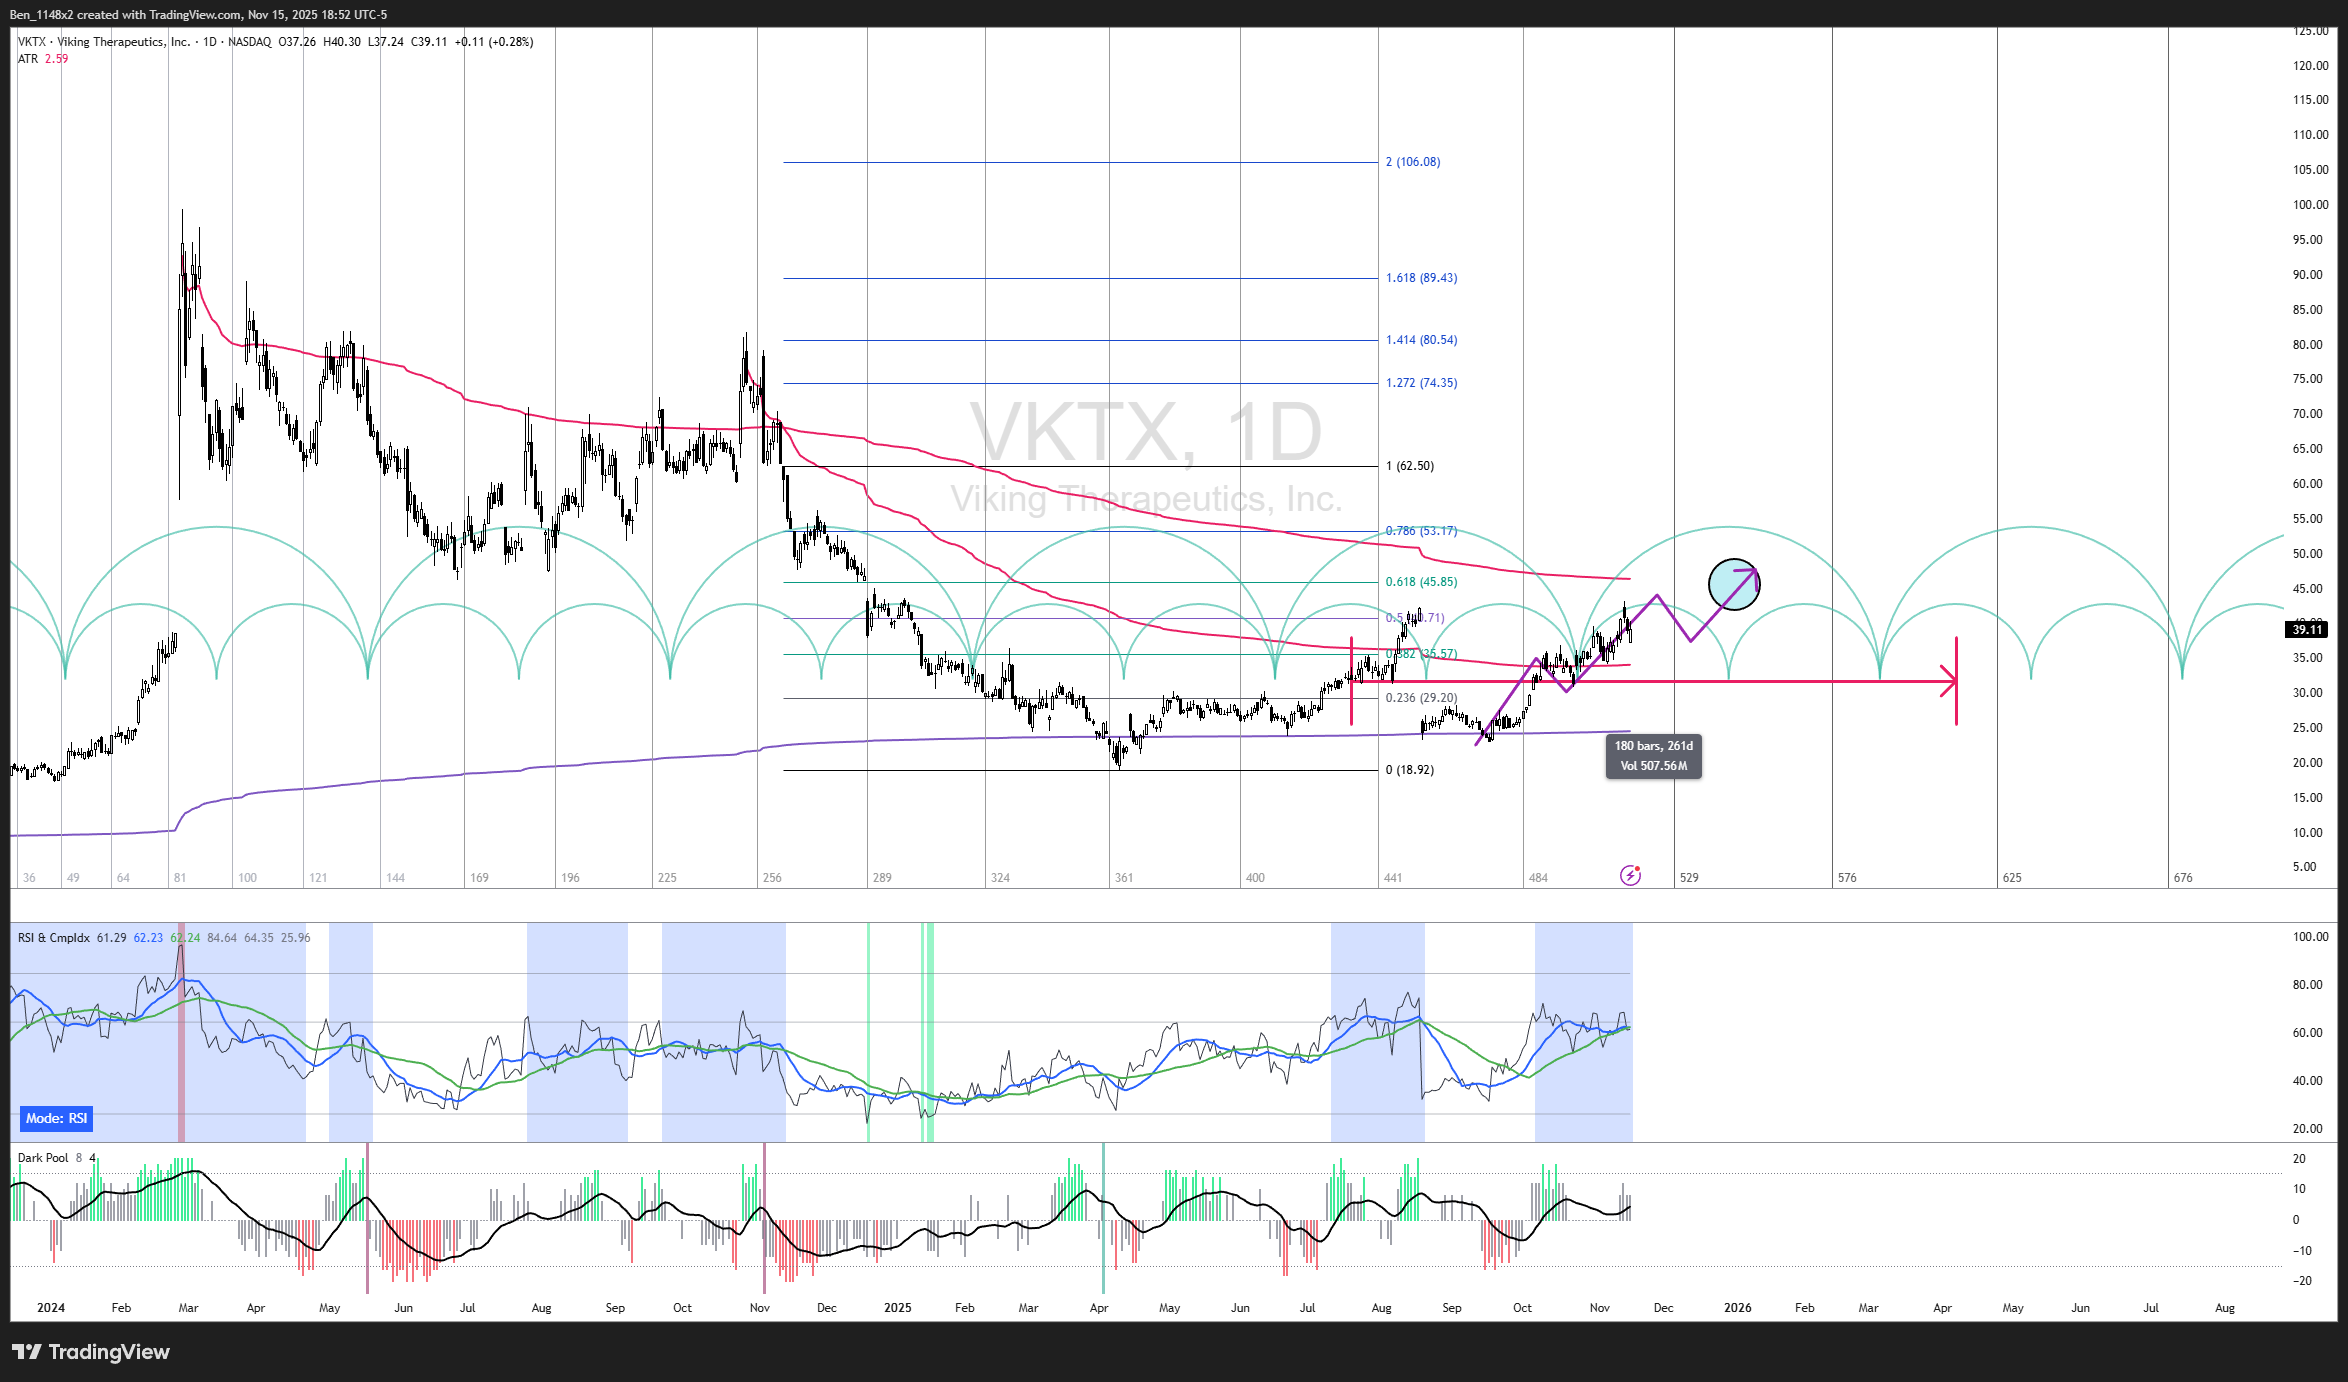
VKTX
VKTX is showing us steady accumulation.
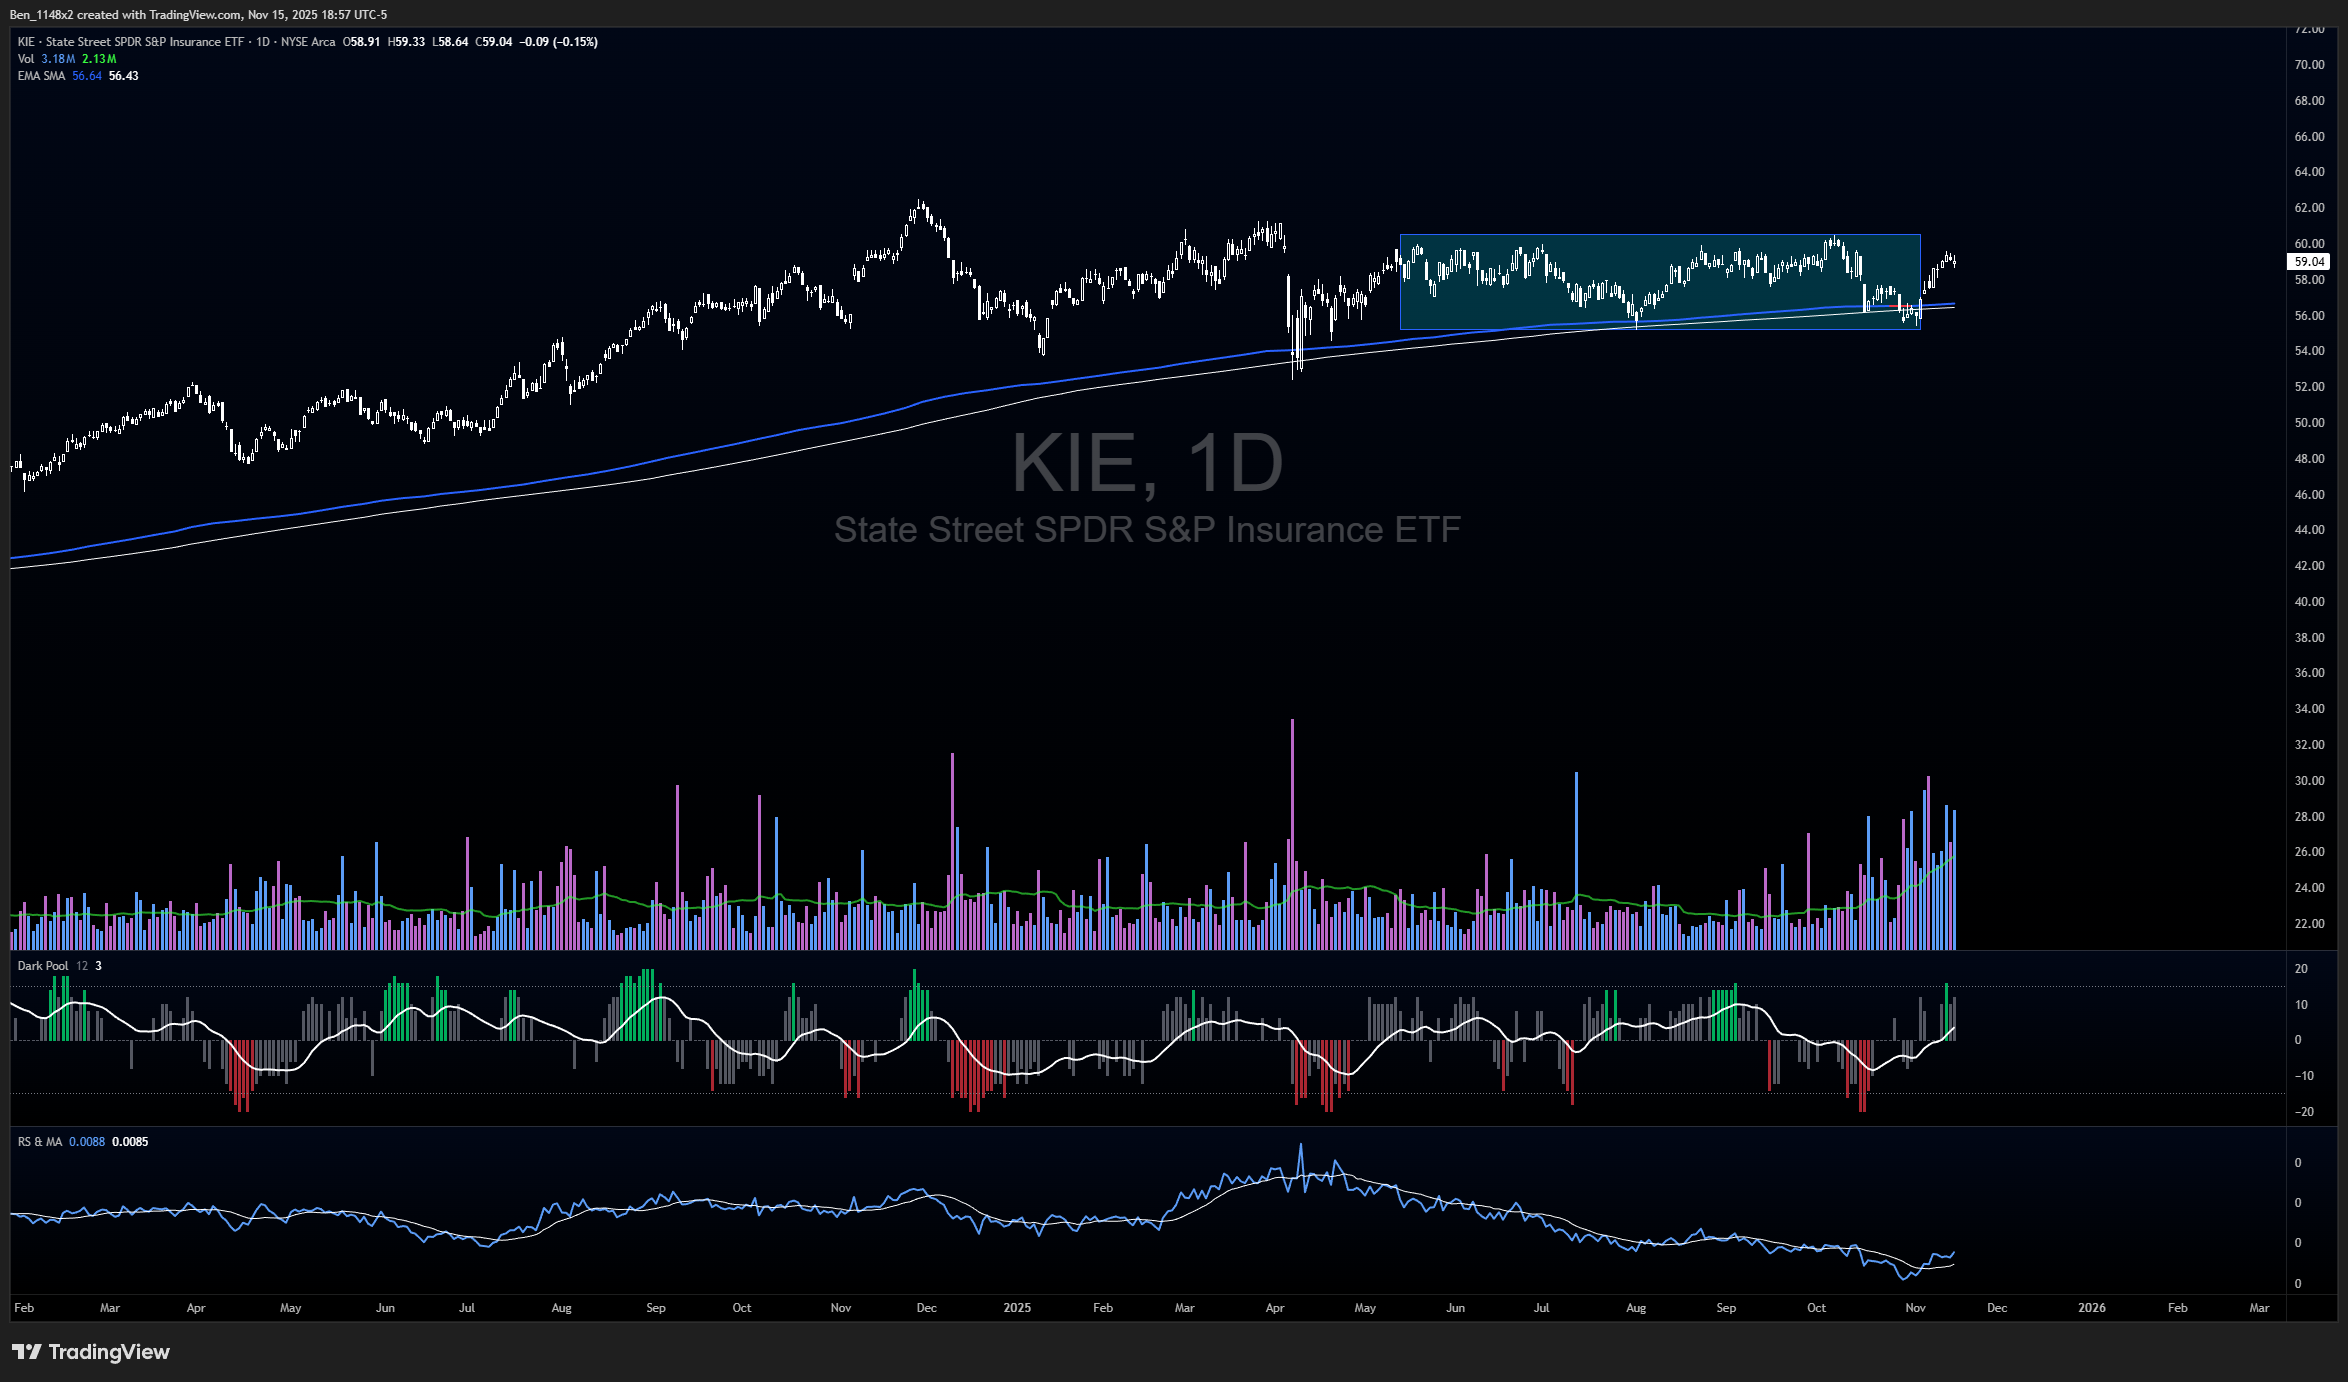
KIE
Insurance companies have done very well the past couple of weeks. KIE is reclaiming its 65w EMA after a period of consolidation.
Your BTC analsyis with the 325SMA is really interestig, especially the point about being below it for the first time since 2022. The 1335 day cycle framework tied to biblical references is a unique apprach I haven't seen applied to crypto before. If NVDA delivers strong earnings and we see the equity bounce you mentioned, that 11/20 pivot could indeed be the catalyst for BTC to reclaim some momentum.