Introduction
This weeks update focuses on:
The recent FOMC update
Market conditions and dispelled bear narratives
Seasonality
Individual opportunities
RDDT IPO
Exiting ASO
Updates to FCG and GIS
WMT vs AMZN vs COST
Staying out of BA
OPRA CCJ URA DOCU RSI CTAS
Macro and Markets
Macro
Economic news this week offered favorable prints for labor, manufacturing, and home sales. Despite not telling us anything materially new about policy, the FOMC held all of the markets attention. Some observations:
Powell stated that wage growth was not an inflationary concern. This tells us that they will not tighten further in response to current trends in the labor market.
Powell had a more relaxed demeanor. Recall 2022 when he started reading from prepared statements to this meeting where he cracked a joke and got a round of laughter during the Q&A. I don't know of a site that is still publishing this, but the amount of laughter identified in transcripts of FOMC press conferences increased in expanding markets. I can't recall the last time that there was any laughter during a FOMC presser. This might be one of the first since 2021.
https://www.brookings.edu/articles/quantifying-fed-laughter/
Next week we'll see updates for durable goods, consumer confidence, and the final GDP.
Markets
Earnings
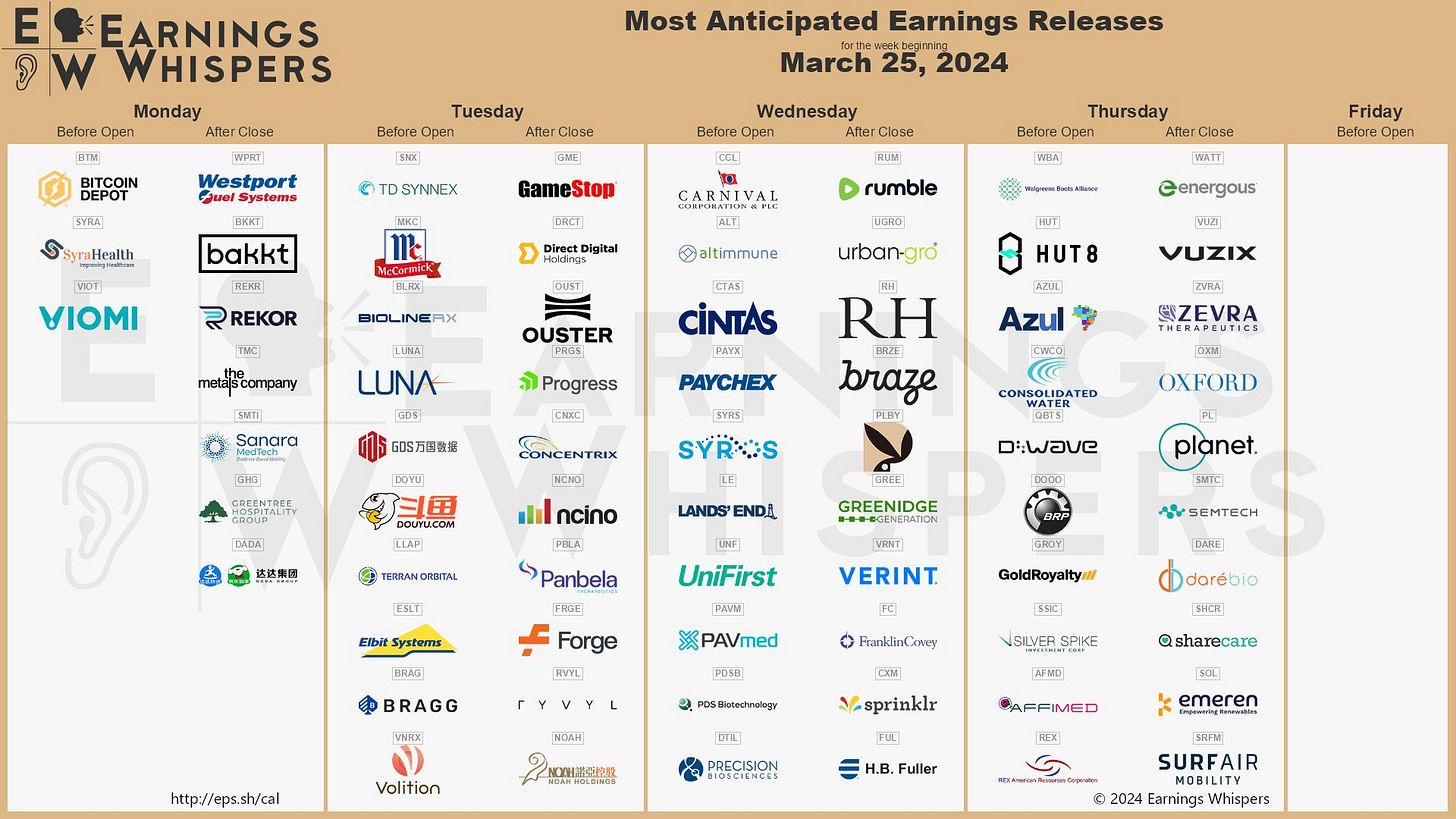
Earnings There isn't much on the earnings calendar that I'm interested in. I'll likely keep an eye on CTAS, CCL, MKC, and SNX for anything that we can extrapolate to sector and outlook.
Risk
As a reminder, I am following Andrew Thrasher’s guideline that will use the pace and timing of a 5% decline from a new 52-week high to signal risk of a large drawdown. These parameters currently equate to:
Alert: a close below $4979.47 on or before 4/12/24
Confirmation: once alerted, confirmation will trigger if we see 2 consecutive closes below ~4600-4650 by 6/13/24
Evolving Bear Narrative
We've heard a lot of bear narratives throughout this amazing run. Their creativity in finding something new to be afraid of is impressive. Here are some of my favorites:
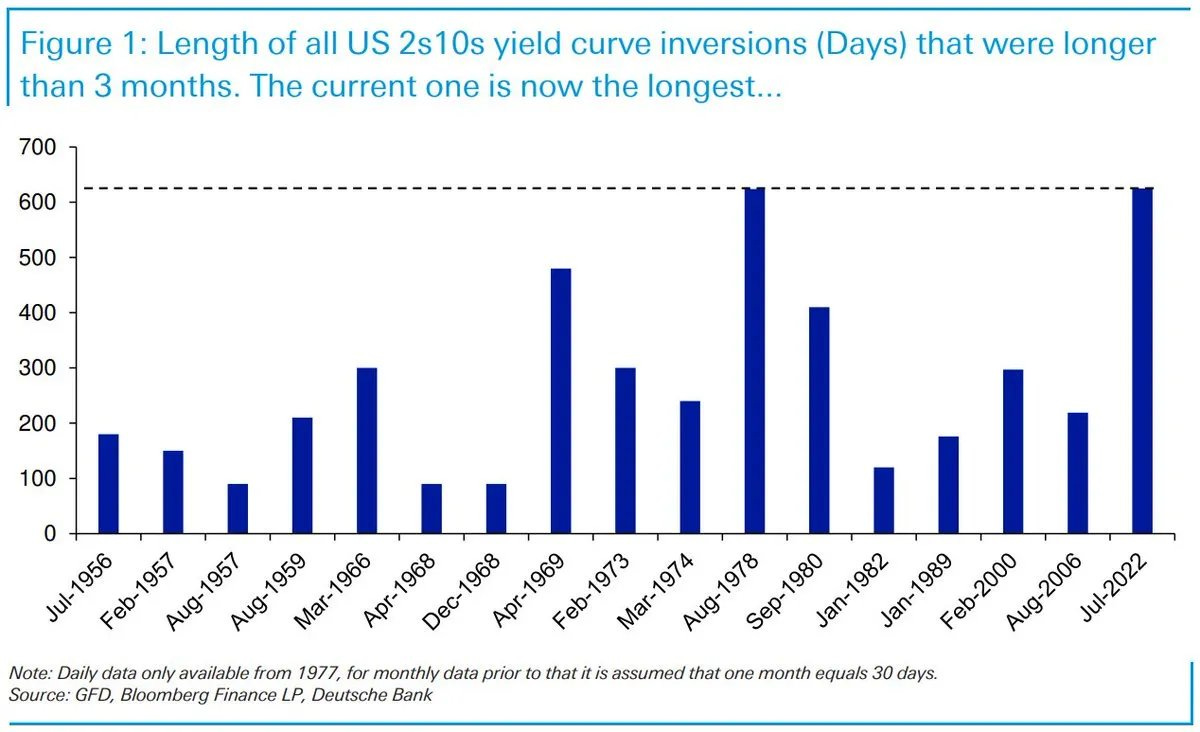
The yield curve is possibly the worst market timing mechanism. This is now the longest inversion of the 2 and 10-year treasury yields. Which is exactly what we should expect to see happen when we go from 0% to 5.5% Fed funds within a year. When it finally reverts it will have been so long that people will forget that it usually inverts and reverts multiple times in between recessions.
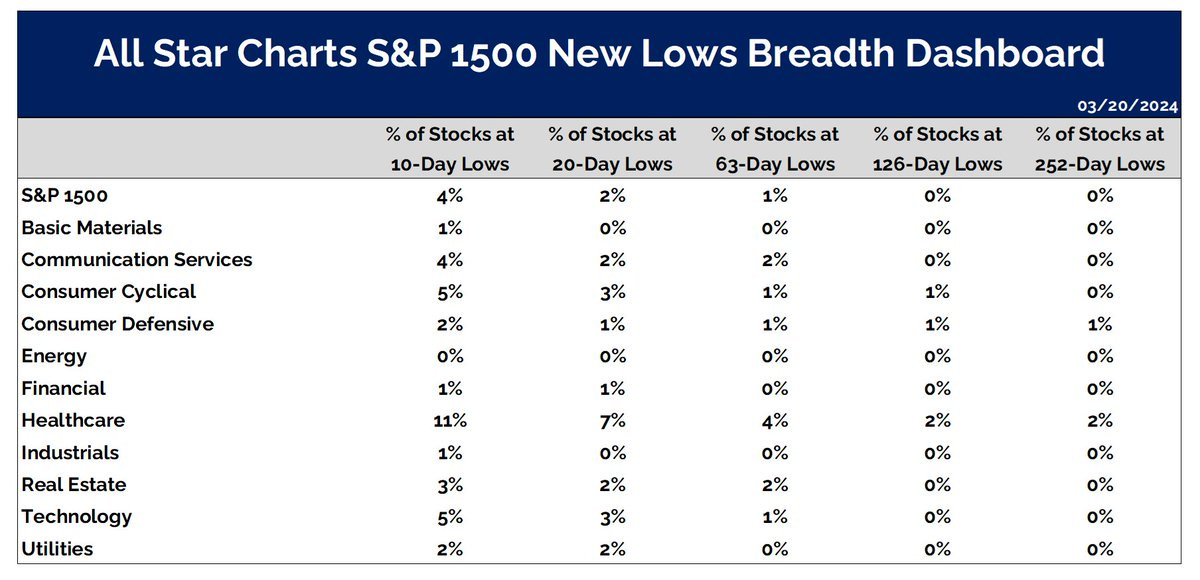
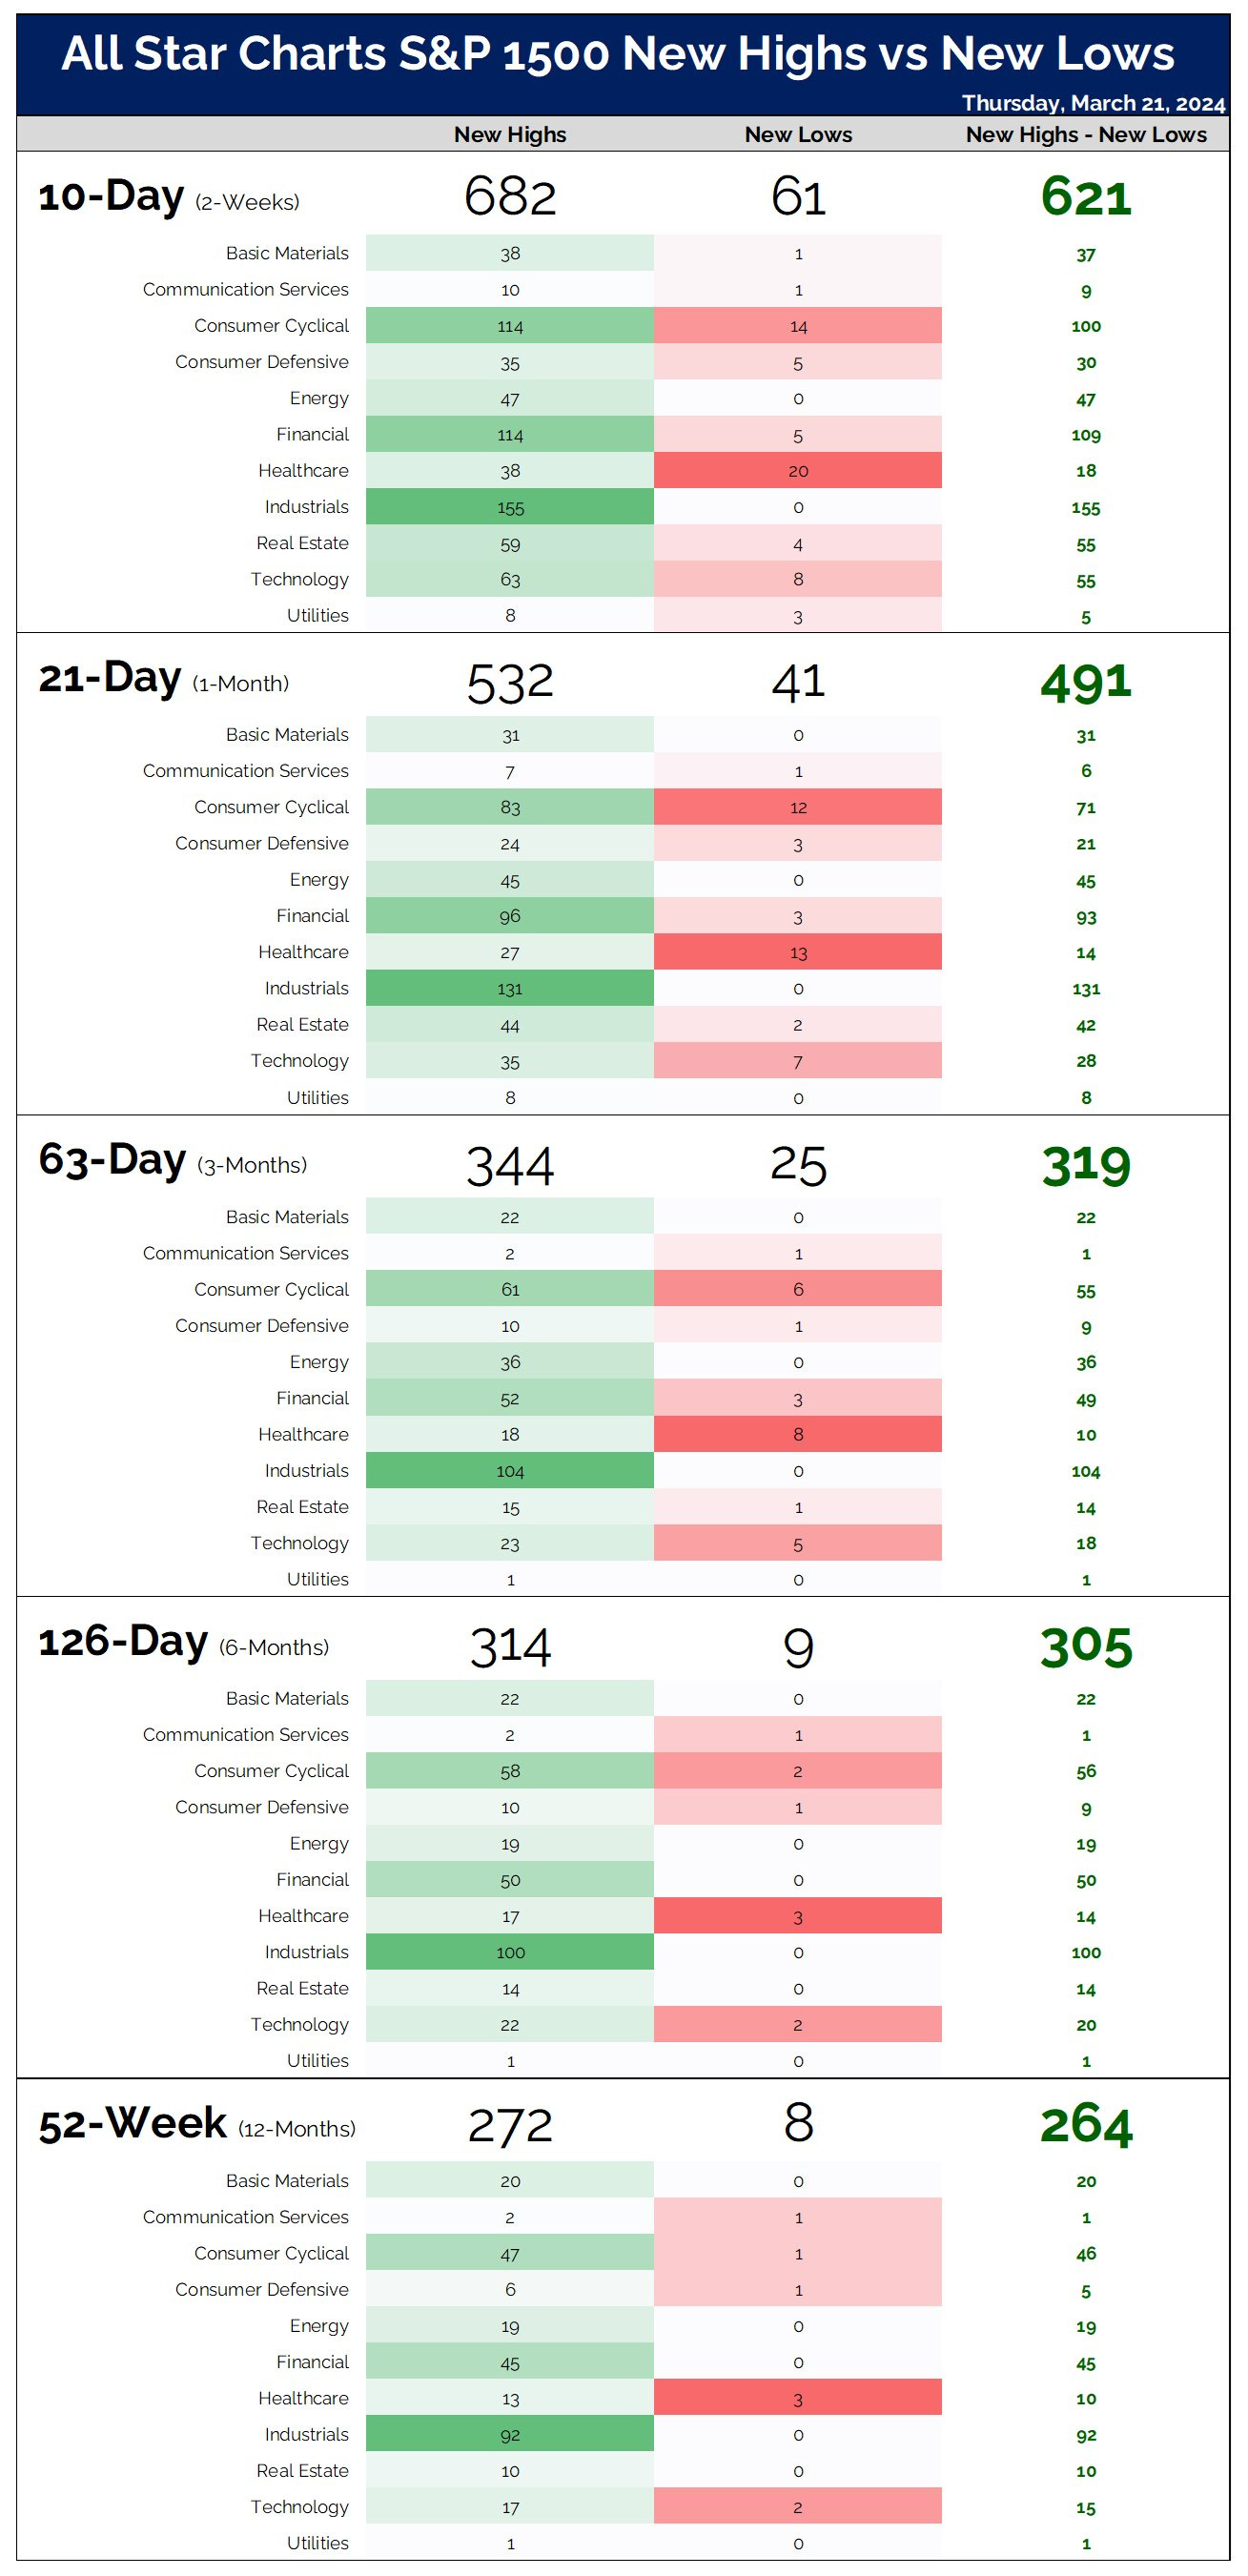
My next favorite is breadth, because even I was getting worried about it last month. Breadth is the number of stocks making new highs versus those making new lows. Do you remember when the bears were worried about the market being driven by only 7 stocks? That was right before they (and I) got worried about breadth. Now that breadth has been solved they are worried about the performance of those 7 stocks.
Seasonality
A reminder that April is historically one of the strongest months in the market and the end of the strongest 6 seasonal months in the market. This becomes a riskier time to allocate to broad market indexes and a stronger time to take profits in short term positions.
Retail Participation
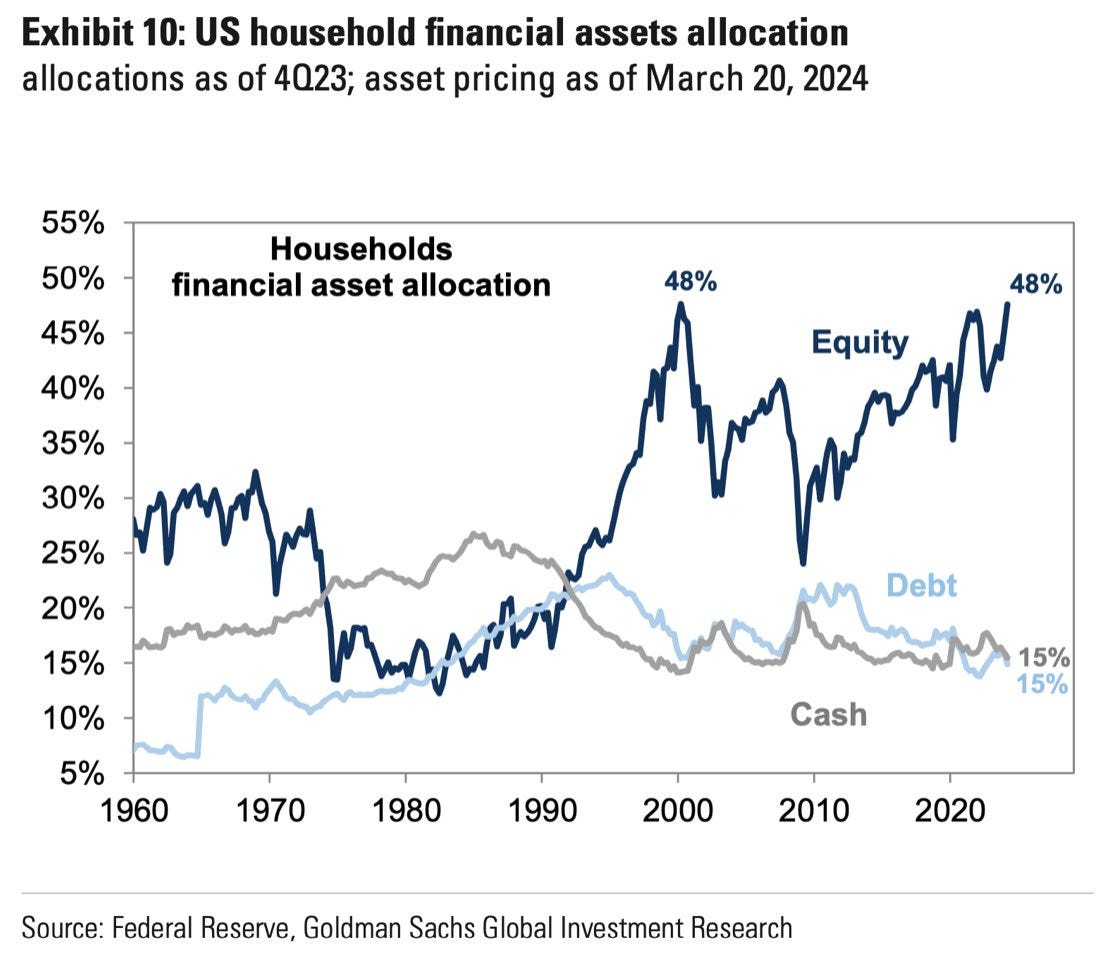
Retail investors have their greatest exposure and participation in the stock market since 2010. Households make up 39% of the ownership of equities, with equities representing 48% of household assets.
Central Bank Liquidity and High Yield Rate Spread
Net liquidity has is currently above the sept 2022 and sept 2023 lows, but down 3.7% YTD. Equities front run announcements of liquidity changes, but have a lagged (~5-8 week) reaction to unannounced changes. Inflation will also move with a sustained change to central bank liquidity, and has about an 8-10 week lag from changes in liquidity. Recall that we saw our higher than expected inflation prints in February about 8 weeks after the high in liquidity in December.
Does this mean that stocks will fall? Not necessarily. A strong economy and robust markets should not require central banks to support liquidity with their balance sheets. The reasons for central bank liquidity and tightness in the credit market are what matter.
Note that equities also have an inverse relationship to high yield rate spread (blue). This is the spread between rates of a mixture of low investment grade bonds to high quality investment grade. When this figure rises equities usually fall. Particularly if central banks are tightening balance sheets.
Opportunities
Industrials
Industrials are on an absolute tear. XLI has established some decent supporting volume at 122. The next area for overhead resistance looks like it's in the 130-135 range. If you're holding a company in the industrial sector that isn’t performing well, this might be a sign to reconsider your position.
RDDT IPO
I posted midweek, hoping that someone might avoid the pitfalls of the RDDT IPO. One of the most fascinating aspects of markets is our tendency to repeat historical mistakes, despite having easy access to a wealth of historical data.
I analyzed 120 IPOs from November 2022 to January of this year. I selected this cohort to ensure they all experienced the same bull market and had at least two months of price history available via Excel's stockhistory query.
Only 16% of these IPOs saw their price increase from the closing of their listing date within the first week. And only 26% had a higher price after two months. An interesting counterpoint was someone mentioning they bought META at IPO and are up 1130%. However, had they waited two months to buy META, their gains would be around 1750%.
RDDT’s price performance, in this context, is not surprising.
RDDT’s price performance, in this context, is not surprising.
ASO exit
I was previously bullish on ASO for the long term and was gradually building it into a core position. They had a strong growth story, consistent earnings beats, were paying down debt, and growing cash flow, seemingly unaffected by adverse conditions reported by competitors. However, this week's earnings miss and the earnings call marked a complete 180.
“If you buy for a reason and that reason is discounted or is no longer valid, sell!”
-Marty Zweig
The earnings call revealed the following red flags:
The earnings call revealed several red flags:
The growth story changed, with projected sales growth now ranging from -1.5% to 3%. Despite expanding their footprint by 5% last year and planning another 5% this year, sales could still decline.
They face challenges with new stores in new markets, which are slow to contribute to the bottom line, posing a growth headwind.
Their sales miss was attributed to incorrect economic statements, repeatedly claiming consumer weakening and pressure – a view not supported by broader economic data or other company earnings. These statements raise questions about competence or honesty.
The addition of a lot of outside executive leadership is a wildcard. It could benefit them long-term, but being top-heavy with external hires during challenges isn’t necessarily a selling point.
The composite index and log of the detrended price oscillator rolling over is an unfavorable sign. Price is likely headed to the 55-60 range.
This charge uses:
SuperGuppy EMA: A series of exponential moving averages ranging from 3 days to 200 days.
RTI (Relative Trend Index): Measures the strength of the trend's direction.
PVI and NVI (Positive and Negative Volume Index): Ideally, both should trend higher and above their moving average.
Counterintuitively, an increasing NVI above its moving average has a 96% chance of a favorable future outcome, while below it has a 50% chance.
PVI increasing and above average has a 79% chance of a favorable outcome, but only 33% when below and trending down.
RTI and NVI rolling over are not good signs. Price fell through all of its moving averages, which will start to roll them over.
FCG update
Recall this update (Tactical Moves for February) where we identified opportunities in energy and FCG. Both are playing out well, which is fortunate, as a handful of other opportunities were exited at a loss. This underscores the importance of disciplined exits at your invalidation point. With a 3:1 and 4:1 risk-reward ratio, we can exit opportunities and let winners run.
I have started taking profit on FCG and plan to completely exit during April.
GIS update
I posted about GIS last week, outlining multiple scenarios within these VWAPs before a recovery with the blue uptrend. Trading close to earnings is risky (which is why I generally avoid it). In this case, wild sentiment with earnings took us through the uptrend scenario all at once. This is also a great example of how quickly price can move through an air gap.
Price is likely to stabilize between here and ~76-77. Note that not many consumer staples are entering uptrends right now.
WMT vs AMZN vs COST
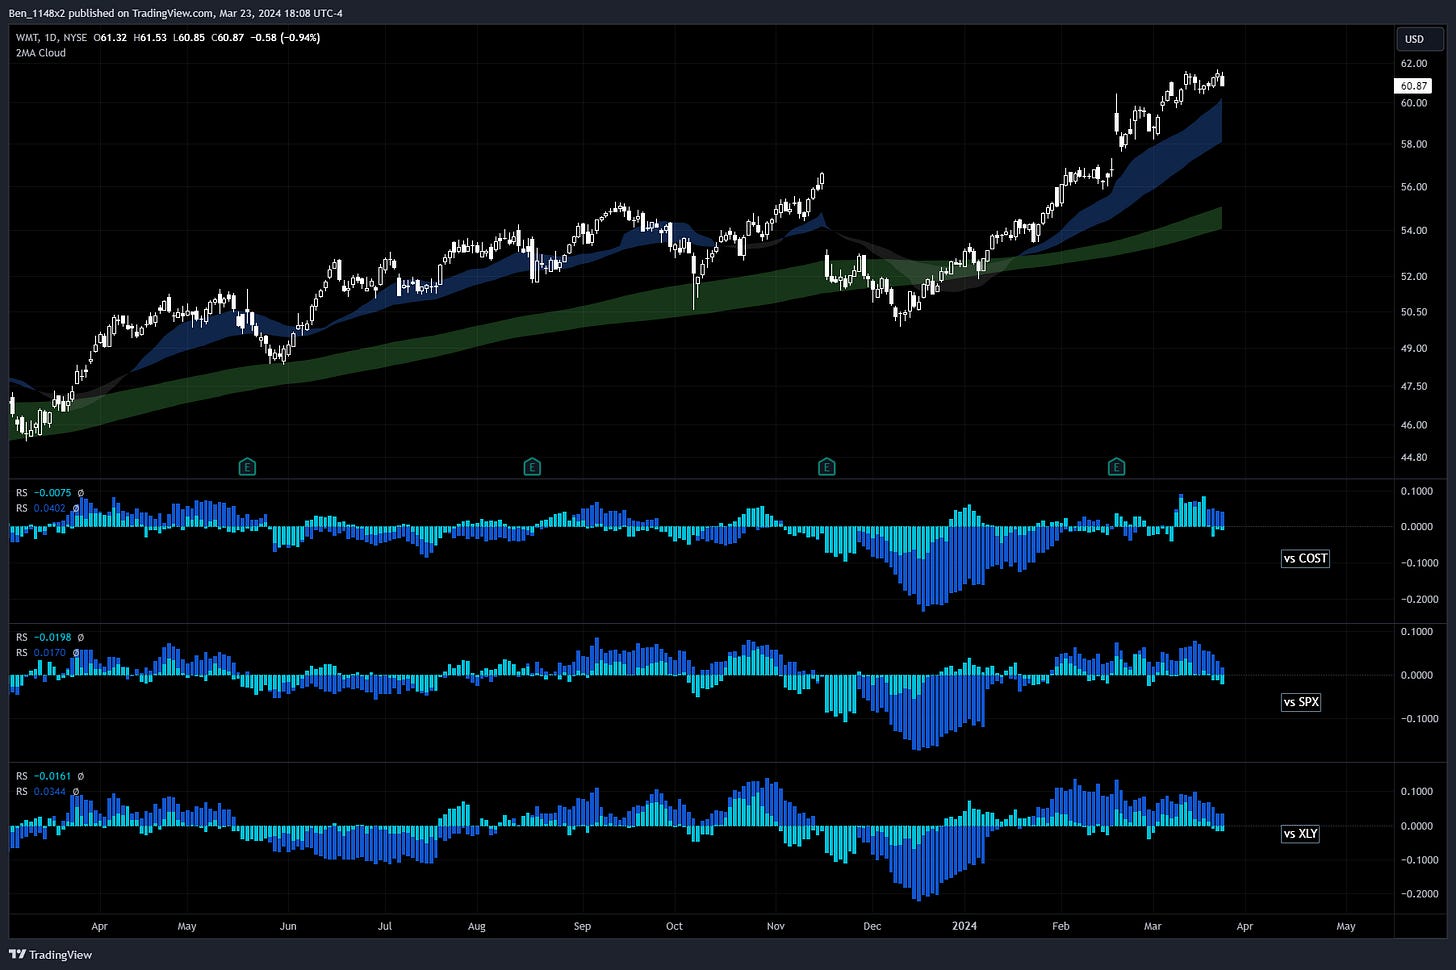
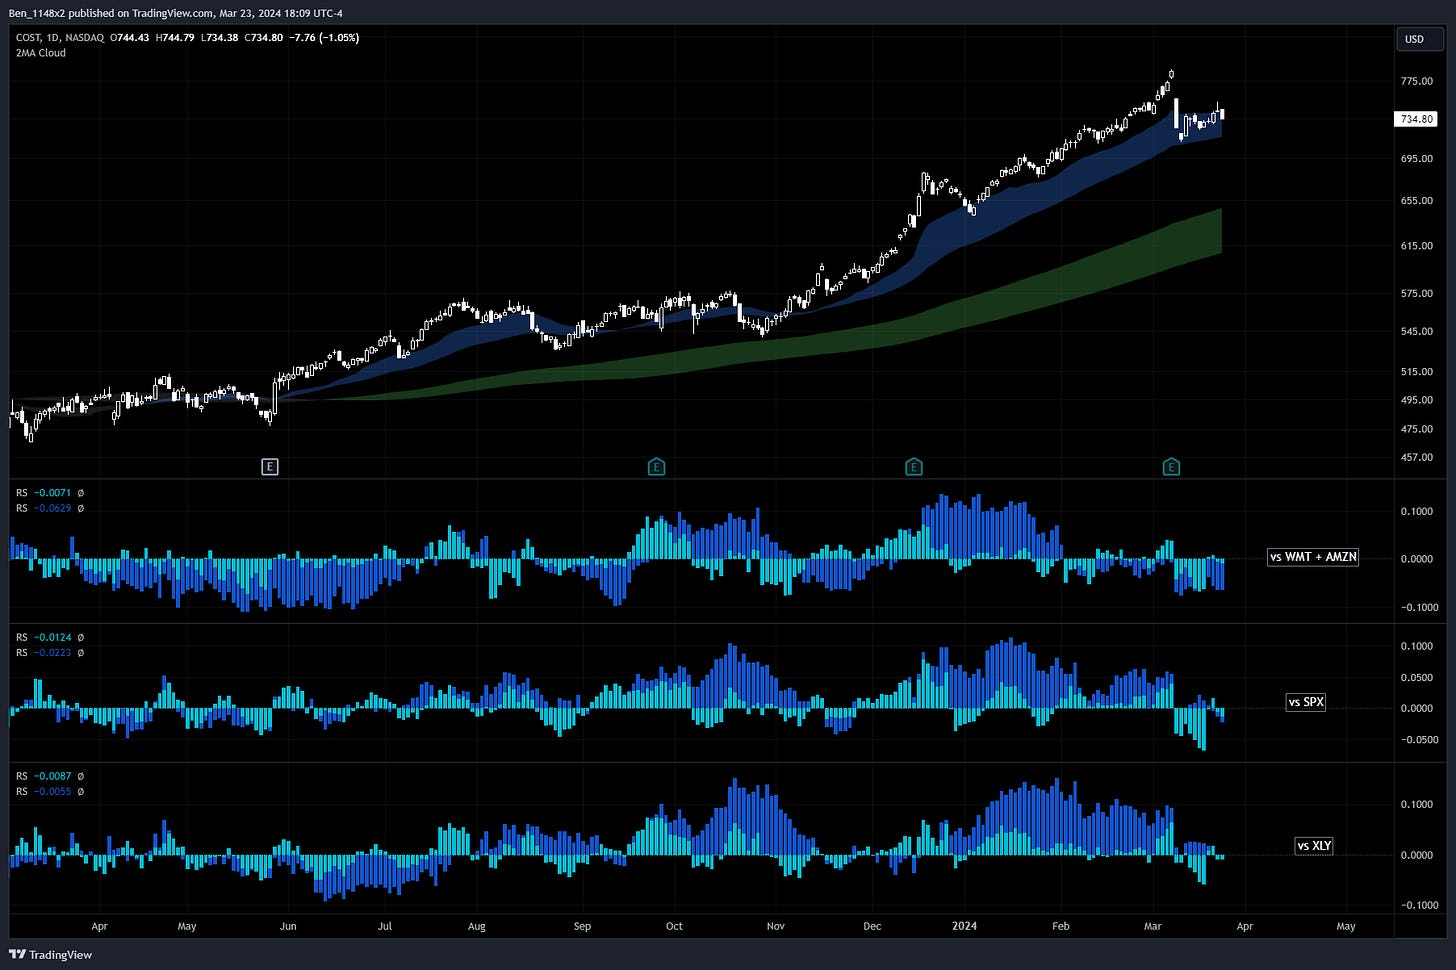
All three are strong businesses with great balance sheets that are unique from one another. Here is a relative strength comparison of WMT and AMZN to COST, the S&P, and a consumer discretionary sector EFT. The last chart compares COST to
WMT + AMZN. WMT was last to establish a strong uptrend in this group. and has only show recent relative strength over COST and over the broader market. The current uptrend is strong and steep. However, their sales and EPS growth remain in single digits.
AMZN is much more than a retailer. They have had modest recent strength relative to COST, have been strong relative to the S&P and their tech offerings crush the performance of consumer discretionary. Sales remain in double digits, as does diluted 3 year EPS.
This chart suggests that COSTs impressive run is cooling. They have dipped to their 50 EMA and are showing recent relative weakness to WMT+AMZN, and to the S&P. The comparison to XLY is for consistency sake, but they are in the consumer staples sector. They have double digit 3 year diluted EPS growth and single digit sales growth.
BA
I like getting questions about stocks that people are considering. This week I took look at BA.
I anchored two volume-weighted average price (VWAP) measures to the most recent highs. When a stock tries to recover from a downtrend, previous buyers often use the opportunity to cut their losses, making recovery difficult.
The purple lines below are VWAPs anchored to its initial listing. These can be a strong draw over time, and BA has revisited them during downturns. I'm surprised it hasn't tested the first one yet.
The blue bars align with high volume areas and Fibonacci levels that price tends to gravitate toward.
The Fibonacci fan should be valid for support and resistance until it makes a new high or low.
I took a fractal from the red circle. The market tends to revisit patterns of behavior, and that is a classic sentiment cycle bottom. However, I view things like these as scenarios, not predictions. If it follows the scenario, I know what to expect. If it deviates, I need to consider a new approach.
From a qualitative standpoint, this company is not well managed, which is a scenario that I avoid. There are too many strong opportunities in the market for me to trust poor leadership with my money.
OPRA
I’m trading OPRA for the third time in four months. Entry was at 15.60. My stop is tight at 15.12. Profit-taking targets are identified at 16.13, 17.02, 17.54, and 18.37 for a 3.5:1 risk-reward ratio.
Note that it’s close to being stopped out. I’ll be surprised if I’m still in this position by EOD on Monday.
CCJ
CCJ performed well throughout 2023, along with several companies in the uranium sector. The recent test to find support at the 200MA is a strong sign of continuation. I plan to make two entries: one here and another on a retest of this level. My target for profit is 54, with a stop at 40.77. This sets up a risk-reward ratio (R:R) of 3.8:1.
URA
Earlier this month, I drew a sentiment cycle fractal for URA. It didn’t dip as deep into support as I initially thought it might, but it followed the flow of the sentiment cycle perfectly, moving from despair, to the wall of worry, to anxiety, to denial. I like catching an opportunity to jump in at the denial stage.
DOCU
I'm playing this one tightly. Entered at 58.48. I’ll take profit on two-thirds of the position between 60.20-61.60 and then let the rest ride with a trailing stop. I’ll exit quickly if it does not maintain an uptrend.
RSI
This stock has nice potential. Overhead resistance points are likely at 7.20 and 8.45. Invalidation is below 5.80, but I’ll start to be concerned if it moves below 6.30.
CTAS
CTAS is a fantastic company that is chronically high-priced. It's had a steep run, but note that it broke above the top of its Bollinger band on 3/21, followed by the band widening on 3/22. This is typically followed by a move higher. The best entry point would likely be a retest around ~630, which would coincide with the basis line within the band and a high volume area on the visible range volume profile.










OUTSTANDING Ben. Really great stuff TY Michael